Using IntelliJ
Writing code, debugging code, and running tests in IntelliJ.
Table of contents
Welcome to IntelliJ IDEA! This guide will provide an interactive overview of how to use IntelliJ to work on homework 1. As the quarter moves on, we’ll learn more advanced features of IntelliJ. For complete documentation, refer to the IntelliJ online help reference.
After you’ve imported code as a new project, the default user interface looks as follows.
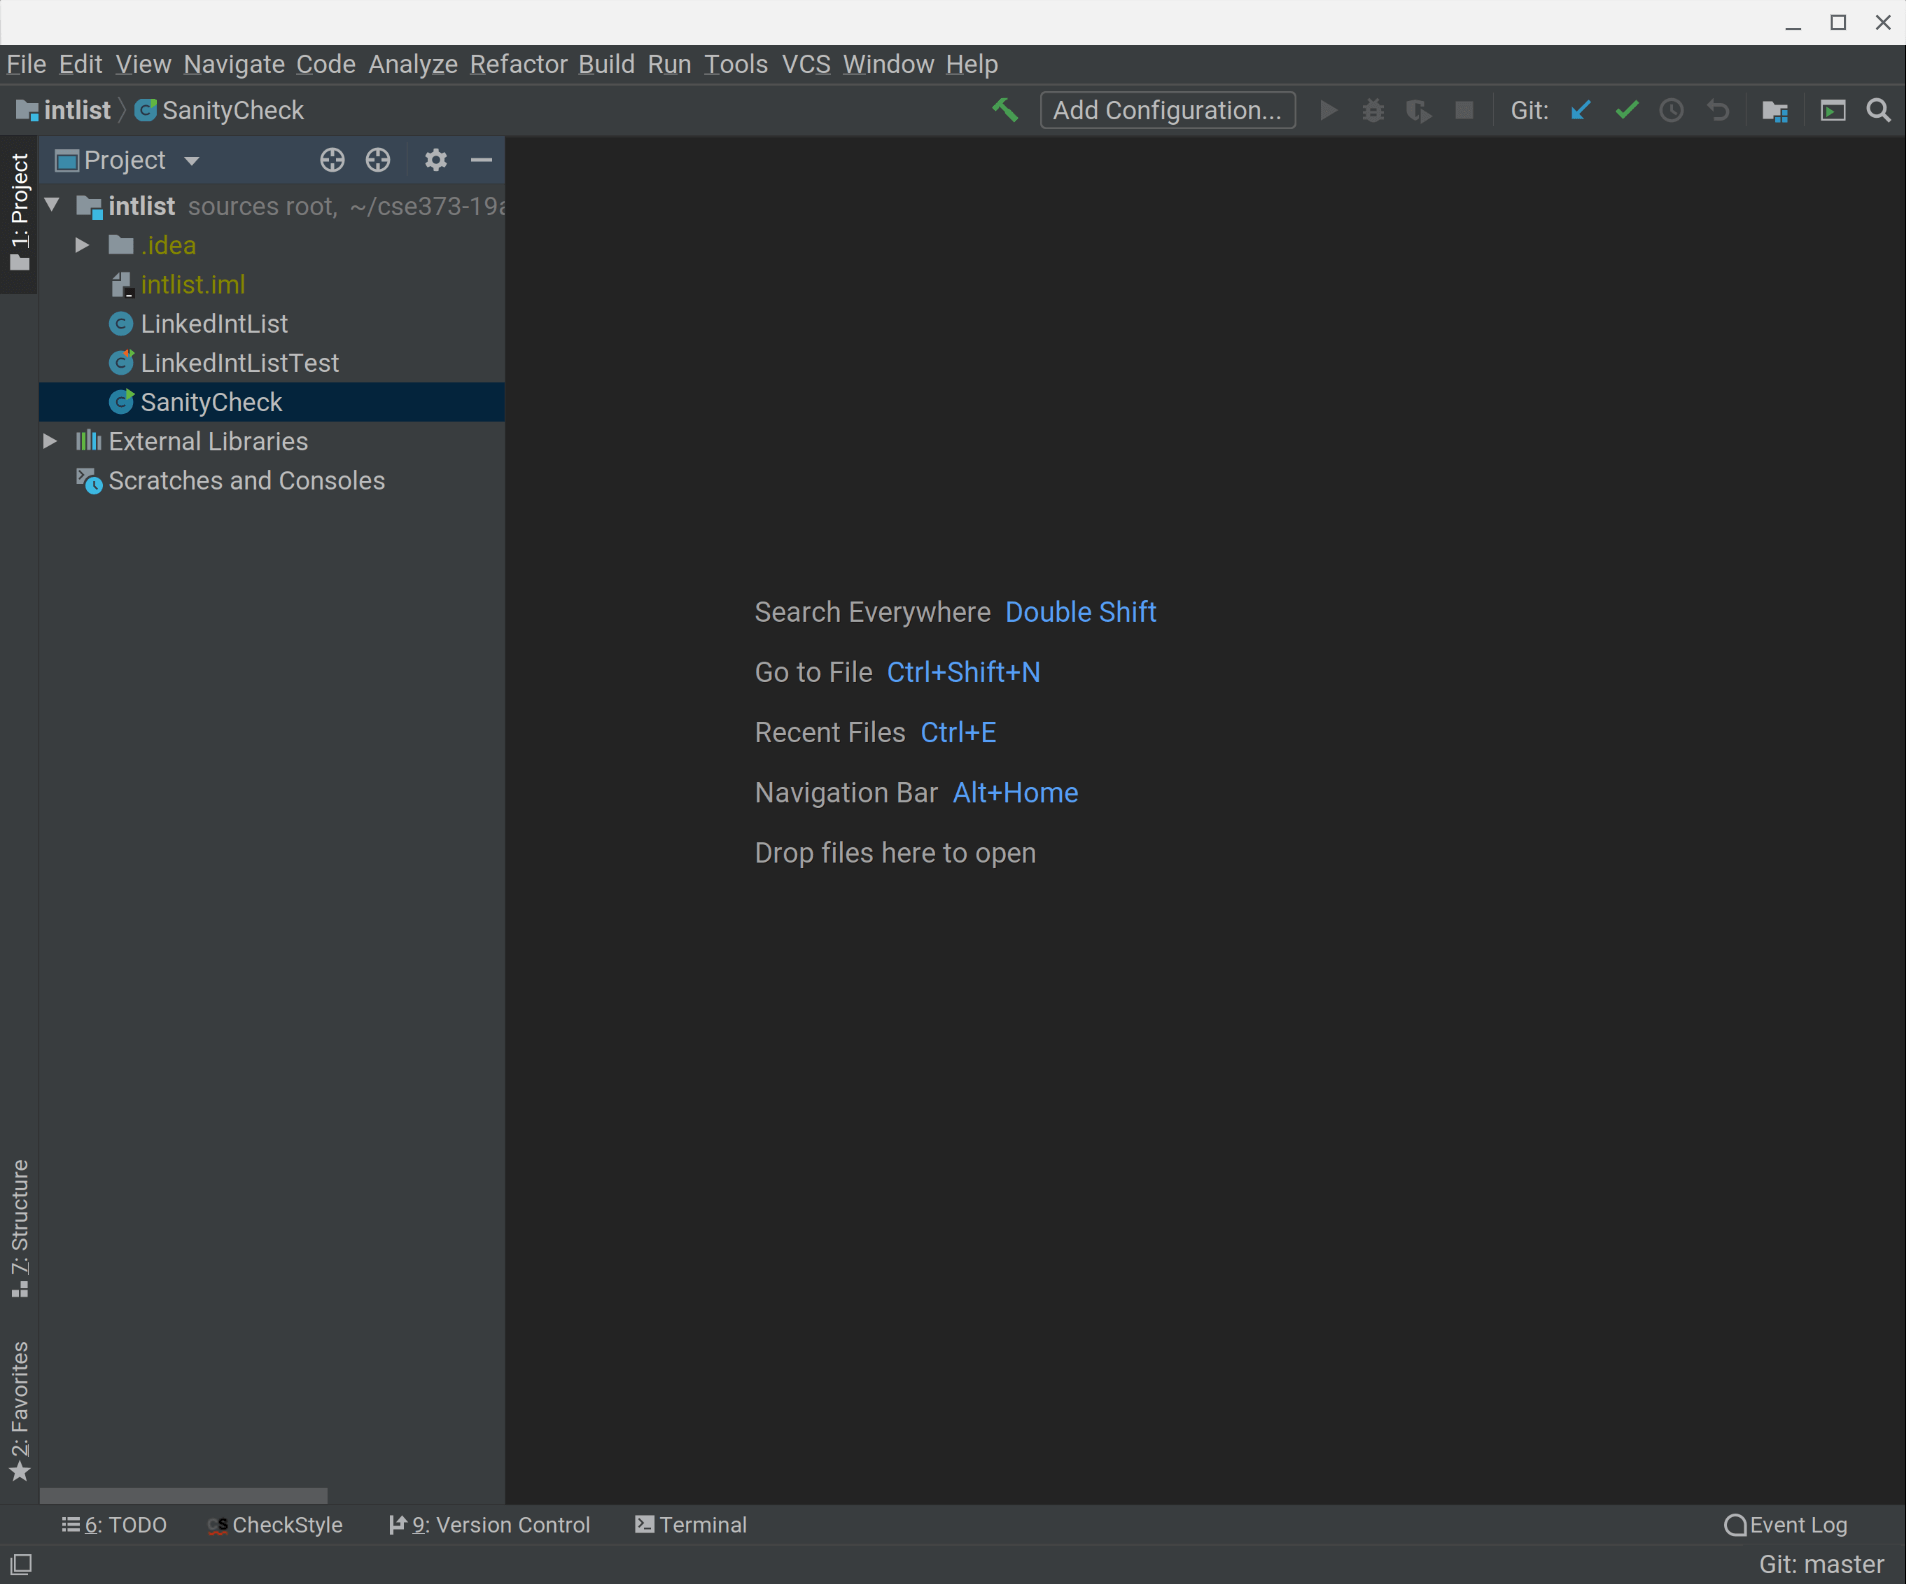
To reduce clutter, we recommend hiding the tool window bars that line edges of the window. Tap on the icon in the very bottom left corner of the interface. Or, from the View menu, go to Appearance and uncheck Tool Window Bars.
The Editor
In the center of the screen is the Editor. No files are open, so IntelliJ just shows some common keyboard shortcuts. To open a file, look to the left of the editor for the Project tool window, which shows the structure of the project. Open SanityCheck.java by double-clicking inside of the intlist folder.
The SanityCheck class will appear in the editor. This class contains a number of Checkstyle violations. Expand the Checkstyle tool window at the bottom of IntelliJ. By default, there won’t be anything in it, but tapping the green play icon on the left side of the Checkstyle tool window will display all Checkstyle errors in the current file. (You may need to set the Rules to the “CSE 332 Checks” that we setup earlier.)
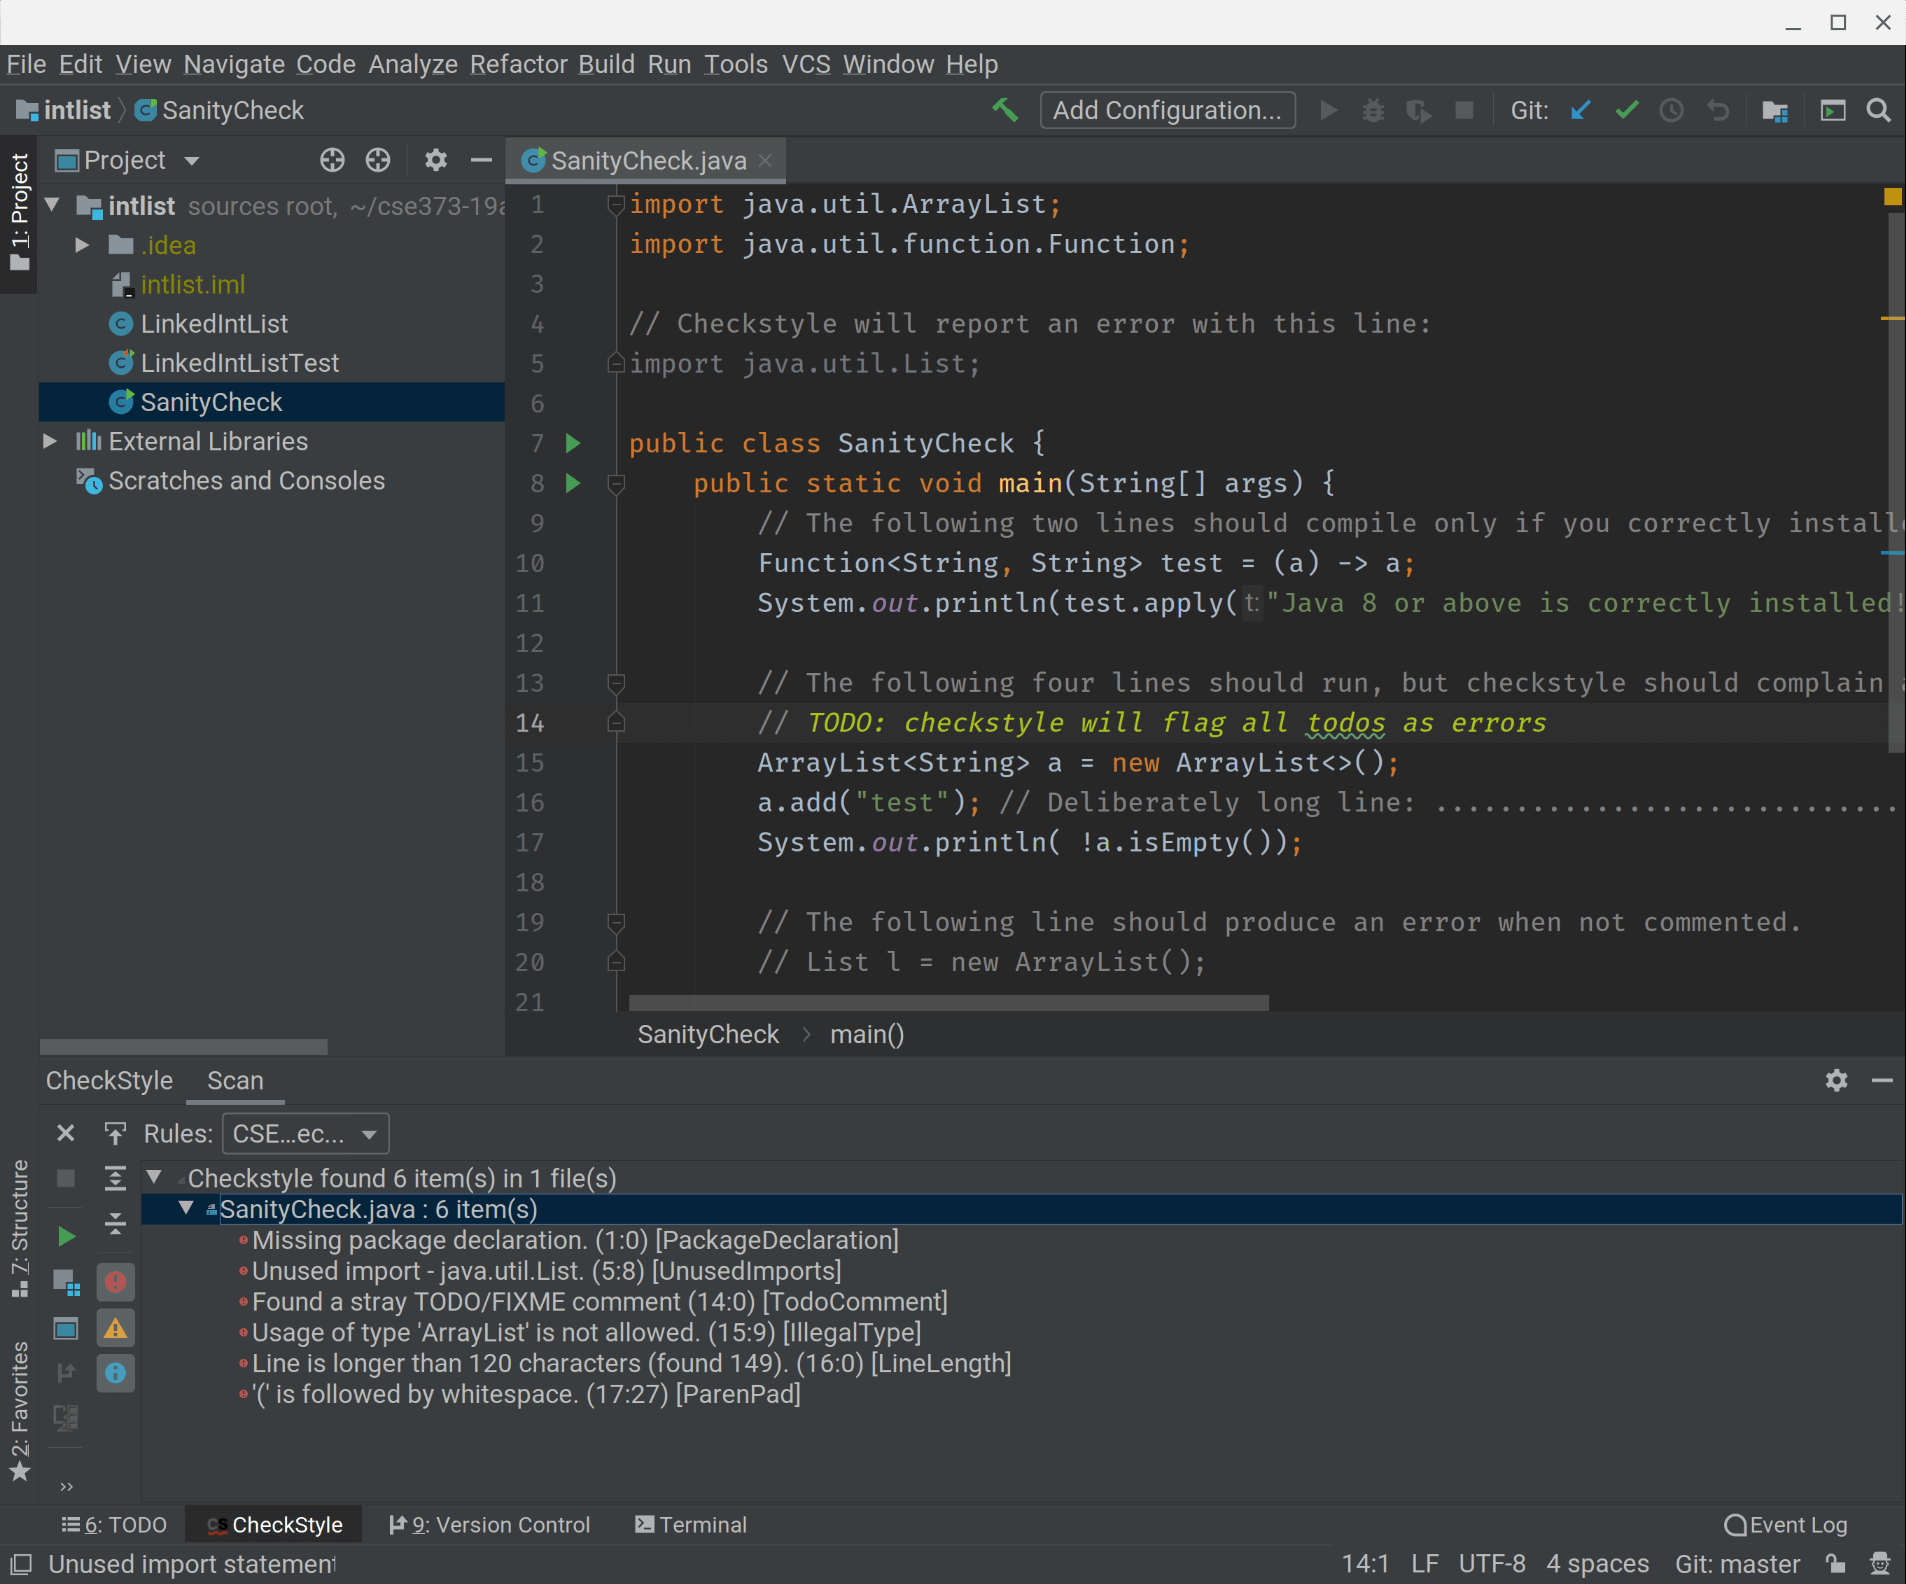
For most homeworks, a percentage of the final score is allocated to code style. However, unlike CSE 143, our code style is managed entirely by Checkstyle. Once you resolve all of the Checkstyle violations, you will receive full credit on the style portion of an assignment.
Running Code
None of these style errors should affect our ability to run code, however. Right-click the SanityCheck file in the Project tool window and tap Run ‘SanityCheck.main()’ to run it. If the system is properly setup, you should get output that looks like this:
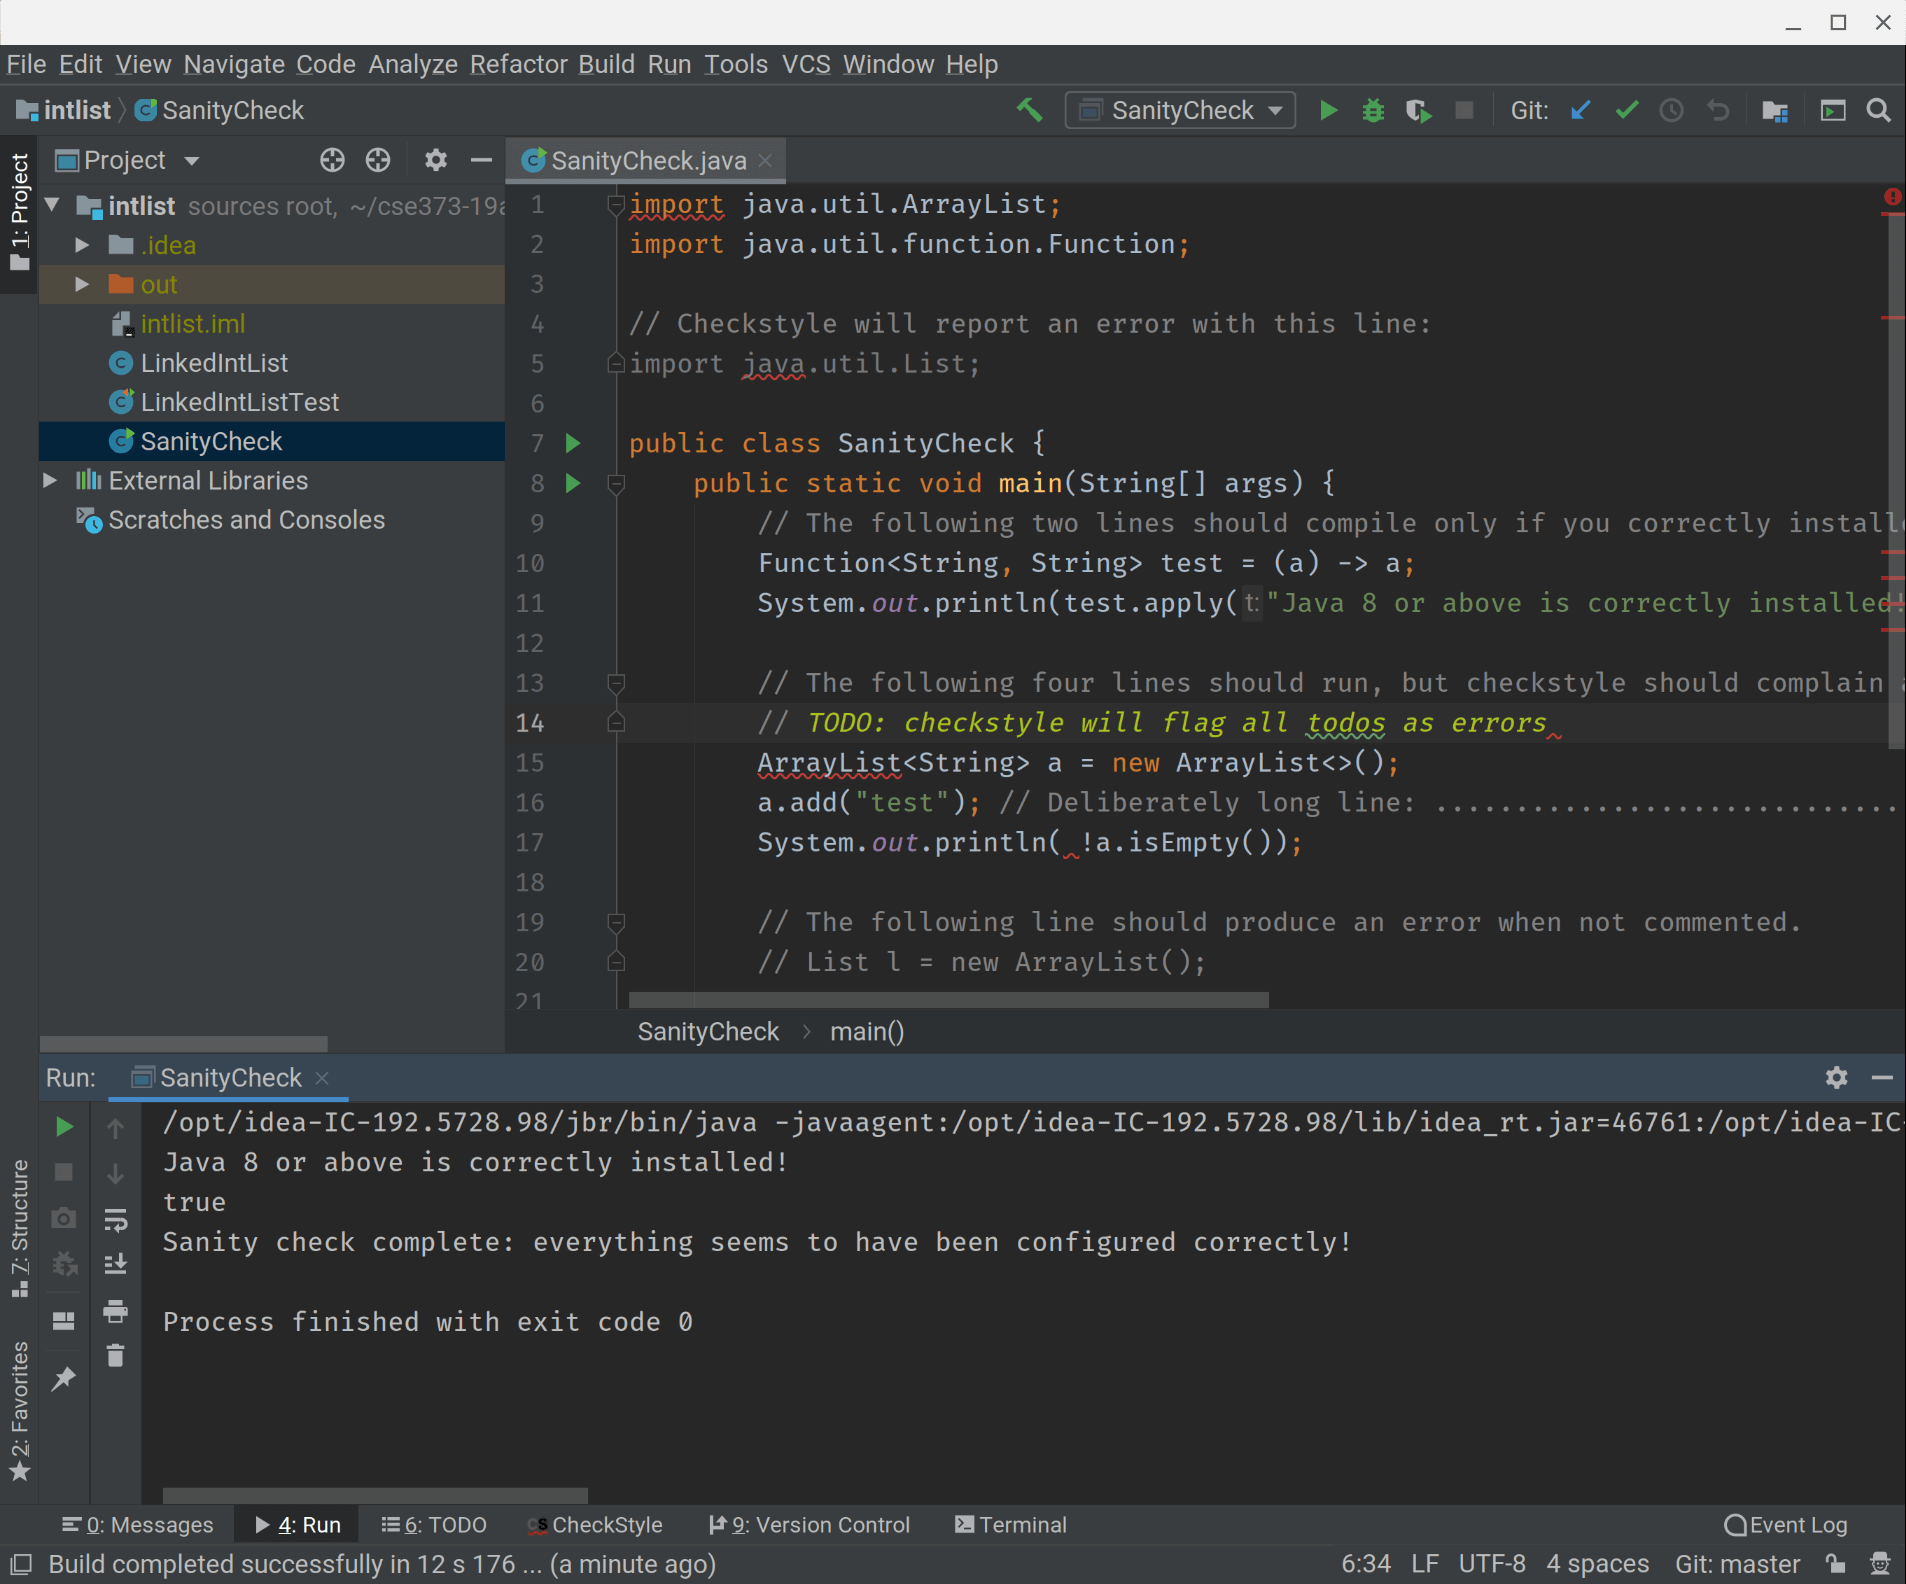
Above the editor window is the Navigation bar. Note that, after running SanityCheck.main, what used to be the Add Configuration… dropdown now reads SanityCheck instead. IntelliJ will automatically remember the files you’ve run as run configurations. To the immediate right of the dropdown are two buttons: a green play icon run the current run configuration and a green bug icon to debug the current run configuration.
Running Tests
Open the LinkedIntListTest.java class from the Project tool window. This class consists of many unit tests, each of which tests a small unit of your program’s behavior. Run the unit tests by following the same procedure as we did for running code: right-click the LinkedIntListTest file in the Project tool window and tap Run ‘LinkedIntListTest’. This will run all of the tests for LinkedIntList. Since we haven’t finished the homework, most of the tests won’t pass.
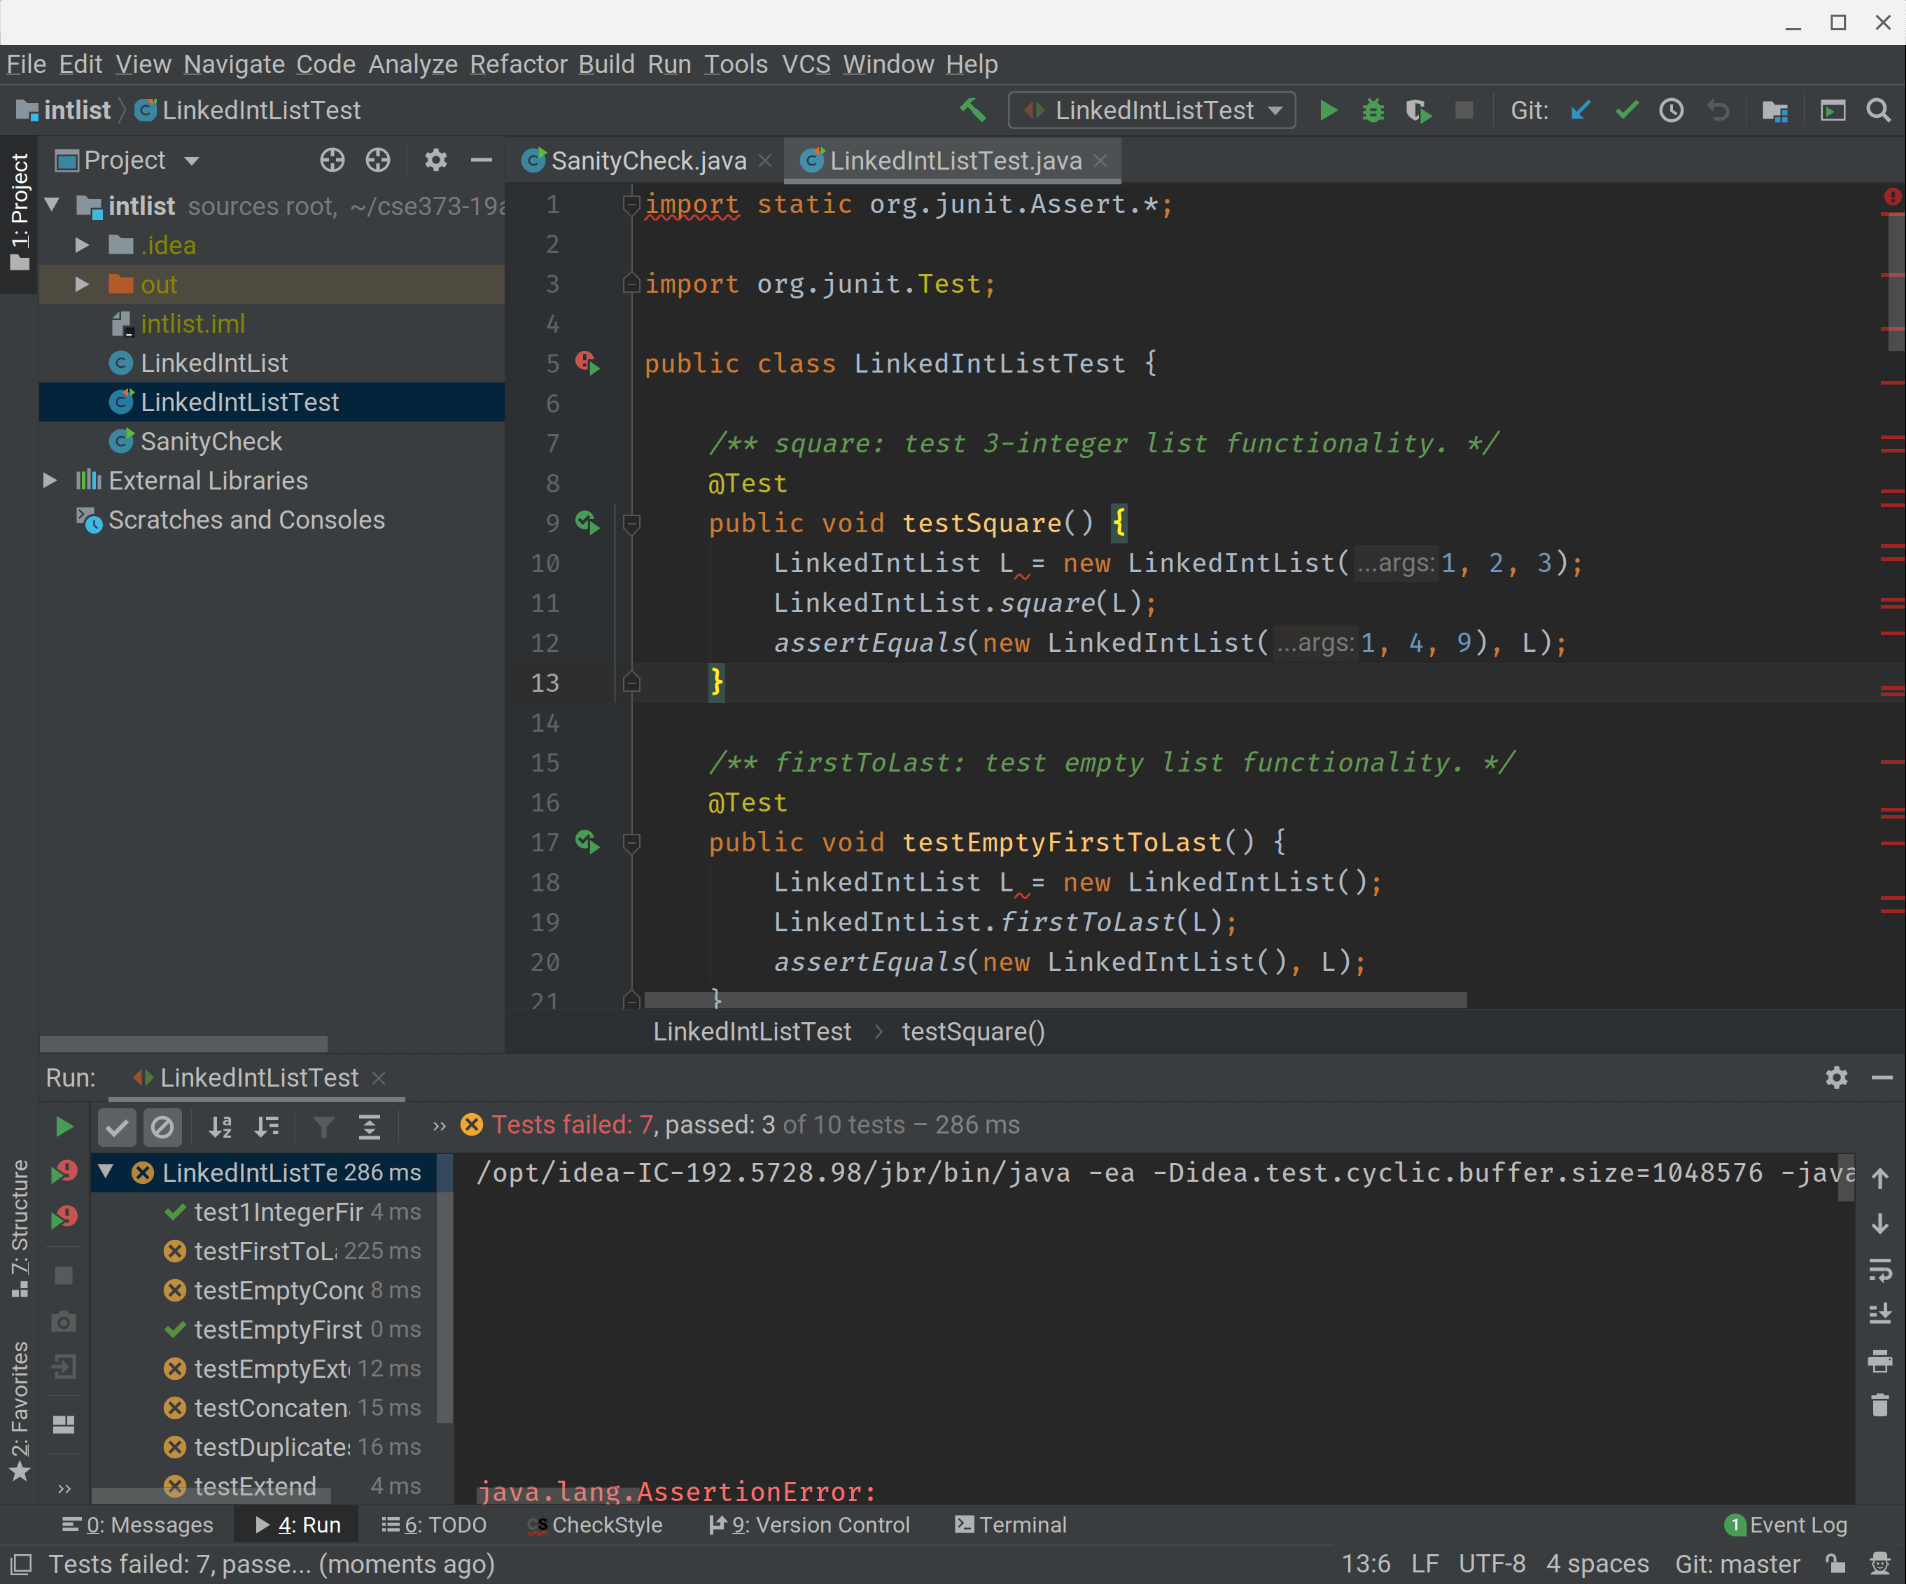
Did you notice that LinkedIntListTest does not have a main method, and yet IntelliJ was still able to run the tests? Because unit testing is so popular, the developers of IntelliJ added a feature to automatically detect test files and treat them differently. Notice that LinkedIntListTest has a red-green diamond next to the file in the Project tool window, designating that IntelliJ recognizes the class as a collection of unit tests. This allows us to run individual tests. Try running only testSquare by tapping the green play icon next to the line number 11.

Debug Mode
IntelliJ includes a built-in debugger which we’ve enhanced by installing the Java Visualizer plugin. We can run the program in debug mode by tapping the green bug icon instead of the green play icon. Like jGRASP, the IntelliJ debugger runs your program exactly like it would when running it normally, but it allows you to pause execution on breakpoints. Let’s try this now with testSquare by placing a breakpoint inside of the LinkedIntList.square method and then running the program in debug mode.
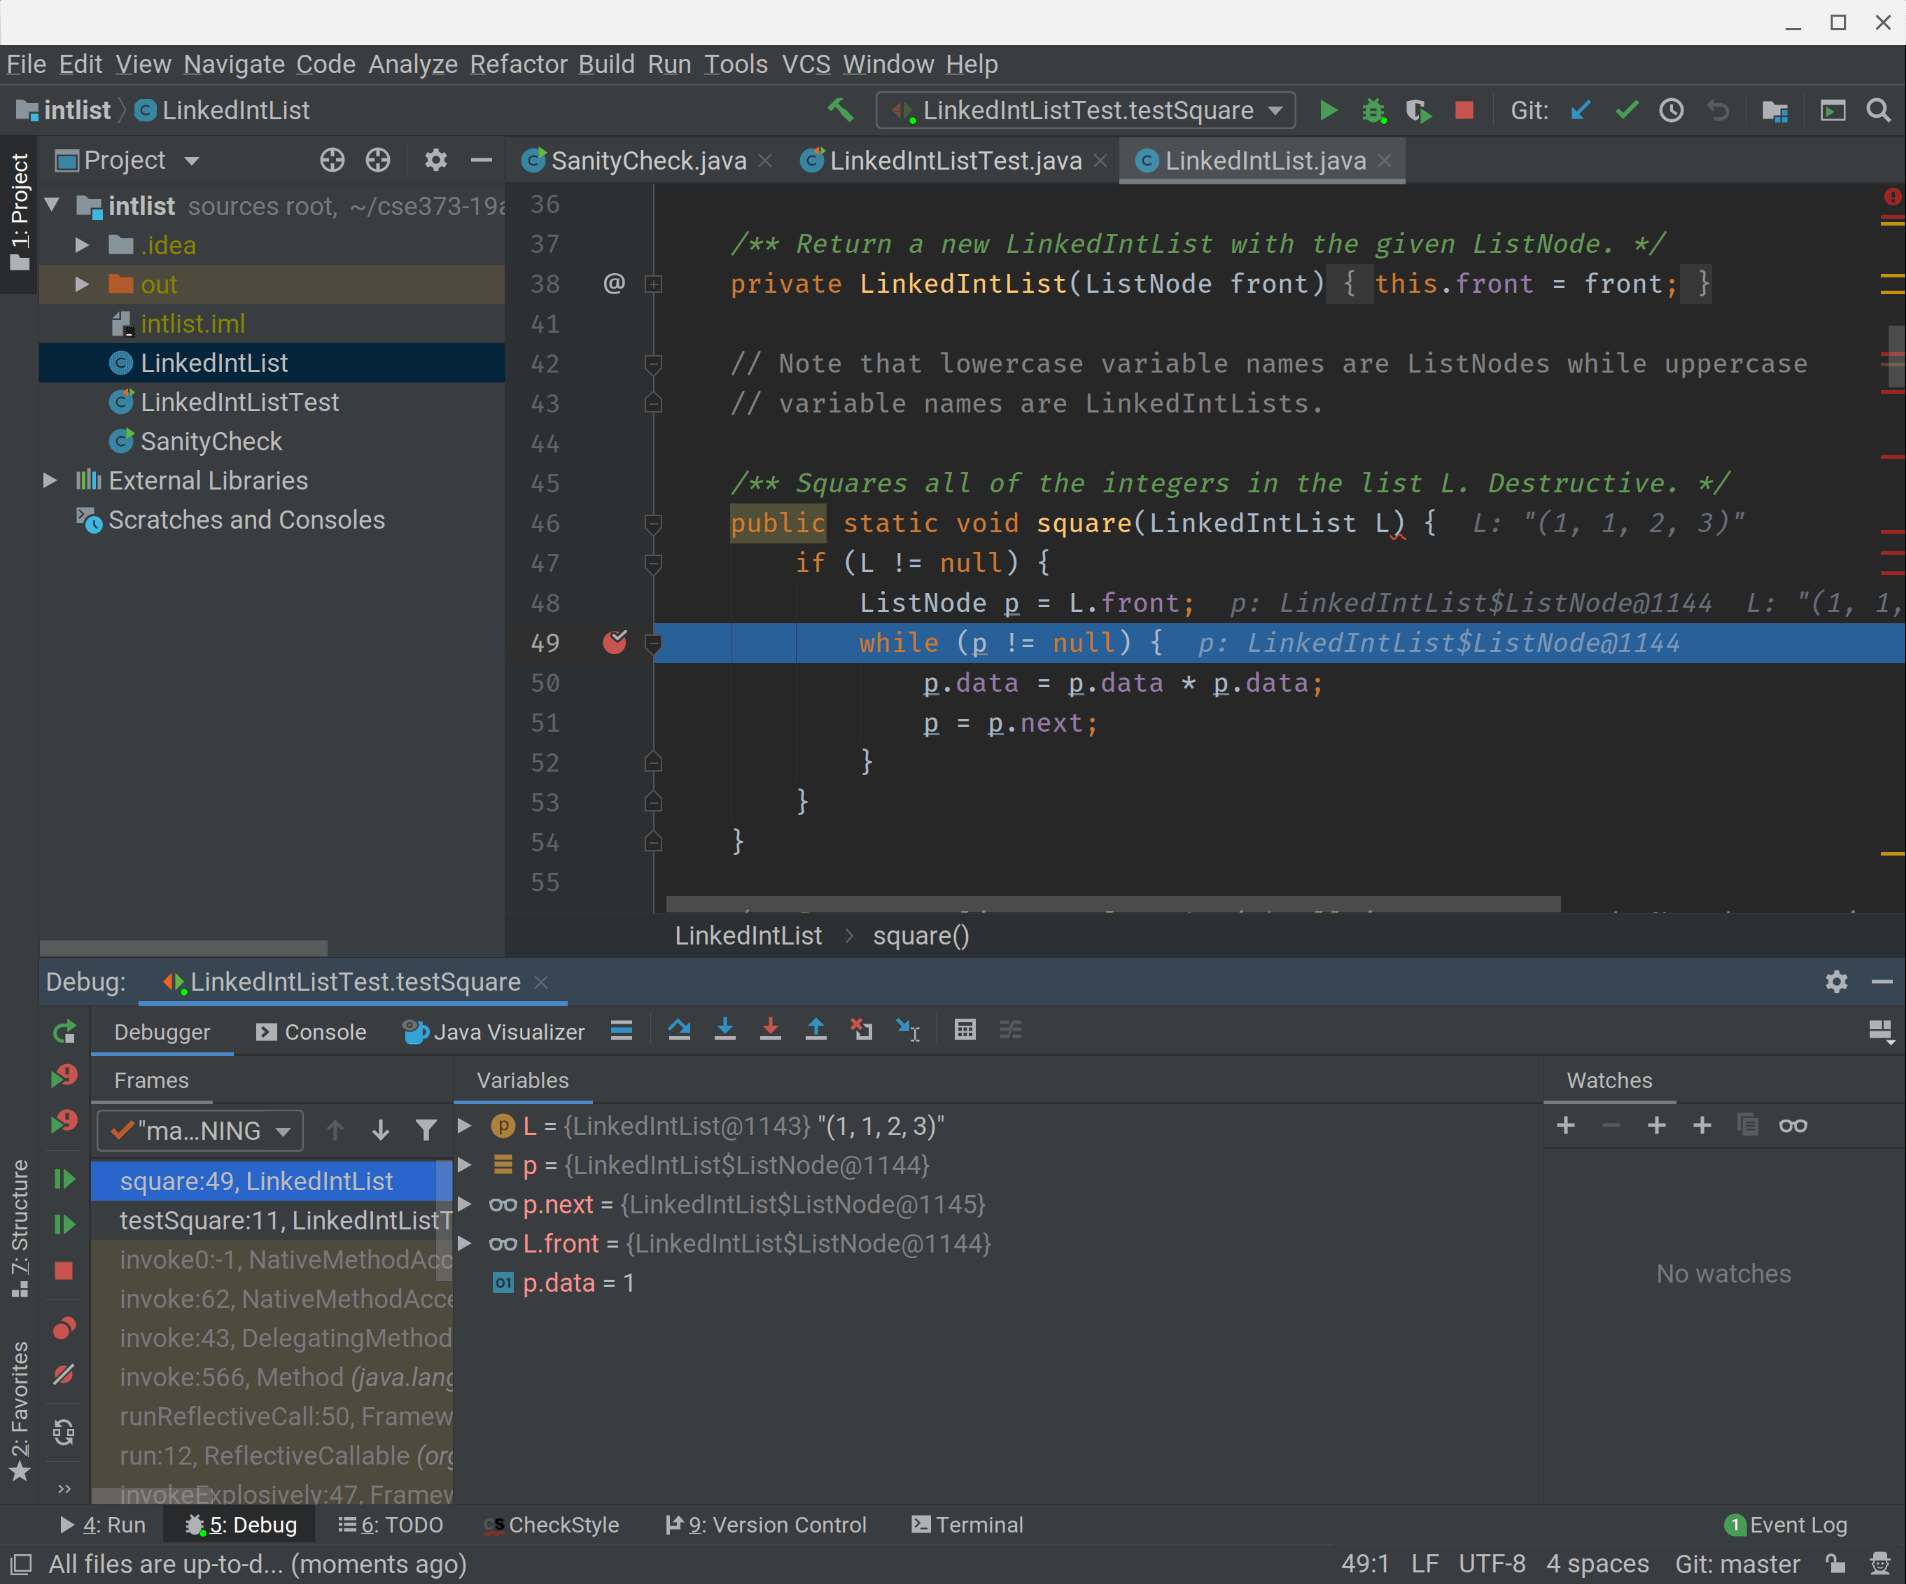
When the debugger stops at the specified breakpoint, the Run tool window will turn into the Debug tool window. Here, you can see the paused state of the program. At the top of the Debug tool window are small icons for controlling the debugger, including the two most common operations to Step over and Step into the next statement. This is similar to how the jGRASP debugger works.
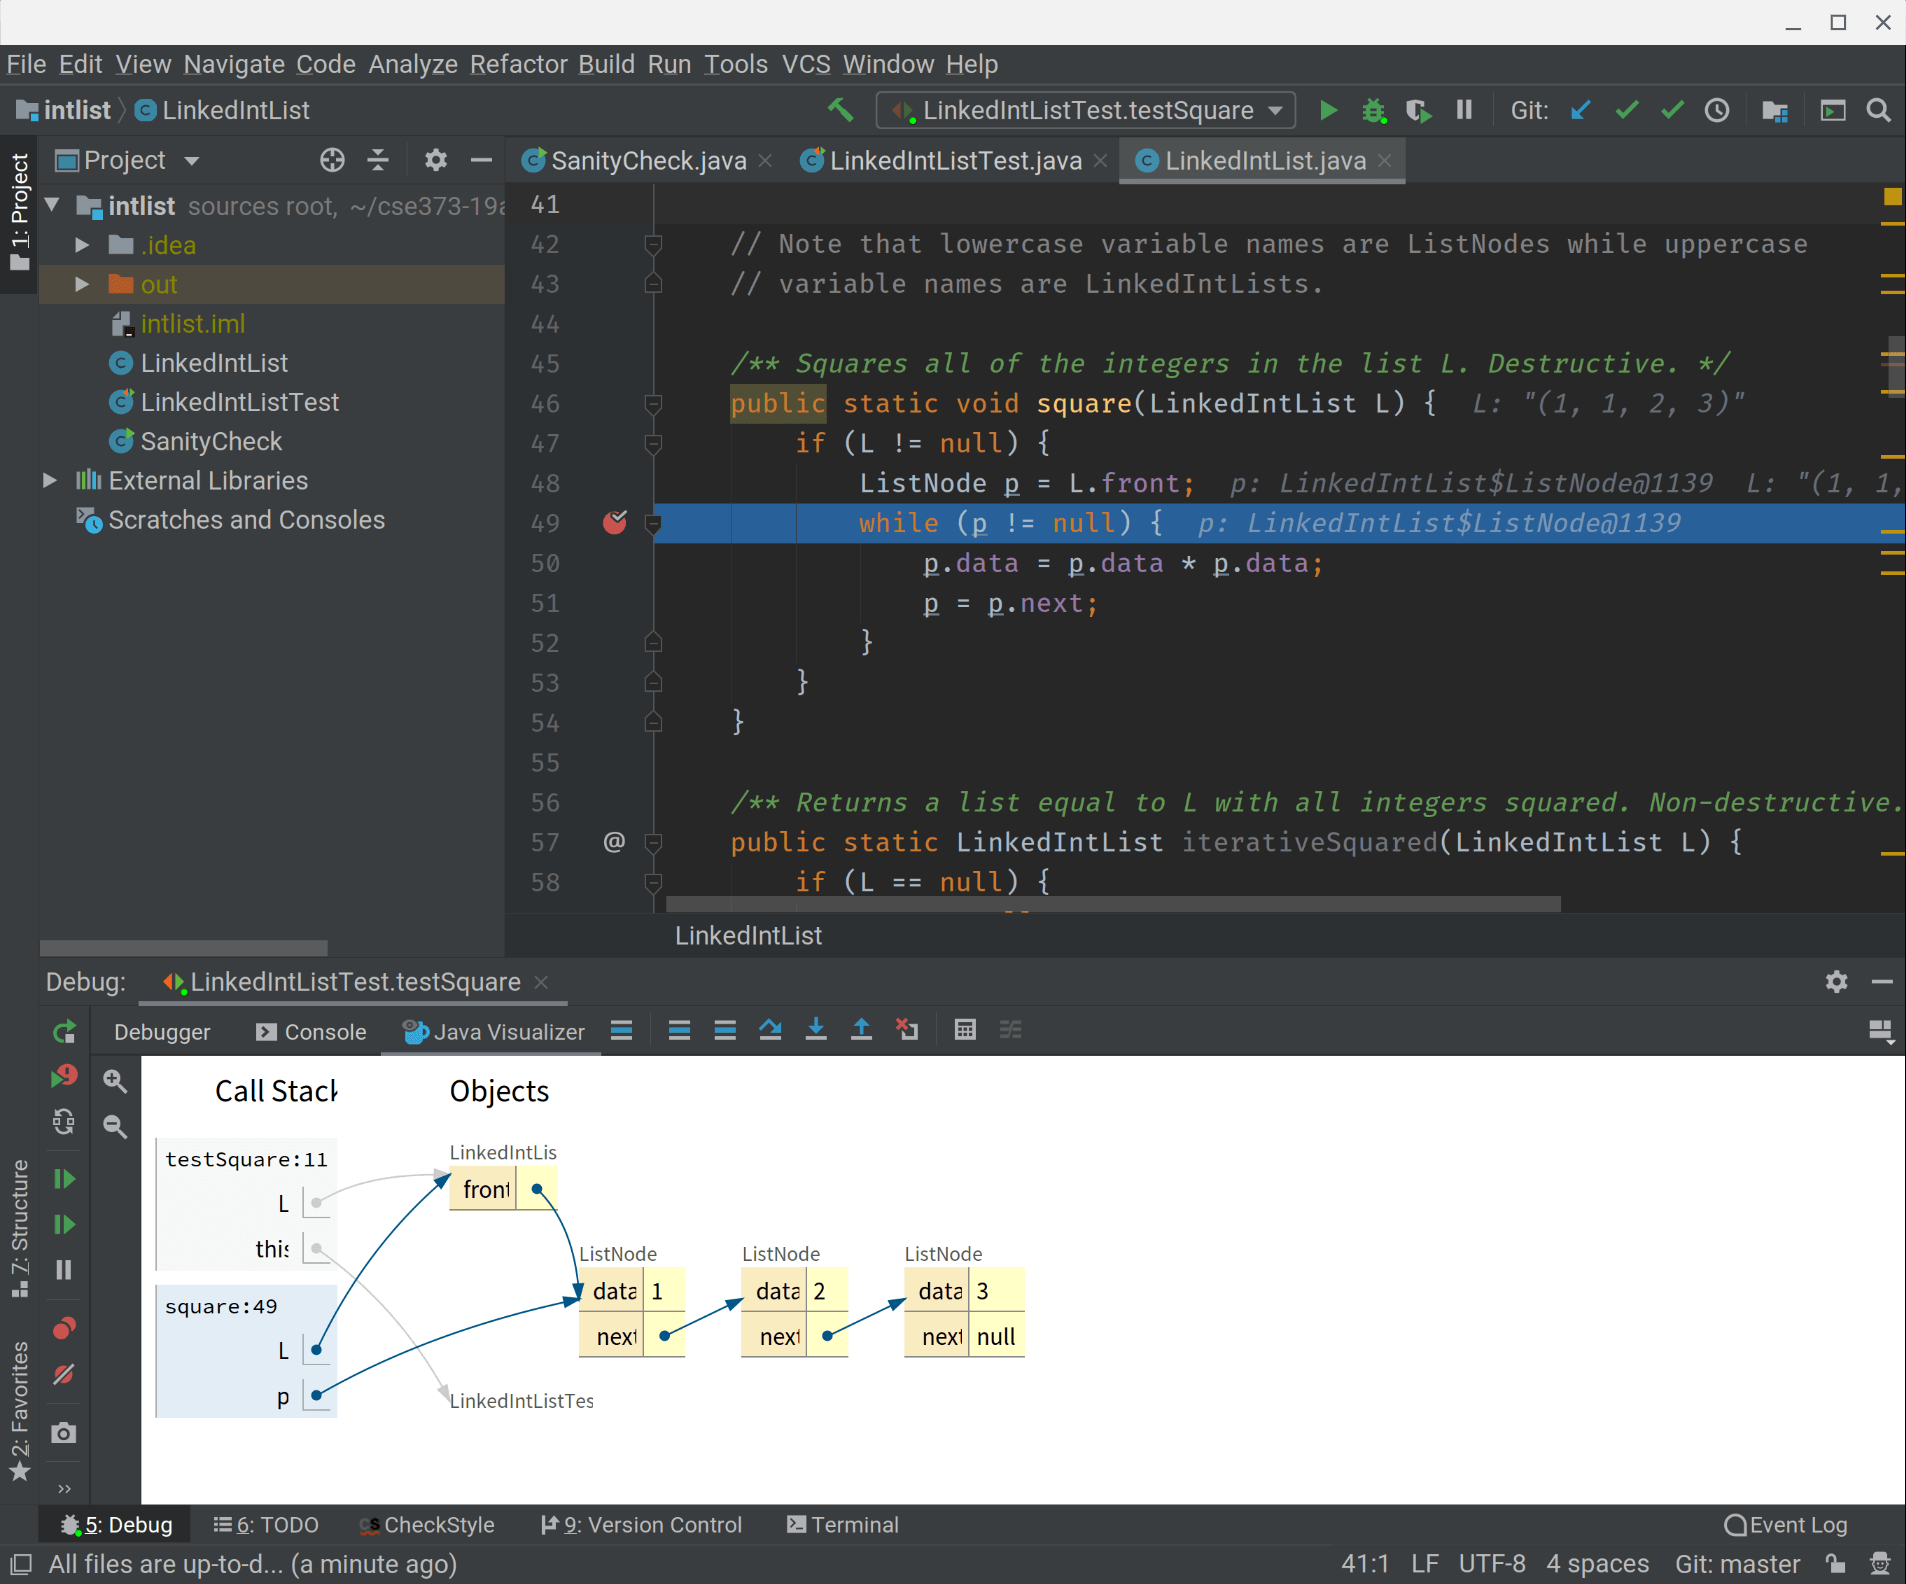
We can visualize the debugger output by tapping on the Java Visualizer button at the top of the Debug tool window. This will draw a box-and-pointer diagram representing the paused program state. Step through the execution of the program, or use the green continue icon on the left side of the Debug tool window.
We now have all the tools we need to work on LinkedIntList.