The content for this lesson is adapted from material by Hunter Schafer.
Objectives
In this lesson, let’s learn more about foundations for fairness, bias, and ethics, and learn about current research in evaluating models for fairness. We will be focusing on an example of using various factors to predict admission to college. Scarcity, elitism, and social stratification are not desirable in the long term, but this example helps shed some light on the subtleties around how different people with different cultural backgrounds might define fairness in different ways. Much of this lesson draws from The Ethical Algorithm (Michael Kearns and Aaron Roth). We’ll also examine how data science can go wrong in a series of case studies.
Defining Fairness
What does it mean for an algorithm to be fair? There’s no one universal definition for fairness. Each definition is useful in different situations and reflect different social perspectives.
Group fairness is a definition of fairness that aims to avoid discrimination against subgroups. Subgroups can refer to characteristics such as race, sex, or ability but also concepts like religion, political identity, other government-protected classes, and the intersections of all these groups. A model should avoid discrimination based on membership in one of these protected groups to avoid unfair treatment.
Consider a world inhabited by people that belong to two subgroups: circles and squares. Circles make up a 2/3 majority of the population and squares a 1/3 minority of the population.
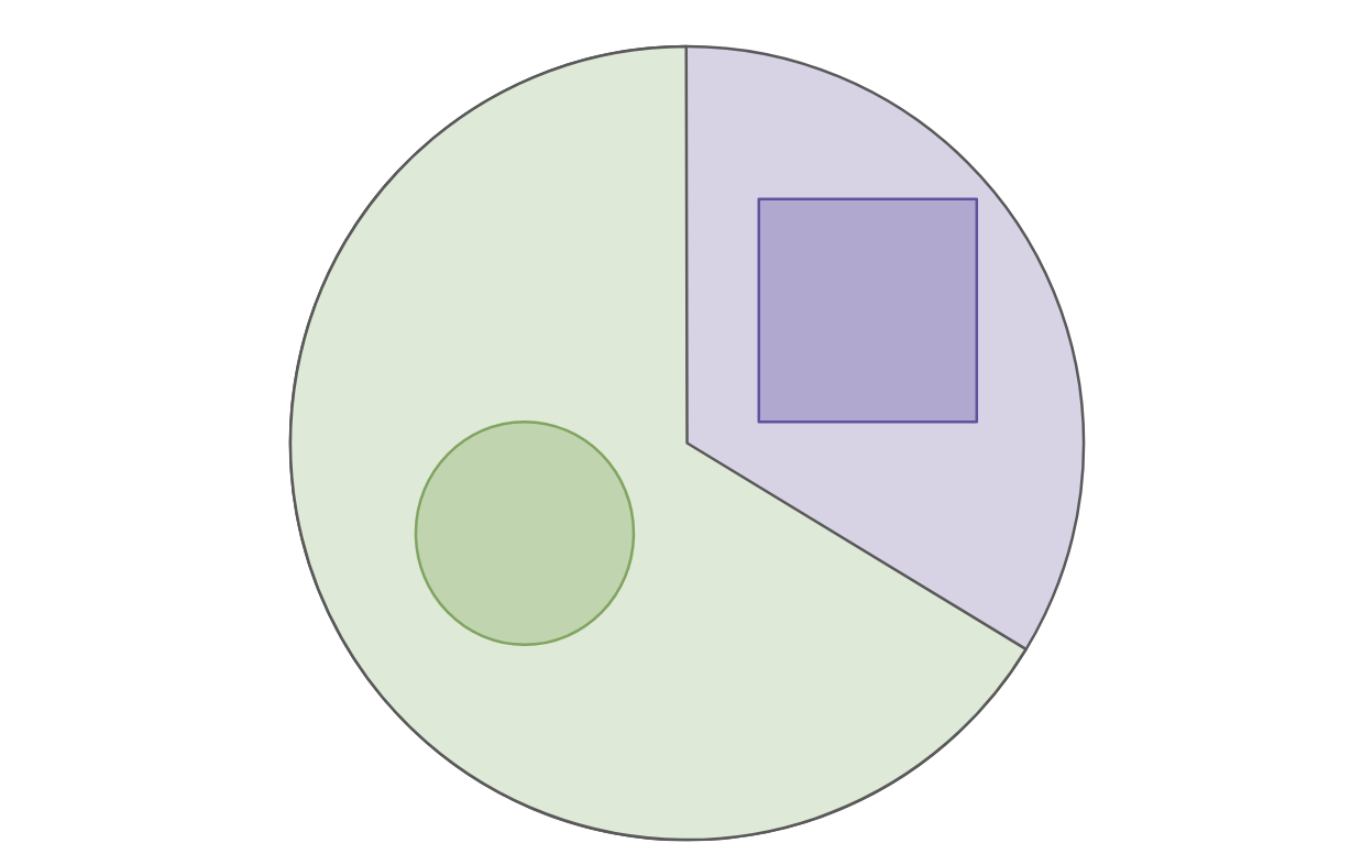
Let’s analyze a college admissions decision model that learns from historical admissions and student success data. This is clearly a very simplified abstraction of the world in order to show how things can go wrong in even simple cases. We can work with the simplified model for introducing concepts as long as we understand what has been abstracted away.
In real life, there are many more ways for things to go wrong. For example, student success as measured by course grades, graduation rates, or outcomes based on these factors will encode structural biases based on how course have been taught. Students with preparatory privilege will do better in courses that were designed with them in mind. Even the notion of student success may not be a desirable metric since it might optimize for the university’s bottom line rather than the students’ interest or the public’s interest.
Keeping in mind this already-unfair setup, let’s say the goal of the admissions process is to select students who will be successful based on past student success data in order to enroll future students who will also be successful. We have past applicant data and their student success records to train on. We’d like to predict for each student applying for the next incoming class whether to admit or deny using only their application data.
Let’s say we want to prevent discrimination against either circles or squares. One approach that we saw last time was to ignore the characteristic entirely or what we might call a “shape-blind” model. The idea is often thought that “it is impossible to discriminate if the model doesn’t even consider the characteristics.”
However, it’s still possible for models to infer certain characteristics based on subtle patterns from other features. It’s similar to how advertising might take in some search inputs and infer things about you based on those searches. By searching for a baby crib online, for example, a web advertising model might infer you’re likely to be expecting a child and target related advertisements for baby clothing and formula!
Shape-blind and other characteristic-blind approaches do not guarantee fairness since characteristics can be inferred from the other data. Instead, a common practice for defining fairness is on the outputs or decisions.
Statistical Parity
Statistical parity is a definition of group fairness that checks for equity in the predictions for each subgroup (and intersections of subgroups). For our running example of circle/square college admissions, statistical parity would check that the fraction of all squares admitted to college matches the fraction of all circles admitted to college. If we admit 30% of circles into our college, to meet statistical parity, we would expect to admit 30% of squares too.
But ensuring statistical parity introduces an ethical dilemma. Circles might be more likely to succeed compared to squares due to structural factors such as preparatory privilege, teaching methods, and grading methods. These differences in subgroup outcomes make it so that statistical parity can reduce accuracy on the dataset. In order to achieve statistical parity in this situation, we would deny admissions to circles at the cost of reducing overall model accuracy but understanding that the historical data does not reflect future outcomes.
If we believe that everyone can succeed given the time and support—recognizing the ways that the existing data reflect biases in higher education—random sampling might be the fairest option for college admissions. Some programs use a lottery for selecting students because they recognize that admissions is less about comparing students to identify some idealized “best students” and instead more of an issue of scarcity. In this situation, we might recommend against any kind of model and instead pursue public policy change. Not all problems need to be solved by applying technical solutions.
Equal Opportunity
Statistical parity does not take into account subgroup outcomes, only subgroup decisions. In contrast, equal opportunity is a definition of group fairness that checks for equity in the false-negative rates for each subgroup (and intersection of subgroups). The goal of equal opportunity is to ensure no subgroup is unfairly rejected with respect to the historical data.
A false negative refers to a single occurrence where the model predicted a negative result for a data point labeled positive. For our running example of circle/square college admissions, a false negative occurs when a student in the historical data was labeled admit but predicted as deny. The false-negative rate is the fraction of examples predicted negative but assigned a positive true label. If our dataset consisted of 5 true admits (ignoring all historical denials) and our model predicted 2 out of the 5 as deny, the false-negative rate is 0.4.
Both statistical parity and equal opportunity are definitions of group fairness. They help spot potential discrimination between subgroups but say nothing about fairness when it comes to discussing individuals within those groups, which we’ll discuss later.
Predictive Equality
Lastly, predictive equality is a definition of group fairness that checks for equity in the false-positive rates for each subgroup (and intersection of subgroups). A false positive refers to a single occurrence where the model predicted a positive result for a data point labeled negative. In our college admissions example, a false positive occurs when the model predicts admit for a student for which the historical data labels deny.
Food for thought: When might you use predictive equality rather than equal opportunity? Consider what false positives and false negatives mean in different contexts.
Fairness vs Accuracy
In our discussion of statistical parity, we alluded to a trade-off between an accurate model and a fair model. In order to achieve statistical parity, or group fairness, we might need to intentionally make errors in order to correct for structural biases present in the historical data.
Suppose we want to compare a holistic admissions process to one that is determined entirely by students’ standardized test scores. If the historical data from holistic admissions represent the true labels, let’s analyze the fairness of a simplified admissions classifier that only uses standardized test scores. The goal of this analysis is to consider whether using only standardized test scores for admissions is fair across subgroups compared to the ideal holistic admissions. (As we mentioned previously, holistic admissions may not be fair either!)
Each student is positioned on a numberline according to standardized test score (“SAT Score”), labeled + or - for the holistic admissions decision, and their belonging to either Circle (C) or Square [S] subgroups.
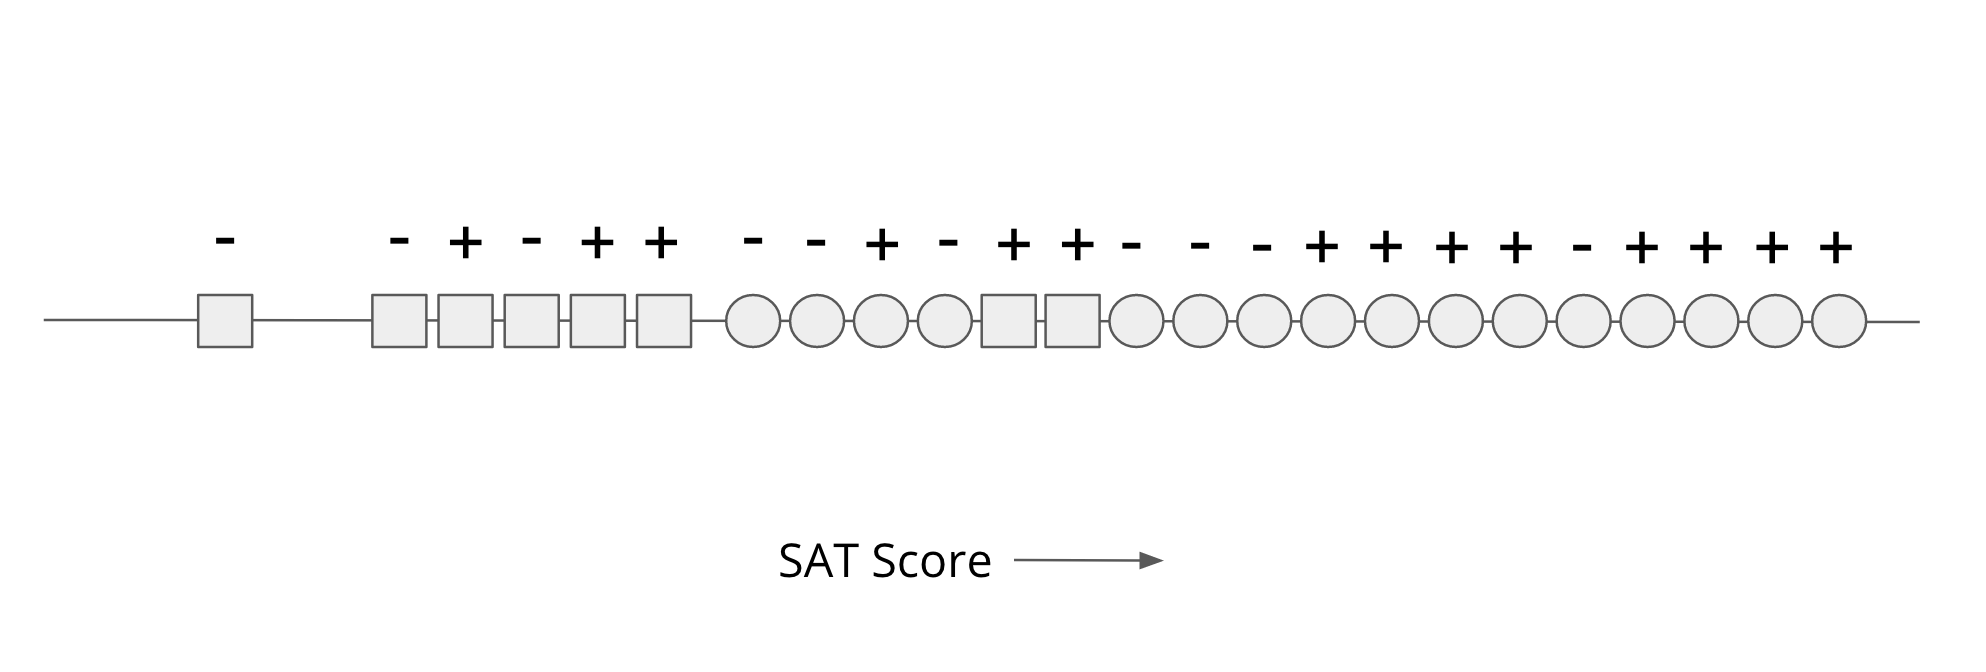
Note that a 2/3 majority of applicants are circles and 1/3 minority of applicants are squares as in our example before. Even though the number of applicants per subgroup are different, the holistic admissions data seems to have achieved some statistical parity: 9/16 circles were admitted compared to 5/8 squares. In this dataset, circles tend to have higher SAT scores than squares. (As in real life, SAT scores are biased toward certain kinds of knowledge and ways of demonstrating that knowledge.)
Our simplified admissions model is shape-blind: it only takes the SAT score as input and outputs an admit decision if the student is above a certain threshold. To maximize the accuracy of this model (reduce the number of incorrect admissions decisions), we can set the threshold value as shown below and get 17/24 correct predictions: 8 correct + positive predictions and 9 correct - negative predictions.
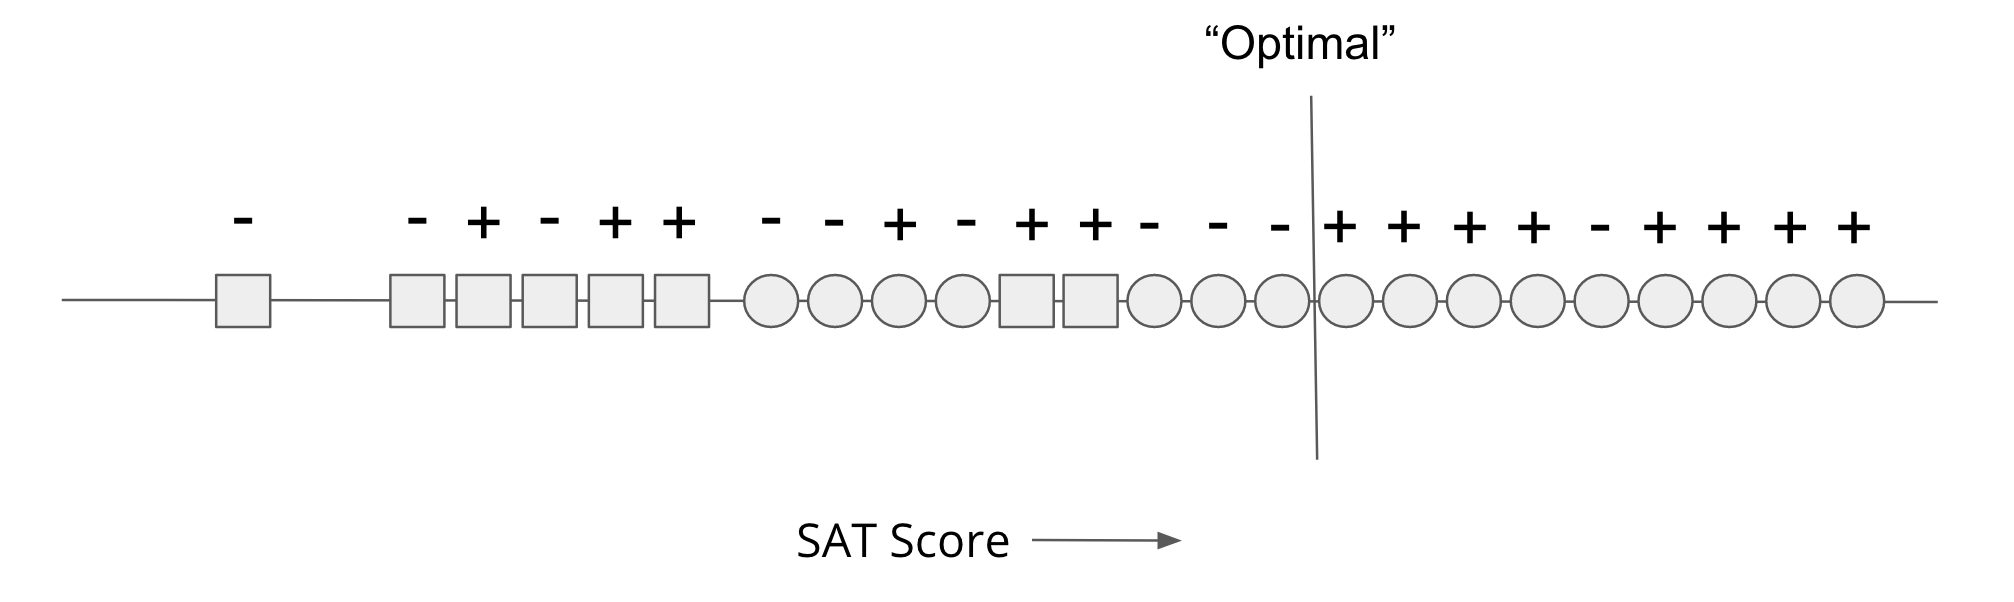
This “optimal” threshold is the most accurate model in terms of predictions and true labels. But if you consider our group fairness definitions, this model seems blatantly unfair. For example, this model does poorly on equal opportunity (equity of false-negative rates).
Out of 9 successful circles, the model denied 1 of them for a false negative rate of 1/9 (11%).
Out of 5 successful squares, the model denied all 5 of them for a false negative rate of 1 (100%).
According to equal opportunity, this model is unfair to squares since it falsely rejected successful squares at a much higher rate than the holistic admissions process that we’re using as a baseline.
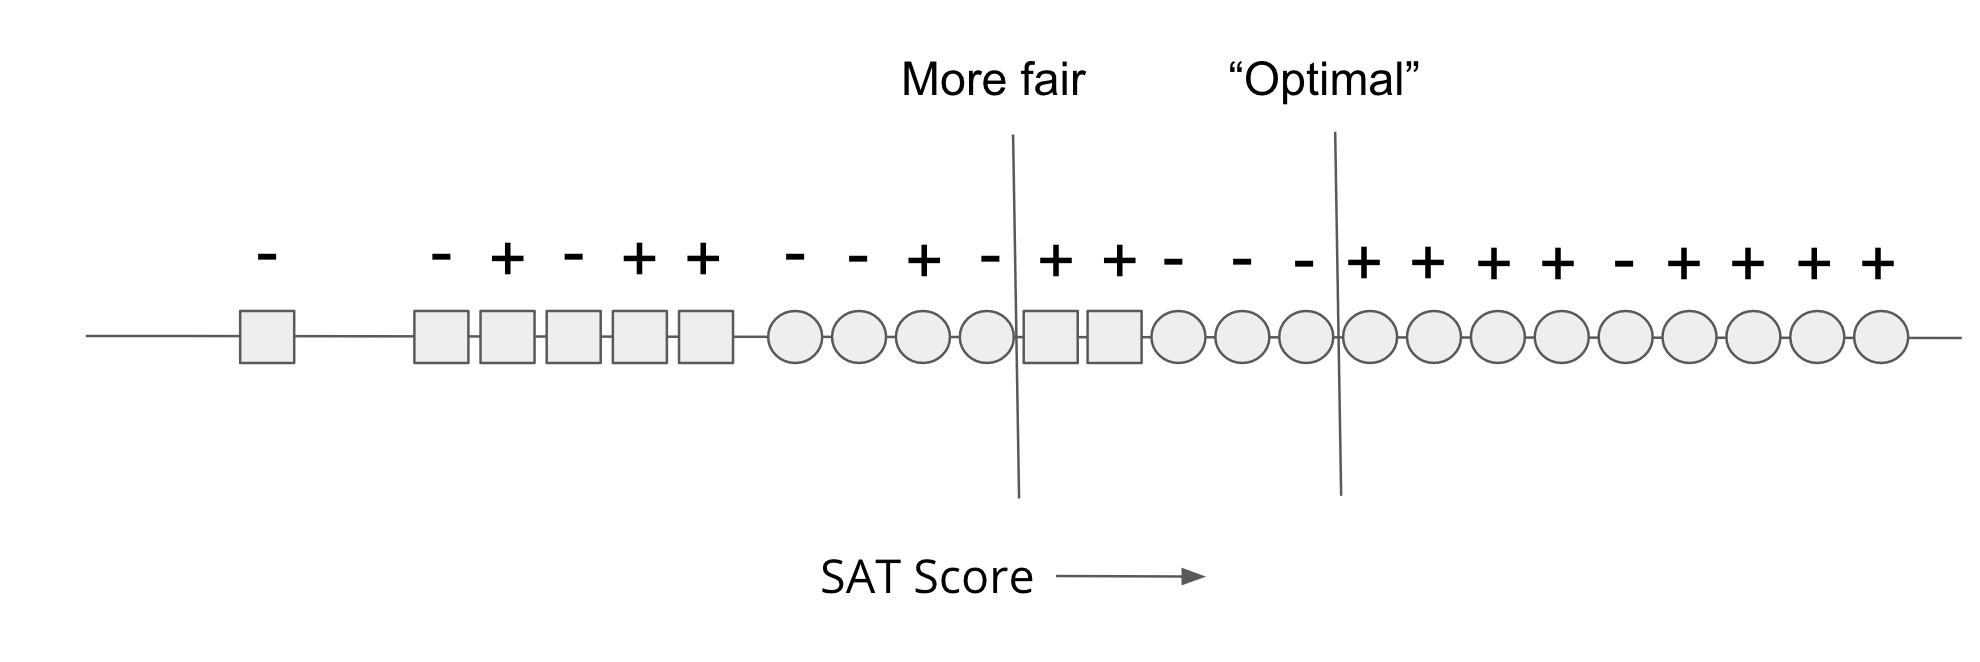
A “more fair” model might move the SAT score threshold down, reducing the overall accuracy by accepting more undeserving (according to holistic admissions) circles but also finally accepting some squares.
Out of 9 successful circles, the model denied 1 of them for a false negative rate of 1/9.
Out of 5 successful squares, the model denied 3 of them for a false negative rate of 3/5.
The more fair model is less accurate but improves on the metric of equal opportunity.
The tension between fairness and accuracy arises from the fact that our definition of accuracy is tied to the data, which are often biased in terms of group fairness especially when the subgroup sizes are not the same. Optimizing models for accuracy will tend toward models that are more accurate for circles rather than squares because circles are overrepresented in the data.
Is there any way that we can design models that do better in both accuracy and equal opportunity? One issue is that SAT scores are themselves biased. We might try to correct this by defining one threshold for circles and another threshold for squares. This explicitly encodes shape into our model so that it can be used to determine which threshold to apply. But in the real world, such as in Washington state, there is legislation preventing the use of such models: “the state shall not discriminate against, or grant preferential treatment to any individual or group on the basis of race, sex, color, ethnicity, or national origin” (Initiative 200). These laws are important to prevent explicit discrimination but they can also prevent efforts to correct for implicit discrimination through the data used in models. Without the ability to treat subgroups separately, we will run into this trade-off between fairness and accuracy as long as there exist differences between subgroups in the historical data.
Food for thought: Which threshold do you agree with? What are the consequences of choosing either threshold?
Pareto Frontier
We know that models often trade-off between accuracy and (un)fairness. How do we know which model could be best for our particular problem? You could imagine looking at every possible threshold, each one operating at a different trade-off between accuracy and fairness. Picking the exact model you want ends up as an ethical dilemma. Setting aside the ethical dilemma of choosing a specific model for a moment, are some models quantitatively better than others?
The plot below visualizes trade-offs between accuracy and fairness across every possible model. The x-axis of the graph is error (1 - accuracy) while the y-axis is a measure of unfairness (higher values are less fair using some definition of group fairness). Each point in the graph represents a fully-trained model with a particular threshold (not shown). The position of each point indicates its error and unfairness compared to other models. In short, this plot shows the space of every possible model, their accuracy, and their fairness.
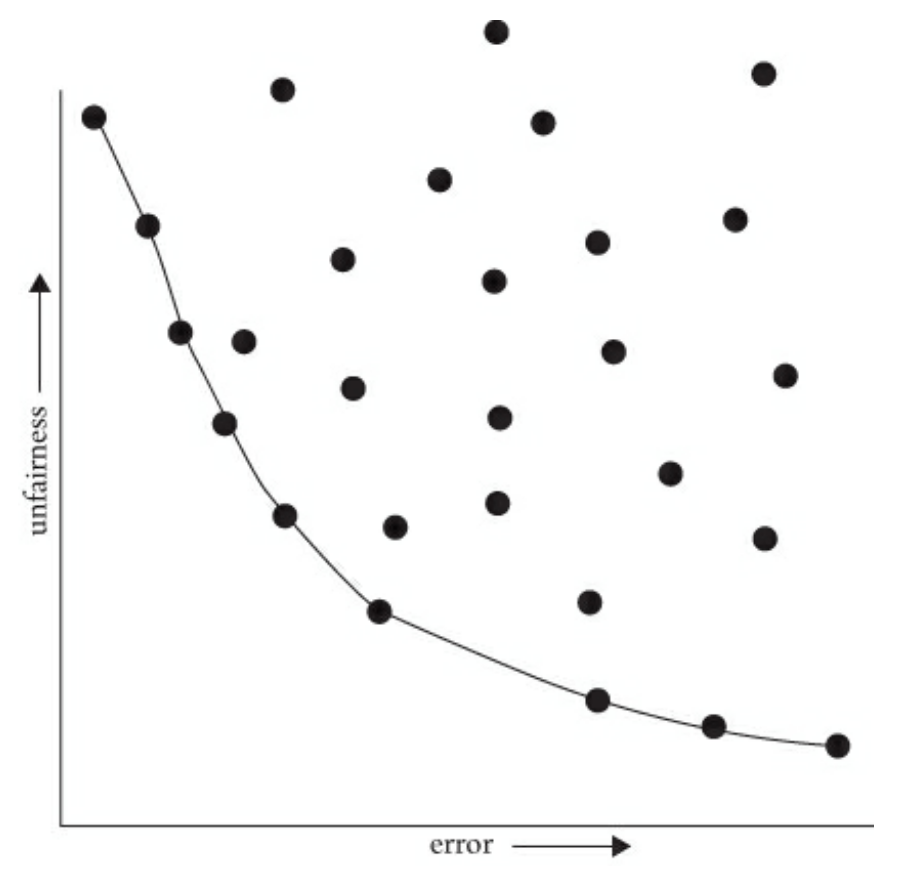
Although, in general, there is a trade-off between accuracy and fairness, some models are clearly worse in both.
The models in the top-right quadrant exhibit both high error and high unfairness.
The models in the bottom-right quadrant exhibit high error but low unfairness.
The models in the top-left quadrant exhibit low error but high unfairness.
The models in the bottom-left quadrant exhibit low error and low unfairness.
The Pareto frontier refers to the models that are optimal according to some combination of trade-offs, in this case error and unfairness. In the plot, the curve connects the points for all the models on the Pareto frontier. All points off this curve can be improved in either fairness, accuracy, or both without any loss in the other dimensions. Informally, we can say that the “best” models lie on the Pareto frontier.
The Pareto frontier does not indicate which trade-off you should choose along its curve. It just represents the set of “best” choices. The relative importance of fairness and accuracy depends on the context you are working in and it cannot make that judgment for you. In some sense, it’s just a more quantitative way of reasoning about the trade-offs, but humans are still responsible for resolving the ethical dilemma themselves.
It might feel weird to define a quantitative measure for this trade-off between fairness and accuracy. It might not feel right to treat fairness like a number along a curve that we just hand-pick! Aaron Roth and Michael Kearns describe this uncomfortable experience quite well, so let’s hear what they have to say:
While the idea of considering cold, quantitative trade-offs between accuracy and fairness might make you uncomfortable, the point is that there is simply no escaping the Pareto frontier. Machine learning engineers and policymakers alike can be ignorant of it or refuse to look at it. But once we pick a decision-making model (which might in fact be a human decision-maker), there are only two possibilities. Either that model is not on the Pareto frontier, in which case it’s a “bad” model (since it could be improved in at least one measure without harm in the other), or it is on the frontier, in which case it implicitly commits to a numerical weighting of the relative importance of error and unfairness. Thinking about fairness in less quantitative ways does nothing to change these realities—it only obscures them.
Making the trade-off between accuracy and fairness quantitative does not remove the importance of human judgment, policy, and ethics—it simply focuses them where they are most crucial and useful, which is in deciding exactly which model on the Pareto frontier is best (in addition to choosing the notion of fairness in the first place, and which group or groups merit protection under it, both of which we discuss shortly). Such decisions should be informed by many factors that cannot be made quantitative, including what the societal goal of protecting a particular group is and what is at stake. Most of us would agree that while both racial bias in the ads users are shown online and racial bias in lending decisions are undesirable, the potential harms to individuals in the latter far exceed those in the former. So in choosing a point on the Pareto frontier for a lending algorithm, we might prefer to err strongly on the side of fairness—for example, insisting that the false rejection rate across different racial groups be very nearly equal, even at the cost of reducing bank profits. We’ll make more mistakes this way—both false rejections of creditworthy applicants and loans granted to parties who will default—but those mistakes will not be disproportionately concentrated in any one racial group.
Ultimately, this reminds us of the fact that these problems in our models cannot be solved algorithmically. While we’ve tried to formalize some mathematical description for group fairness, which one you use is a statement of values and a decidedly a social question. Far too often, technologists reach towards algorithmic or technical solutions to problems, but it’s very crucial that humans (both the modeler, the modelled, and others) stay in the loop enforcing what shared values we want to encode and automate through our programming.
Food for thought: What are your takeaways from Kearns and Roth?
Case Studies - Fairness
Add your discussion responses here: https://
COMPAS
In this case study, let’s read Larson et al.'s 2016 article, “How We Analyzed the COMPAS Recidivism Algorithm.” Here is some more context.
Several years ago, a company named Northpointe made a machine learning system to help judges decide how to rule on parole. The name of this system was the Correctional Offender Management Profiling for Alternative Sanctions (COMPAS). The idea of the model was to try to predict how likely it would be for someone leaving jail to recommit a crime. Committing a crime after serving time in prison is called recidivism. Their model was trying to predict someone’s risk of recidivating after they leave jail from the answers to a quiz they filled out. The questionnaire asked questions about their identity, where they lived, what their job was, etc.
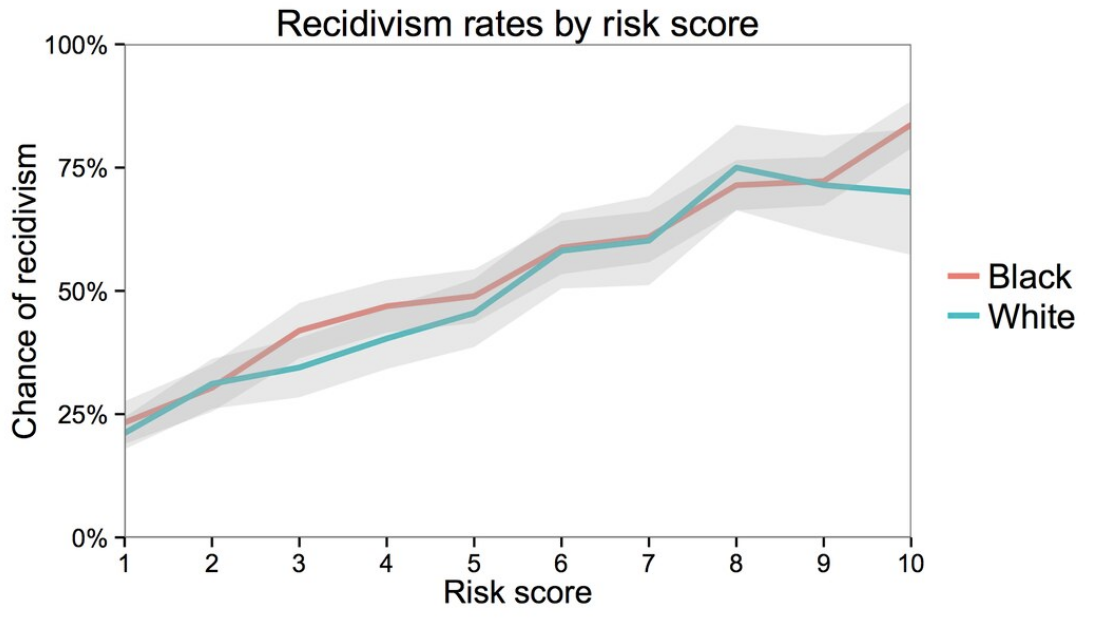
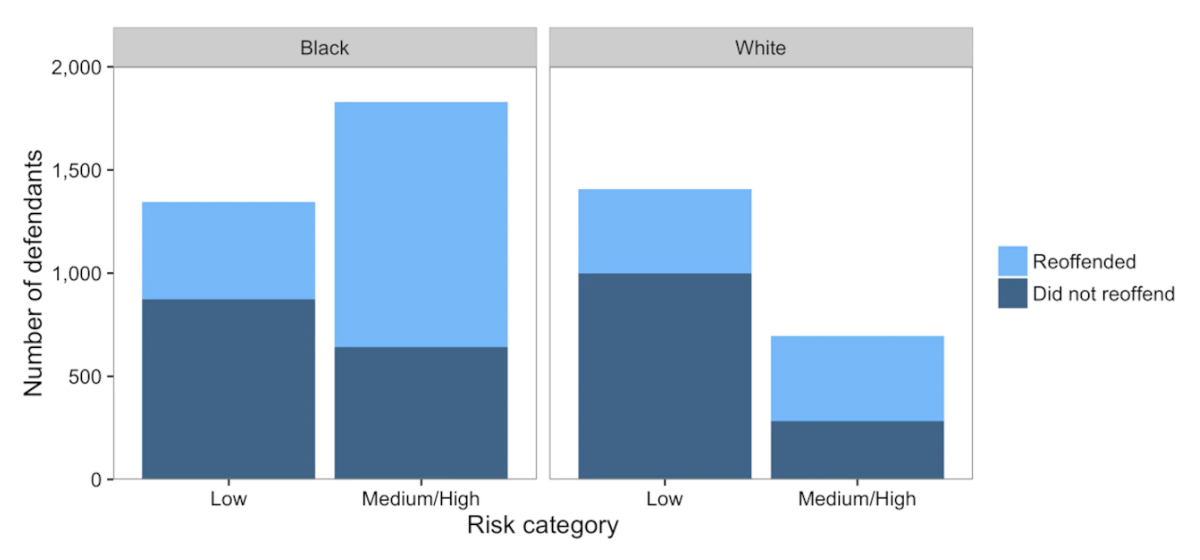
ProPublica (a non-profit newsroom) analyzed the results of COMPAS scores and concluded that the system was biased against people of color. In particular, they found that the system was more likely to predict a higher recidivism risk for black people than white people. Northpointe countered ProPublica’s findings by claiming that their scores were accurate in the sense that if they predicted a score of 9 for anyone (regardless of race), there was a 90% chance they would recidivate.
So the question then is: Which one of these groups is right, and is it ethical to use this system to determine who gets parole? Surprisingly, it turns out that both ProPublica and Northpointe’s arguments are backed up by the data.
Northpointe’s argument is backed up by the following graph. The x-axis shows the predicted risk score (scaled from 1-10, where a higher is more likely to recidivate). The y-axis shows the actual recidivism rate for those people after they did leave jail. The fact that these lines are close to the line demonstrates Northpointe’s point. So of the people that they predict a risk score of 0.8, about 80% of the time they recidivate. Additionally, when separated as accuracies for black and white people, you see that the lines are mostly the same (the gray region is a confidence interval to capture uncertainty in the estimate).
ProPublica’s point is backed up by the following chart. This chart separates the data into black/white people and then within those groups breaks the people up into low and medium/high risk and shows the count of each group. The risk group comes from whether or not COMPAS predicted a small, medium, or high score. The coloring shows which of the people in each group did re-offend and those that didn’t. ProPublica claims that the percentage of people shaded dark blue (those that ultimately did not re-offend) in each race, a more substantial proportion of black people get labeled as medium/high risk. The conclusion from this claim is that if you would genuinely not recidivate, the system is more likely to give you a higher risk if you’re black. They use this as justification to say this model exhibits racist behavior and that judges shouldn’t use it.
The first thing to ask is, where does this bias come from? Surprisingly, it turns out that race isn’t even a question that Northpoint asked on the questionnaire. This means that the model doesn’t even have race as an input. This doesn’t stop the model though, because it’s able to do many correlations to “discover” someone’s race using other features (like their home address, income level, name, etc.). These features can be correlated with race, so the model is not truly “color-blind.”
In many cases, models that show biased behavior tend to not do so intentionally on the part of the programmer. Unfortunately, the data we give these models is biased because our society has biases around every corner. Regardless of using a machine learning model or not, your treatment by the criminal justice system is, unfortunately, impacted by your race. If we use data from this biased system, the data itself will obviously be biased. The model can then pick up on these biases and reflects them in their decisions. Just as a simple example, the relative incarceration rate for people of color is much higher than white people. The model picks up on this correlation and then uses it for future judgments, without taking into account the historical or societal causes for that difference.
Food for thought:
One idea to counter-act systemic racism into models like COMPAS is to explicitly code race into the model, and then make some mechanism to force the model to be fair concerning race. However, in many places, this is illegal to do in the first place! How would you respond to this idea?
Consider the false positives and false negatives in this scenario. What are the risks associated with each, and what would you use to guide your idea of fairness in this case study?
Loomis v. Wisconsin was a 2017 court case that challenged the state of Wisconsin’s use of COMPAS to sentence a man named Eric Loomis to six years in prison. Read this statement from the Harvard Law Review and reflect on the judges’ decision. Why did the court accept the result from COMPAS? What are the criticisms made of this decision?
Predicting Criminality
For this case study, we’ll read Bergstrom and West’s 2017 article “Criminal machine learning”. Here are the takeaways:
Physiognomy is the idea that a person’s character or tendencies can be read or determined from their physical appearances, particularly around the head and face. (This is deeply intertwined with the broader concept of scientific racism, which is a historical pattern of using “empirical” data to justify racial discrimination and hierarchies.) The paper that Bergstrom and West are criticizing attempts to revive the idea that there is any theory of “criminal” facial features at all, and further that the distinguishing algorithm is free from human bias because it is automated.
A machine learning algorithm is only as reliable as the data it is trained on. If the training data contains systematic differences unrelated to what the algorithm is supposed to detect, the algorithm will learn those differences instead. Further, Wu and Zhang confounded facial features like bone structure and proportions with facial expressions, which are temporary muscular configurations. Using convictions as a proxy for criminality also introducecs another layer of bias. Setting aside that convictions do not have a one-to-one mapping with whether a person committed a crime, facial features may correlate with jury decisions to convict over actually committing crimes.
Data scientists use models to not only make predictions but also to justify some phenomena (e.g., an interpretable machine learning model). While this is a useful endeavor, it can have some downfalls. This is why it’s so important to explore alternative hypotheses (maybe simpler ones) that are also likely to explain the phenomena. It would be best if you took the time to reflect on your explanation to check for any implicit biases present (e.g., confirmation bias). While it’s hard to spot implicit biases, taking time to critically reflect can help catch them.
It’s incredibly important to start any data analysis project by asking who will use its results. Is it possible for someone to use this model to the detriment of others’ health, safety, or privacy? In the case of predicting criminality, there are some pretty scary possibilities of people in power abusing a tool like this to algorithmically enforce historic biases.
In general, it can be a bit tricky to navigate discussions of risk and value: It’s probably the case that you could argue that anyone can use any tool to cause harm, but that doesn’t mean we should never make new tools. It can help to think about the negatives in contrast to the value a tool adds to the world (e.g., think about the negatives of not using that tools). If there is an excellent argument for value-added, then the calculus on risk-reward will be more difficult to navigate. It’s tricky to navigate since different people have different views on injury and value, but having that discussion in the first place is a critical first step.
Food for thought:
How would you define the construct space, the observed space, and the decision space in this study?
The original paper that Wu and Zhang published can be found at this link. What stands out to you about their study? How does reading the Bergstrom and West critique of the paper first affect your perception of it?
Wu and Zhang published a response paper to the critiques of their original study. How would you summarize their response? What similarities or differences do you see in the points made in their response and the criticisms that Bergstrom and West wrote?
Case Studies - Ethics
Add your discussion responses here: https://
Why have we been asking you to reflect on case studies? Ethics in data and computing can sometimes feel abstract. Principles like algorithmic fairness and differential privacy are important, but they’re notoriously difficult to illustrate with simple, self-contained examples. It’s difficult to come up with smaller versions of systemic bias that leads to unfairness or loss of privacy, or other ethical concerns. Case studies are a great way to explore specific examples of broader topics. Some of these topics are necessarily more difficult to come up with structured examples in a course setting, but the (somewhat) good news is that there are plenty of real-life examples to show how these principles play out in practice.
Further, many of these case studies are not typical readings that we’ve had in previous lessons. In these case studies, you have read news articles, opinion pieces, technical blog posts, and peer-reviewed research. Learning to navigate that range is a skill you’ll use constantly as a data practitioner (and part of why we’ve had Reading Assignments in this course)! The world is full of data reporting and tech commentary, and being a critical reader of data-dense media matters. That’s why we’ve included Food for Thought questions throughout!
You’ll notice that all of our case studies are at least a few years old. That’s also intentional. More recent cases are still being actively debated or developed, which makes it harder to get a clear picture of the stakes, solutions, and who’s affected. Older cases have had time to accumulate secondary literature, independent analyses, and retrospective commentary, and there is value in engaging with these examples from a critical distance.
Potholes in Baltimore
The city of Baltimore has problems with potholes (holes in the street that are not fun to drive over). Part of the city’s responsibility is to fix these potholes to make roads safer. There has always been a system in place for people to report these potholes, but the process was slow. The city invested in building a smartphone app to automatically report potholes and reduce the time it takes to fix potholes. The idea was to use someone’s phone GPS and accelerometer to report the pothole’s location as someone drives over it. At this point, it seems like a relatively straightforward data science problem to take this incoming data and predict where the potholes are.
While this case study sounds less risky at first (maybe even like a useful application of data science), it demonstrates a very dangerous pitfall data scientists face. To benefit from this technology requires that people have a smartphone. That means areas where residents are less likely to have smartphones, are less likely to have these automatic reports sent in. This can be a real fear that these more impoverished communities will be left behind, as more resources are sent towards the more affluent neighborhoods with more reports, purely because there are more people with smartphones there.
In some sense, the city added a reporting bias to their system. A reporting bias exists when there is some reason the answers reported differ from the truth. An example of reporting bias is asking a married person, “Have you cheated on your spouse?” The answers people say are most likely biased towards “no” since there is a risk of reporting truthfully. Here, the reporting bias comes from differing levels of technological access.
When designing a data analysis, application, or model, you need to think carefully about how it impacts people of different races, genders, physical or mental abilities, socioeconomic status, etc. (and how it can affect intersecting identities). Thinking of diversity and inclusion is crucial for a data scientist since we want to make artifacts that benefit all people.
Facial Recognition
Read this article on the use of facial recognition in machine learning. (Or read the archived article if you don’t have access.)
The data we use to train our model affects the results of our model. This can lead to discriminatory practices. If our model underrepresents or overrepresents different groups that can lead to inequitable outcomes. However, with facial recognition and any other technology, we must ask ourselves, to what end are we designing this technology? Is it ethical to develop facial recognition technology for improving our daily lives if the same technology enables a surveillance state? In just the last few months, several tech employees at companies like Google, Amazon, and Meta, and OpenAI have taken collective action to urge their employers to cancel contracts with the US Immigrations and Customs Enforcement. You can read more about collective action from tech workers in this Wired article and this Guardian article.
Secret Invasion
Read this article about the use of generative AI in Marvel’s Secret Invasion.
Marvel’s Secret Invasion is a superhero-spy-thriller series that faced backlash for its AI-generated title sequence. The director of the series thought the bizarre and shifting images from the AI-generated sequence aligned with the themes of Secret Invasion, which featured questions of identity and shape-shifting aliens.
Many online called for a boycott of the series, questioning the ethics of using a computer to generate the title sequence instead of hiring a team of artists, particularly by a large corporation like Marvel (Disney). Others pointed out that many generative AI models for creative work like visual arts are often trained on images from the web that individual artists may not have consented to have used. So while it’s fun to generate images through bots like Midjourney or Dall-E, it’s hard to tell where the training images were sourced and whether the original owners or creators of the images consented to have their work used. Many online art communities and competitions have implemented and enforced strict rules banning the use of AI to produce artwork.
ChatGPT and Labor
Read this article about the working conditions of the Kenyan workers who helped make ChatGPT less toxic.
ChatGPT is a generative language model from OpenAI that has gained much popularity over the past few years. One of its aspects which surprised many users and researchers is its resistance to toxicity. Other attempted chatbots devolved into racist, sexist, and hateful speech when users fed it such content. ChatGPT, however, would produce warning messages or ostensibly refuse to engage in such behavior.
It was revealed in early 2023 that part of the reason why ChatGPT was so good at resisting toxicity was through extensive and exhaustive human labor to filter through training data for toxic comments. The workers in the article had to read through thousands of hateful and toxic comments and internet content with very little pay, emotional support, or breaks.
Other concerns from using ChatGPT stem from uncertainty about how user data is collected and where training data has been sourced. Additionally, in academic settings (like this class!), an increasing number of students have used ChatGPT or other generative AI for homework help, exam answers, and general breaches of academic integrity. Universities and institutions are still developing policies to keep up with the widespread use of generative AI in classroom settings.
(Needless to say, if we’re doing our jobs as your instructors properly, there should be no need to consult ChatGPT!)
Food for thought (for all ethics case studies):
What is the data that is being used in your case study? What assumptions are being made of it?
What groups are affected by the application in your case study, and in what way? (This can be positive or negative!)
What privacy concerns might arise from using the data in your case study?
Have you used the technology in the case study (or one that is similar)? What did you know about it before using it? Did you learn anything new from the case study?
⏸️ Pause and 🧠 Think
Take a moment to review the following concepts and reflect on your own understanding. A good temperature check for your understanding is asking yourself whether you might be able to explain these concepts to a friend outside of this class.
Here’s what we covered in this lesson:
Fairness
Group fairness / statistical parity
Equal opportunity
Predictive Equality
Pareto frontier
Why case studies?