Objectives
By the end of this lesson, students will be able to:
Sort
pandasDataFramesSkim library documentation to identify relevant examples and usage information.
Apply seaborn and matplotlib to create and customize relational and regression plots.
Describe data visualization principles as they relate the effectiveness of a plot.
Keyword Arguments
This section doesn’t describe anything particular about pandas, but a general feature of Python which will show up in other libraries that we will learn about this quarter. In the following code snippet, we define a function called div and show two different ways to call it! The first is the way we have seen it this whole time and the second is a brand-new way!
def div(a: float, b: float) -> float:
    print('Dividing', a, 'by', b)
    return a / b

# Method 1: Pass "by position"
div(1, 2)

# Method 2: Pass "by name"
div(a=1, b=2)
# When specifying by name, you can provide them in any order!
div(b=2, a=1)
# Notice, this is different!
div(b=1, a=2)
Dividing 1 by 2
Dividing 1 by 2
Dividing 1 by 2
Dividing 2 by 1
2.0Why did we call these two methods “by position” and “by name”? When you were originally calling div(1, 2) you might have taken it a bit for granted how it determined that a should be 1 and b should be 2. When calling a function in the way we showed originally, it determined that the first value passed (1) should be assigned to the first parameter (a), the second value (2) for the second parameter (b), and so on if there were more parameters. This is why we call this “by position” since the position of the value in the function call determines which parameter will have that value.
Instead, Python also provides a way to specify which parameter should have which value by using the names of the parameters in the function call! When you say div(b=2, a=1) you are telling Python you want the parameter b to have value 2 and the parameter a to have value 1. Now the position of the arguments doesn’t matter, but the name you specify does. Notice that div(b=1, a=2) is very different than div(b=2, a=1)!
We will see these named-parameters pop up quite often in the libraries we learn! They usually provide functions with tons of parameters (with some default values)! It would be horrible if you had to specify them all by position (requiring you to know which parameter came 3rd in the list). Instead, you can pass them by name and it simplifies your code!
To see how many parameters a pandas function actually takes, look at its documentation!
import pandas as pd

help(pd.read_csv) # Press q to quit
Help on function read_csv in module pandas:
read_csv(
filepath_or_buffer: FilePath | ReadCsvBuffer[bytes] | ReadCsvBuffer[str],
*,
sep: str | None | lib.NoDefault = <no_default>,
delimiter: str | None | lib.NoDefault = None,
header: int | Sequence[int] | None | Literal['infer'] = 'infer',
names: Sequence[Hashable] | None | lib.NoDefault = <no_default>,
index_col: IndexLabel | Literal[False] | None = None,
usecols: UsecolsArgType = None,
dtype: DtypeArg | None = None,
engine: CSVEngine | None = None,
converters: Mapping[HashableT, Callable] | None = None,
true_values: list | None = None,
false_values: list | None = None,
skipinitialspace: bool = False,
skiprows: list[int] | int | Callable[[Hashable], bool] | None = None,
skipfooter: int = 0,
nrows: int | None = None,
na_values: Hashable | Iterable[Hashable] | Mapping[Hashable, Iterable[Hashable]] | None = None,
keep_default_na: bool = True,
na_filter: bool = True,
skip_blank_lines: bool = True,
parse_dates: bool | Sequence[Hashable] | None = None,
date_format: str | dict[Hashable, str] | None = None,
dayfirst: bool = False,
cache_dates: bool = True,
iterator: bool = False,
chunksize: int | None = None,
compression: CompressionOptions = 'infer',
thousands: str | None = None,
decimal: str = '.',
lineterminator: str | None = None,
quotechar: str = '"',
quoting: int = 0,
doublequote: bool = True,
escapechar: str | None = None,
comment: str | None = None,
encoding: str | None = None,
encoding_errors: str | None = 'strict',
dialect: str | csv.Dialect | None = None,
on_bad_lines: str = 'error',
low_memory: bool = True,
memory_map: bool = False,
float_precision: Literal['high', 'legacy', 'round_trip'] | None = None,
storage_options: StorageOptions | None = None,
dtype_backend: DtypeBackend | lib.NoDefault = <no_default>
) -> DataFrame | TextFileReader
Read a comma-separated values (csv) file into DataFrame.
Also supports optionally iterating or breaking of the file
into chunks.
Additional help can be found in the online docs for
`IO Tools <https://pandas.pydata.org/pandas-docs/stable/user_guide/io.html>`_.
Parameters
----------
filepath_or_buffer : str, path object or file-like object
Any valid string path is acceptable. The string could be a URL. Valid
URL schemes include http, ftp, s3, gs, and file. For file URLs, a host is
expected. A local file could be: file://localhost/path/to/table.csv.
If you want to pass in a path object, pandas accepts any ``os.PathLike``.
By file-like object, we refer to objects with a ``read()`` method, such as
a file handle (e.g. via builtin ``open`` function) or ``StringIO``.
sep : str, default ','
Character or regex pattern to treat as the delimiter. If ``sep=None``, the
C engine cannot automatically detect
the separator, but the Python parsing engine can, meaning the latter will
be used and automatically detect the separator from only the first valid
row of the file by Python's builtin sniffer tool, ``csv.Sniffer``.
In addition, separators longer than 1 character and different from
``'\s+'`` will be interpreted as regular expressions and will also force
the use of the Python parsing engine. Note that regex delimiters are prone
to ignoring quoted data. Regex example: ``'\r\t'``.
delimiter : str, optional
Alias for ``sep``.
header : int, Sequence of int, 'infer' or None, default 'infer'
Row number(s) containing column labels and marking the start of the
data (zero-indexed). Default behavior is to infer the column names:
if no ``names``
are passed the behavior is identical to ``header=0`` and column
names are inferred from the first line of the file, if column
names are passed explicitly to ``names`` then the behavior is identical to
``header=None``. Explicitly pass ``header=0`` to be able to
replace existing names. The header can be a list of integers that
specify row locations for a :class:`~pandas.MultiIndex` on the columns
e.g. ``[0, 1, 3]``. Intervening rows that are not specified will be
skipped (e.g. 2 in this example is skipped). Note that this
parameter ignores commented lines and empty lines if
``skip_blank_lines=True``, so ``header=0`` denotes the first line of
data rather than the first line of the file.
When inferred from the file contents, headers are kept distinct from
each other by renaming duplicate names with a numeric suffix of the form
``".{count}"`` starting from 1, e.g. ``"foo"`` and ``"foo.1"``.
Empty headers are named ``"Unnamed: {i}"`` or ``
"Unnamed: {i}_level_{level}"``
in the case of MultiIndex columns.
names : Sequence of Hashable, optional
Sequence of column labels to apply. If the file contains a header row,
then you should explicitly pass ``header=0`` to override the column names.
Duplicates in this list are not allowed.
index_col : Hashable, Sequence of Hashable or False, optional
Column(s) to use as row label(s), denoted either by column labels or column
indices. If a sequence of labels or indices is given,
:class:`~pandas.MultiIndex`
will be formed for the row labels.
Note: ``index_col=False`` can be used to force pandas to *not* use the first
column as the index, e.g., when you have a malformed file with delimiters at
the end of each line.
usecols : Sequence of Hashable or Callable, optional
Subset of columns to select, denoted either
by column labels or column indices.
If list-like, all elements must either
be positional (i.e. integer indices into the document columns) or strings
that correspond to column names provided either by the user in ``names`` or
inferred from the document header row(s).
If ``names`` are given, the document
header row(s) are not taken into account. For example, a valid list-like
``usecols`` parameter would be ``[0, 1, 2]`` or ``['foo', 'bar', 'baz']``.
Element order is ignored, so ``usecols=[0, 1]`` is the same as ``[1, 0]``.
To instantiate a :class:`~pandas.DataFrame` from ``data`` with element order
preserved use ``pd.read_csv(data, usecols=['foo', 'bar'])[['foo', 'bar']]``
for columns in ``['foo', 'bar']`` order or
``pd.read_csv(data, usecols=['foo', 'bar'])[['bar', 'foo']]``
for ``['bar', 'foo']`` order.
If callable, the callable function will be evaluated against the column
names, returning names where the callable function evaluates to ``True``. An
example of a valid callable argument would be ``lambda x: x.upper() in
['AAA', 'BBB', 'DDD']``. Using this parameter results in much faster
parsing time and lower memory usage.
dtype : dtype or dict of {Hashable : dtype}, optional
Data type(s) to apply to either the whole dataset or individual columns.
E.g., ``{'a': np.float64, 'b': np.int32, 'c': 'Int64'}``
Use ``str`` or ``object`` together with suitable ``na_values`` settings
to preserve and not interpret ``dtype``.
If ``converters`` are specified, they will be applied INSTEAD
of ``dtype`` conversion. Specify a ``defaultdict`` as input where
the default determines the ``dtype``
of the columns which are not explicitly
listed.
engine : {'c', 'python', 'pyarrow'}, optional
Parser engine to use. The C and pyarrow engines are faster,
while the python engine
is currently more feature-complete. Multithreading
is currently only supported by
the pyarrow engine. Some features of the "pyarrow" engine
are unsupported or may not work correctly.
converters : dict of {Hashable : Callable}, optional
Functions for converting values in specified columns. Keys can either
be column labels or column indices.
true_values : list, optional
Values to consider as ``True`` in addition
to case-insensitive variants of 'True'.
false_values : list, optional
Values to consider as ``False`` in addition to case-insensitive
variants of 'False'.
skipinitialspace : bool, default False
Skip spaces after delimiter.
skiprows : int, list of int or Callable, optional
Line numbers to skip (0-indexed) or number of lines to skip (``int``)
at the start of the file.
If callable, the callable function will be evaluated against the row
indices, returning ``True`` if the row should be skipped and ``False``
otherwise.
An example of a valid callable argument would be ``lambda x: x in [0, 2]``.
skipfooter : int, default 0
Number of lines at bottom of file to skip (Unsupported with ``engine='c'``).
nrows : int, optional
Number of rows of file to read. Useful for reading pieces of large files.
Refers to the number of data rows in the returned DataFrame, excluding:
* The header row containing column names.
* Rows before the header row, if ``header=1`` or larger.
Example usage:
* To read the first 999,999 (non-header) rows:
``read_csv(..., nrows=999999)``
* To read rows 1,000,000 through 1,999,999:
``read_csv(..., skiprows=1000000, nrows=999999)``
na_values : Hashable, Iterable of Hashable or dict of {Hashable : Iterable},
optional
Additional strings to recognize as ``NA``/``NaN``. If ``dict``
passed, specific
per-column ``NA`` values. By default the following values
are interpreted as
``NaN``: empty string, "NaN", "N/A", "NULL", and other common
representations of missing data.
keep_default_na : bool, default True
Whether or not to include the default ``NaN`` values when parsing the data.
Depending on whether ``na_values`` is passed in, the behavior is as follows:
* If ``keep_default_na`` is ``True``, and ``na_values``
are specified, ``na_values``
is appended to the default ``NaN`` values used for parsing.
* If ``keep_default_na`` is ``True``, and ``na_values`` are not specified, only
the default ``NaN`` values are used for parsing.
* If ``keep_default_na`` is ``False``, and ``na_values`` are specified, only
the ``NaN`` values specified ``na_values`` are used for parsing.
* If ``keep_default_na`` is ``False``, and ``na_values`` are not specified, no
strings will be parsed as ``NaN``.
Note that if ``na_filter`` is passed in as ``False``,
the ``keep_default_na`` and
``na_values`` parameters will be ignored.
na_filter : bool, default True
Detect missing value markers (empty strings and the value of ``na_values``). In
data without any ``NA`` values, passing ``na_filter=False`` can improve the
performance of reading a large file.
skip_blank_lines : bool, default True
If ``True``, skip over blank lines rather than interpreting as ``NaN`` values.
parse_dates : bool, None, list of Hashable, default None
The behavior is as follows:
* ``bool``. If ``True`` -> try parsing the index.
* ``None``. Behaves like ``True`` if ``date_format`` is specified.
* ``list`` of ``int`` or names.
e.g. If ``[1, 2, 3]`` -> try parsing columns 1, 2, 3
each as a separate date column.
If a column or index cannot be represented as an array of ``datetime``,
say because of an unparsable value or a mixture of timezones, the column
or index will be returned unaltered as an ``object`` data type. For
non-standard ``datetime`` parsing, use :func:`~pandas.to_datetime` after
:func:`~pandas.read_csv`.
Note: A fast-path exists for iso8601-formatted dates.
date_format : str or dict of column -> format, optional
Format to use for parsing dates and/or times when
used in conjunction with ``parse_dates``.
The strftime to parse time, e.g. :const:`"%d/%m/%Y"`. See
`strftime documentation
<https://docs.python.org/3/library/datetime.html
#strftime-and-strptime-behavior>`_ for more information on choices, though
note that :const:`"%f"`` will parse all the way up to nanoseconds.
You can also pass:
- "ISO8601", to parse any `ISO8601 <https://en.wikipedia.org/wiki/ISO_8601>`_
time string (not necessarily in exactly the same format);
- "mixed", to infer the format for each element individually. This is risky,
and you should probably use it along with `dayfirst`.
.. versionadded:: 2.0.0
dayfirst : bool, default False
DD/MM format dates, international and European format.
cache_dates : bool, default True
If ``True``, use a cache of unique, converted dates to apply the ``datetime``
conversion. May produce significant speed-up when parsing duplicate
date strings, especially ones with timezone offsets.
iterator : bool, default False
Return ``TextFileReader`` object for iteration or getting chunks with
``get_chunk()``.
chunksize : int, optional
Number of lines to read from the file per chunk. Passing a value will cause the
function to return a ``TextFileReader`` object for iteration.
See the `IO Tools docs
<https://pandas.pydata.org/pandas-docs/stable/io.html#io-chunking>`_
for more information on ``iterator`` and ``chunksize``.
compression : str or dict, default 'infer'
For on-the-fly decompression of on-disk data.
If 'infer' and 'filepath_or_buffer' is
path-like, then detect compression from the following extensions: '.gz',
'.bz2', '.zip', '.xz', '.zst', '.tar', '.tar.gz', '.tar.xz' or '.tar.bz2'
(otherwise no compression).
If using 'zip' or 'tar', the ZIP file must contain only
one data file to be read in.
Set to ``None`` for no decompression.
Can also be a dict with key ``'method'`` set
to one of {``'zip'``, ``'gzip'``, ``'bz2'``,
``'zstd'``, ``'xz'``, ``'tar'``} and
other key-value pairs are forwarded to
``zipfile.ZipFile``, ``gzip.GzipFile``,
``bz2.BZ2File``, ``zstandard.ZstdDecompressor``, ``lzma.LZMAFile`` or
``tarfile.TarFile``, respectively.
As an example, the following could be passed for
Zstandard decompression using a
custom compression dictionary:
``compression={'method': 'zstd', 'dict_data': my_compression_dict}``.
thousands : str (length 1), optional
Character acting as the thousands separator in numerical values.
decimal : str (length 1), default '.'
Character to recognize as decimal point (e.g., use ',' for European data).
lineterminator : str (length 1), optional
Character used to denote a line break. Only valid with C parser.
quotechar : str (length 1), optional
Character used to denote the start and end of a quoted item. Quoted
items can include the ``delimiter`` and it will be ignored.
quoting : {0 or csv.QUOTE_MINIMAL, 1 or csv.QUOTE_ALL,
2 or csv.QUOTE_NONNUMERIC, 3 or csv.QUOTE_NONE}, default csv.QUOTE_MINIMAL
Control field quoting behavior per ``csv.QUOTE_*`` constants. Default is
``csv.QUOTE_MINIMAL`` (i.e., 0) which implies that
only fields containing special
characters are quoted (e.g., characters defined
in ``quotechar``, ``delimiter``,
or ``lineterminator``.
doublequote : bool, default True
When ``quotechar`` is specified and ``quoting`` is not ``QUOTE_NONE``, indicate
whether or not to interpret two consecutive ``quotechar`` elements INSIDE a
field as a single ``quotechar`` element.
escapechar : str (length 1), optional
Character used to escape other characters.
comment : str (length 1), optional
Character indicating that the remainder of line should not be parsed.
If found at the beginning
of a line, the line will be ignored altogether. This parameter must be a
single character. Like empty lines (as long as ``skip_blank_lines=True``),
fully commented lines are ignored by the parameter ``header`` but not by
``skiprows``. For example, if ``comment='#'``, parsing
``#empty\na,b,c\n1,2,3`` with ``header=0`` will result in ``'a,b,c'`` being
treated as the header.
encoding : str, optional, default 'utf-8'
Encoding to use for UTF when reading/writing (ex. ``'utf-8'``). `List of Python
standard encodings
<https://docs.python.org/3/library/codecs.html#standard-encodings>`_ .
encoding_errors : str, optional, default 'strict'
How encoding errors are treated. `List of possible values
<https://docs.python.org/3/library/codecs.html#error-handlers>`_ .
dialect : str or csv.Dialect, optional
If provided, this parameter will override values (default or not) for the
following parameters: ``delimiter``, ``doublequote``, ``escapechar``,
``skipinitialspace``, ``quotechar``, and ``quoting``. If it is necessary to
override values, a ``ParserWarning`` will be issued. See ``csv.Dialect``
documentation for more details.
on_bad_lines : {'error', 'warn', 'skip'} or Callable, default 'error'
Specifies what to do upon encountering a bad line (a line with too many fields).
Allowed values are:
- ``'error'``, raise an Exception when a bad line is encountered.
- ``'warn'``, raise a warning when a bad line is
encountered and skip that line.
- ``'skip'``, skip bad lines without raising or warning when
they are encountered.
- Callable, function that will process a single bad line.
- With ``engine='python'``, function with signature
``(bad_line: list[str]) -> list[str] | None``.
``bad_line`` is a list of strings split by the ``sep``.
If the function returns ``None``, the bad line will be ignored.
If the function returns a new ``list`` of strings with
more elements than
expected, a ``ParserWarning`` will be emitted while
dropping extra elements.
- With ``engine='pyarrow'``, function with signature
as described in pyarrow documentation: `invalid_row_handler
<https://arrow.apache.org/docs/python
/generated/pyarrow.csv.ParseOptions.html
#pyarrow.csv.ParseOptions.invalid_row_handler>`_.
.. versionchanged:: 2.2.0
Callable for ``engine='pyarrow'``
low_memory : bool, default True
Internally process the file in chunks, resulting in lower memory use
while parsing, but possibly mixed type inference. To ensure no mixed
types either set ``False``, or specify the type with the ``dtype`` parameter.
Note that the entire file is read into a single :class:`~pandas.DataFrame`
regardless, use the ``chunksize`` or ``iterator``
parameter to return the data in
chunks. (Only valid with C parser).
memory_map : bool, default False
If a filepath is provided for ``filepath_or_buffer``, map the file object
directly onto memory and access the data directly from there. Using this
option can improve performance because there is no longer any I/O overhead.
float_precision : {'high', 'legacy', 'round_trip'}, optional
Specifies which converter the C engine should use for floating-point
values. The options are ``None`` or ``'high'`` for the ordinary converter,
``'legacy'`` for the original lower precision pandas converter, and
``'round_trip'`` for the round-trip converter.
storage_options : dict, optional
Extra options that make sense for a particular storage connection, e.g.
host, port, username, password, etc. For HTTP(S) URLs the key-value pairs
are forwarded to ``urllib.request.Request`` as header options. For other
URLs (e.g. starting with "s3://", and "gcs://") the key-value pairs are
forwarded to ``fsspec.open``. Please see ``fsspec`` and ``urllib`` for more
details, and for more examples on storage options refer `here
<https://pandas.pydata.org/docs/user_guide/io.html?
highlight=storage_options#reading-writing-remote-files>`_.
dtype_backend : {'numpy_nullable', 'pyarrow'}
Back-end data type applied to the resultant :class:`DataFrame`
(still experimental). If not specified, the default behavior
is to not use nullable data types. If specified, the behavior
is as follows:
* ``"numpy_nullable"``: returns nullable-dtype-backed :class:`DataFrame`
* ``"pyarrow"``: returns
pyarrow-backed nullable :class:`ArrowDtype` :class:`DataFrame`
.. versionadded:: 2.0
Returns
-------
DataFrame or TextFileReader
A comma-separated values (csv) file is returned as two-dimensional
data structure with labeled axes.
See Also
--------
DataFrame.to_csv : Write DataFrame to a comma-separated values (csv) file.
read_table : Read general delimited file into DataFrame.
read_fwf : Read a table of fixed-width formatted lines into DataFrame.
Examples
--------
>>> pd.read_csv("data.csv") # doctest: +SKIP
Name Value
0 foo 1
1 bar 2
2 #baz 3
Index and header can be specified via the `index_col` and `header` arguments.
>>> pd.read_csv("data.csv", header=None) # doctest: +SKIP
0 1
0 Name Value
1 foo 1
2 bar 2
3 #baz 3
>>> pd.read_csv("data.csv", index_col="Value") # doctest: +SKIP
Name
Value
1 foo
2 bar
3 #baz
Column types are inferred but can be explicitly specified using the dtype argument.
>>> pd.read_csv("data.csv", dtype={"Value": float}) # doctest: +SKIP
Name Value
0 foo 1.0
1 bar 2.0
2 #baz 3.0
True, False, and NA values, and thousands separators have defaults,
but can be explicitly specified, too. Supply the values you would like
as strings or lists of strings!
>>> pd.read_csv("data.csv", na_values=["foo", "bar"]) # doctest: +SKIP
Name Value
0 NaN 1
1 NaN 2
2 #baz 3
Comment lines in the input file can be skipped using the `comment` argument.
>>> pd.read_csv("data.csv", comment="#") # doctest: +SKIP
Name Value
0 foo 1
1 bar 2
By default, columns with dates will be read as ``object`` rather than ``datetime``.
>>> df = pd.read_csv("tmp.csv") # doctest: +SKIP
>>> df # doctest: +SKIP
col 1 col 2 col 3
0 10 10/04/2018 Sun 15 Jan 2023
1 20 15/04/2018 Fri 12 May 2023
>>> df.dtypes # doctest: +SKIP
col 1 int64
col 2 object
col 3 object
dtype: object
Specific columns can be parsed as dates by using the `parse_dates` and
`date_format` arguments.
>>> df = pd.read_csv(
... "tmp.csv",
... parse_dates=[1, 2],
... date_format={"col 2": "%d/%m/%Y", "col 3": "%a %d %b %Y"},
... ) # doctest: +SKIP
>>> df.dtypes # doctest: +SKIP
col 1 int64
col 2 datetime64[ns]
col 3 datetime64[ns]
dtype: object
This is why doc-strings are so important!
Python lets you use both passing by-name and by-position in a single function call. For example, if you want to use the print function, but don’t want the new-line on the end, you would write:
# Try changing end to something else to see it print at the end!
print('Hello world', end='')
print('Hi!')
Hello worldHi!
How does Python determine which is which? It first uses the arguments passed by-position to fill up the first parameters and then fills in the remaining with the ones passed by-name. You aren’t allowed to specify something by-name if it was already specified by-position.
This might make more sense with an example we define.
def method(a: int, b: int, c: int) -> None:
    print(str(a) + ',' + str(b) + ',' + str(c))

# 1 will be interpretted as a's value, rest are by-name
method(1, b=2, c=3)

# Causes an error because we tried to specify a twice!
method(2, a=1, c=3)
1,2,3
---------------------------------------------------------------------------
TypeError                                 Traceback (most recent call last)
Cell In[4], line 8
      4 # 1 will be interpretted as a's value, rest are by-name
      5 method(1, b=2, c=3)
      6
      7 # Causes an error because we tried to specify a twice!
----> 8 method(2, a=1, c=3)

TypeError: method() got multiple values for argument 'a'
Default Parameters
Keyword arguments help programmers define methods that take many parameters without needing to memorize the exact position of each parameter. But specifying each and every parameter can still be a complicated task; for example, pd.read_csv actually defines 50 parameters. Thanks to default parameter values, we only need to specify the arguments that we actually want to customize.
When defining the parameter list for a function, the syntax param: type = value assigns the param a default value. Remember we use param: type to provide an annotation for the method signature, and then after that variable we use = value to give it a default value.
def div(a: int = 10, b: int = 1) -> float:
    return a / b


print('div(2, 3)', div(2, 3))
print('div(2)', div(2))
print('div(b=3)', div(b=3))
print('div()', div())
div(2, 3) 0.6666666666666666
div(2) 2.0
div(b=3) 3.3333333333333335
div() 10.0
Notice that on many of the calls, we omit passing one of a or b. This does not cause an error because a and b were assigned default values of 10 and 1, respectively!
Missing Values
Most data in the world is messy. It might be in a format that you will have trouble reading from or it might contain errors. One of the most common types of errors in datasets is missing data: some entries or values might not be available in the dataset. When you take a look at some datasets, you may encounter something called NaN.
NaN represents a special number whose value is invalid or missing. In Python, NaN operates by two rules:
Any arithmetic operation on
NaN, evaluates toNaN.Any boolean comparison on
NaN, evaluates toFalse.
We can access the value NaN most easily by using the library numpy (commonly imported as np). We will learn more about numpy when we start working with image data later in the quarter.
import numpy as np

print(np.nan)            # nan
print(1 + np.nan)        # nan
print(np.nan * 1)        # nan
print(1 == np.nan)       # False
print(np.nan == np.nan)  # False
nan
nan
nan
False
False
That last line is pretty surprising since we compared np.nan to np.nan. Remember though, one of the rules of NaN is that every boolean comparison on NaN is False!
How is NaN different than None? None doesn’t allow any numeric operations on it, it will cause an error!
print(1 + None)---------------------------------------------------------------------------
TypeError Traceback (most recent call last)
Cell In[7], line 1
----> 1 print(1 + None)
TypeError: unsupported operand type(s) for +: 'int' and 'NoneType'pandas methods automatically ignore NaN values for many simple operations such as mean. In situations where this automated behavior is not desired, we can manage NaN values using a few pandas DataFrame and Series methods.
To detect if there are missing values in a Series:
isnull()returns a boolSeries, whereTruemarksNaNvalues.notnull()returns a boolSeries, whereTruemarks non-NaNvalues.
To return a new DataFrame with NaN removed:
dropna()removes all rows with missing data.fillna(value)replaces missing data with the givenvalue.
Food for thought: When would it be better to drop NaN rows, and when would it be better to fill them with another value?
Data Visualization in seaborn
Before we begin, let’s put a word of caution about how to approach learning these libraries:
Trying to memorize all of these function calls and patterns is a ridiculous task. We will throw a lot of new functions at you very quickly and the intent is not for you to be able to memorize them all. The more important thing is to understand how to use them as examples and adapt those examples to the problem you are trying to solve.
The most important thing is to understand the big ideas highlighted by the code!
We won’t always be able to explain every bit of code. The purpose is to give you some examples that you can run for your own projects and help you navigate the libraries so that you can find relevant documentation in the future.
We will be using a modified dataset of pokemon to explore how to visualize our data!
import pandas as pd

data = pd.read_csv('pokemon.csv')
data # For displayWe’ll learn two well-known plotting libraries matplotlib and seaborn.
matplotlib (commonly abbreviated plt) is a well-established plotting library that’s used in many different contexts.
seaborn (commonly abbreviated sns) is a library that extends matplotlib for popular data science workflows. Since seaborn extends matplotlib, writing seaborn code can sometimes involve overlapping with matplotlib parts.
As an example, even when we import the seaborn library, it’s also necessary to call sns.set_theme() to use the seaborn visual style rather than the default matplotlib visual style.
import matplotlib.pyplot as plt
import seaborn as sns

sns.set_theme() # Important!!

# This line is needed in Jupyter notebooks to make the plots show up automatically
%matplotlib inline
Let’s start by making our first plot! We want to make a scatter plot that shows how Pokemon Attack and Defense compare.
We will explain what this code does after this cell.
sns.relplot(x='Attack', y='Defense', data=data)<seaborn.axisgrid.FacetGrid at 0x13821da90>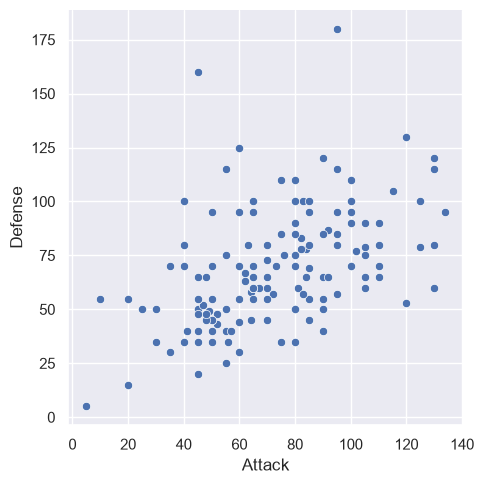
Skim the examples to see what the function is capable of, don’t focus too much on code yet.
Read the overview to get a general description of what the function does.
Look at examples and the code in depth. Look at documentation for relevant parameters to see what they do and what other options you can specify.
If necessary, skim parameter list to check out other parameters.
Importantly, the skill we are developing here is how to adapt examples seen previously to new tasks. This is a critical skill for data scientists since there is a new library to learn all the time!
Looking through the examples on that page, I see that I can set the size of the dots by some other value. Let’s go ahead and do that!
sns.relplot(x='Attack', y='Defense', size='Stage', data=data)<seaborn.axisgrid.FacetGrid at 0x1383c5810>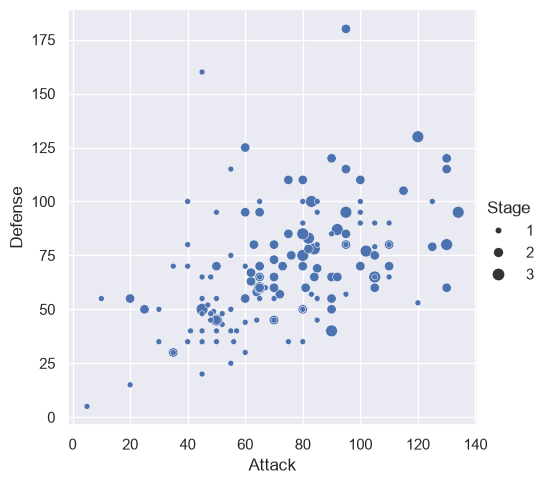
In CSE 163, we will ask you to use the following seaborn functions for plotting. Notice that most of them can generate different types of plots with the kind parameter.
Again, don’t memorize these functions or their parameters! You might want to look through their examples to see all the different types of plots you can make.
Let’s try using another one of those functions to make a plot to show how many pokemon are of each type!
sns.catplot(x='Type 1', kind='count', data=data)<seaborn.axisgrid.FacetGrid at 0x13851efd0>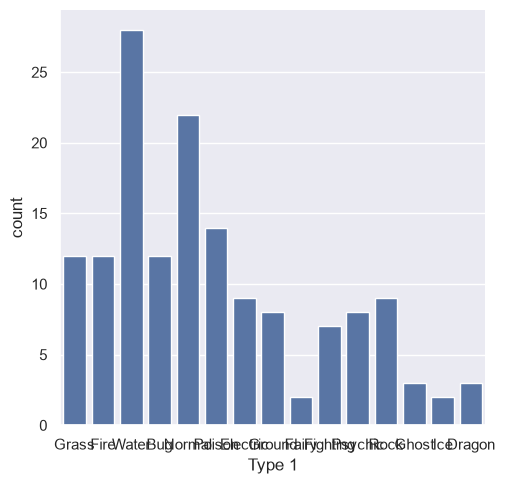
Yikes! I can’t read the x-axis labels; can you? seaborn does a great job making visualizations that look pretty good by default, but makes it really hard to customize them in small ways. This is is where matplotlib comes in to help us customize the chart.
To fix this specific issue of being unable to read the x-axis, we need to rotate the x-axis ticks. The following cell does that using matplotlib (remember that we imported it as plt.).
Note: We add a
passcall at the end of the cell to surpress extra output in the notebook. This is not an important detail, but makes the notebook slightly cleaner to avoid the automatic display of the value returned by the last function call.
sns.catplot(x='Type 1', kind='count', color='b', data=data)
plt.xticks(rotation=-45)

pass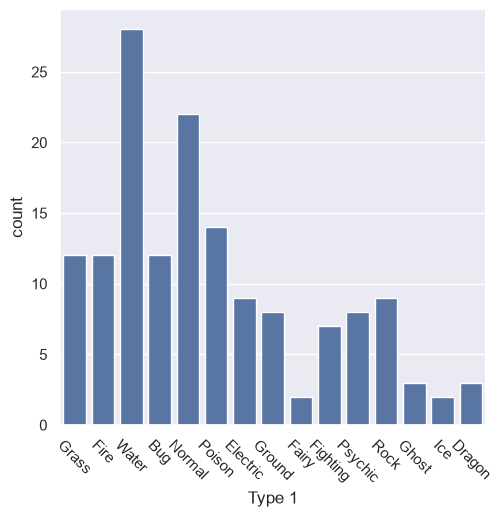
For the purpose of this course, we’ll focus on three key matplotlib functions to make minor customizations:
plt.title('My Title'): To set the title of the chartplt.xlabel('X-Axis Label'): To set the x-axis labelplt.ylabel('Y-Axis Label'): To set the y-axis label
The following cell shows how to set all of these for the bar-plot.
sns.catplot(x='Type 1', kind='count', color='b', data=data)
plt.xticks(rotation=-45)

plt.title('Count of Each Primary Pokemon Type')
plt.xlabel('Primary Type')
plt.ylabel('Number of Pokemon')

pass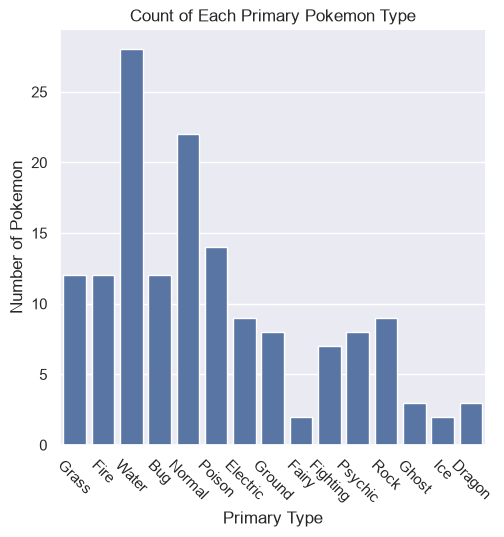
We’ll revisit this topic later in the quarter to show how to make more complex plots, such as side-by-side plots. But it’s important to keep in mind that we’re just starting out in data visualization.
Data visualization is an opportunity for you to learn the develop your skill of reading documentation and building your own working knowledge. This reflects the learning you will need to do in the real world, and seaborn is such a great case-study for this because their documentation is quite incredible!
Food for thought: We noted earlier that either a bar or violin plot could be made with the catplot function. Look through the documentation for catplot. What other types of plots can be made with the catplot function?
Data Visualization Principles
Graphs, maps, and plots are designed to communicate information. Here, function is more important than form. In other words, we should prioritize making your graph effective and only keep aesthetics as a secondary concern. We should also be aware of and avoid perceptual traps that can trick people in reaching the wrong conclusions. A single visualization will rarely answer all questions, but the ability to generate appropriate visualizations quickly is critical!
Types of Data
There are three broad categories of data that we use when thinking about visualizations:
Quantitative: Numeric data that can be measured or meaningfully manipulated with algebraic and logical operations. Examples include salary, age, and distance.
Ordinal: Categorical data that has an inherent odering. Examples include finishing places in a race or levels of education.
Nominal: Categorical data without ordering. Examples include the name of your school, colors, or ID labels.
An encoding is a shorthand of representing data in another format, in this case, visually. In 1986, Jock Mackinlay researched ways that we could effectively encode different types of data. In his thesis, he came up with these orderings for encoding effectiveness.
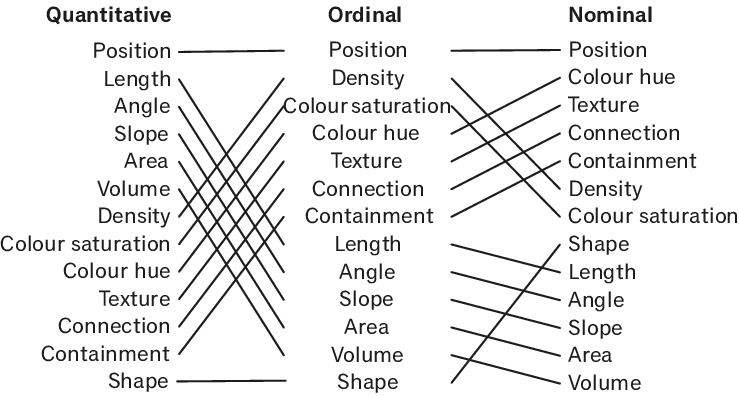
For all three types of data, the Position encoding (referring to the placement of a data point in the visualization plane) is the most effective encoding. But then the rest of the rankings differ drastically depending on the type of data you have! Length, angle, slope, area, volume and density are really effective for quantitative data, but less effective for ordinal and nominal data.
Remembering the specific ordering of this chart is not important, but thinking critically about how you encode different types of information is! It’s important to always have a good reason to justify using a certain type of mark to best convey your data.
Ineffective Visualizations
If you follow the news or use social media, you likely see histograms, heatmaps, or infographics on a daily basis. These visualizations can give us a clear idea of what an information source means by providing visual context through maps or graphs. Unfortunately, some visualizations may be unintentionally confusing or intentionally misleading. Here are two. See if you can answer the questions for each graph.
NSW Clusters compared
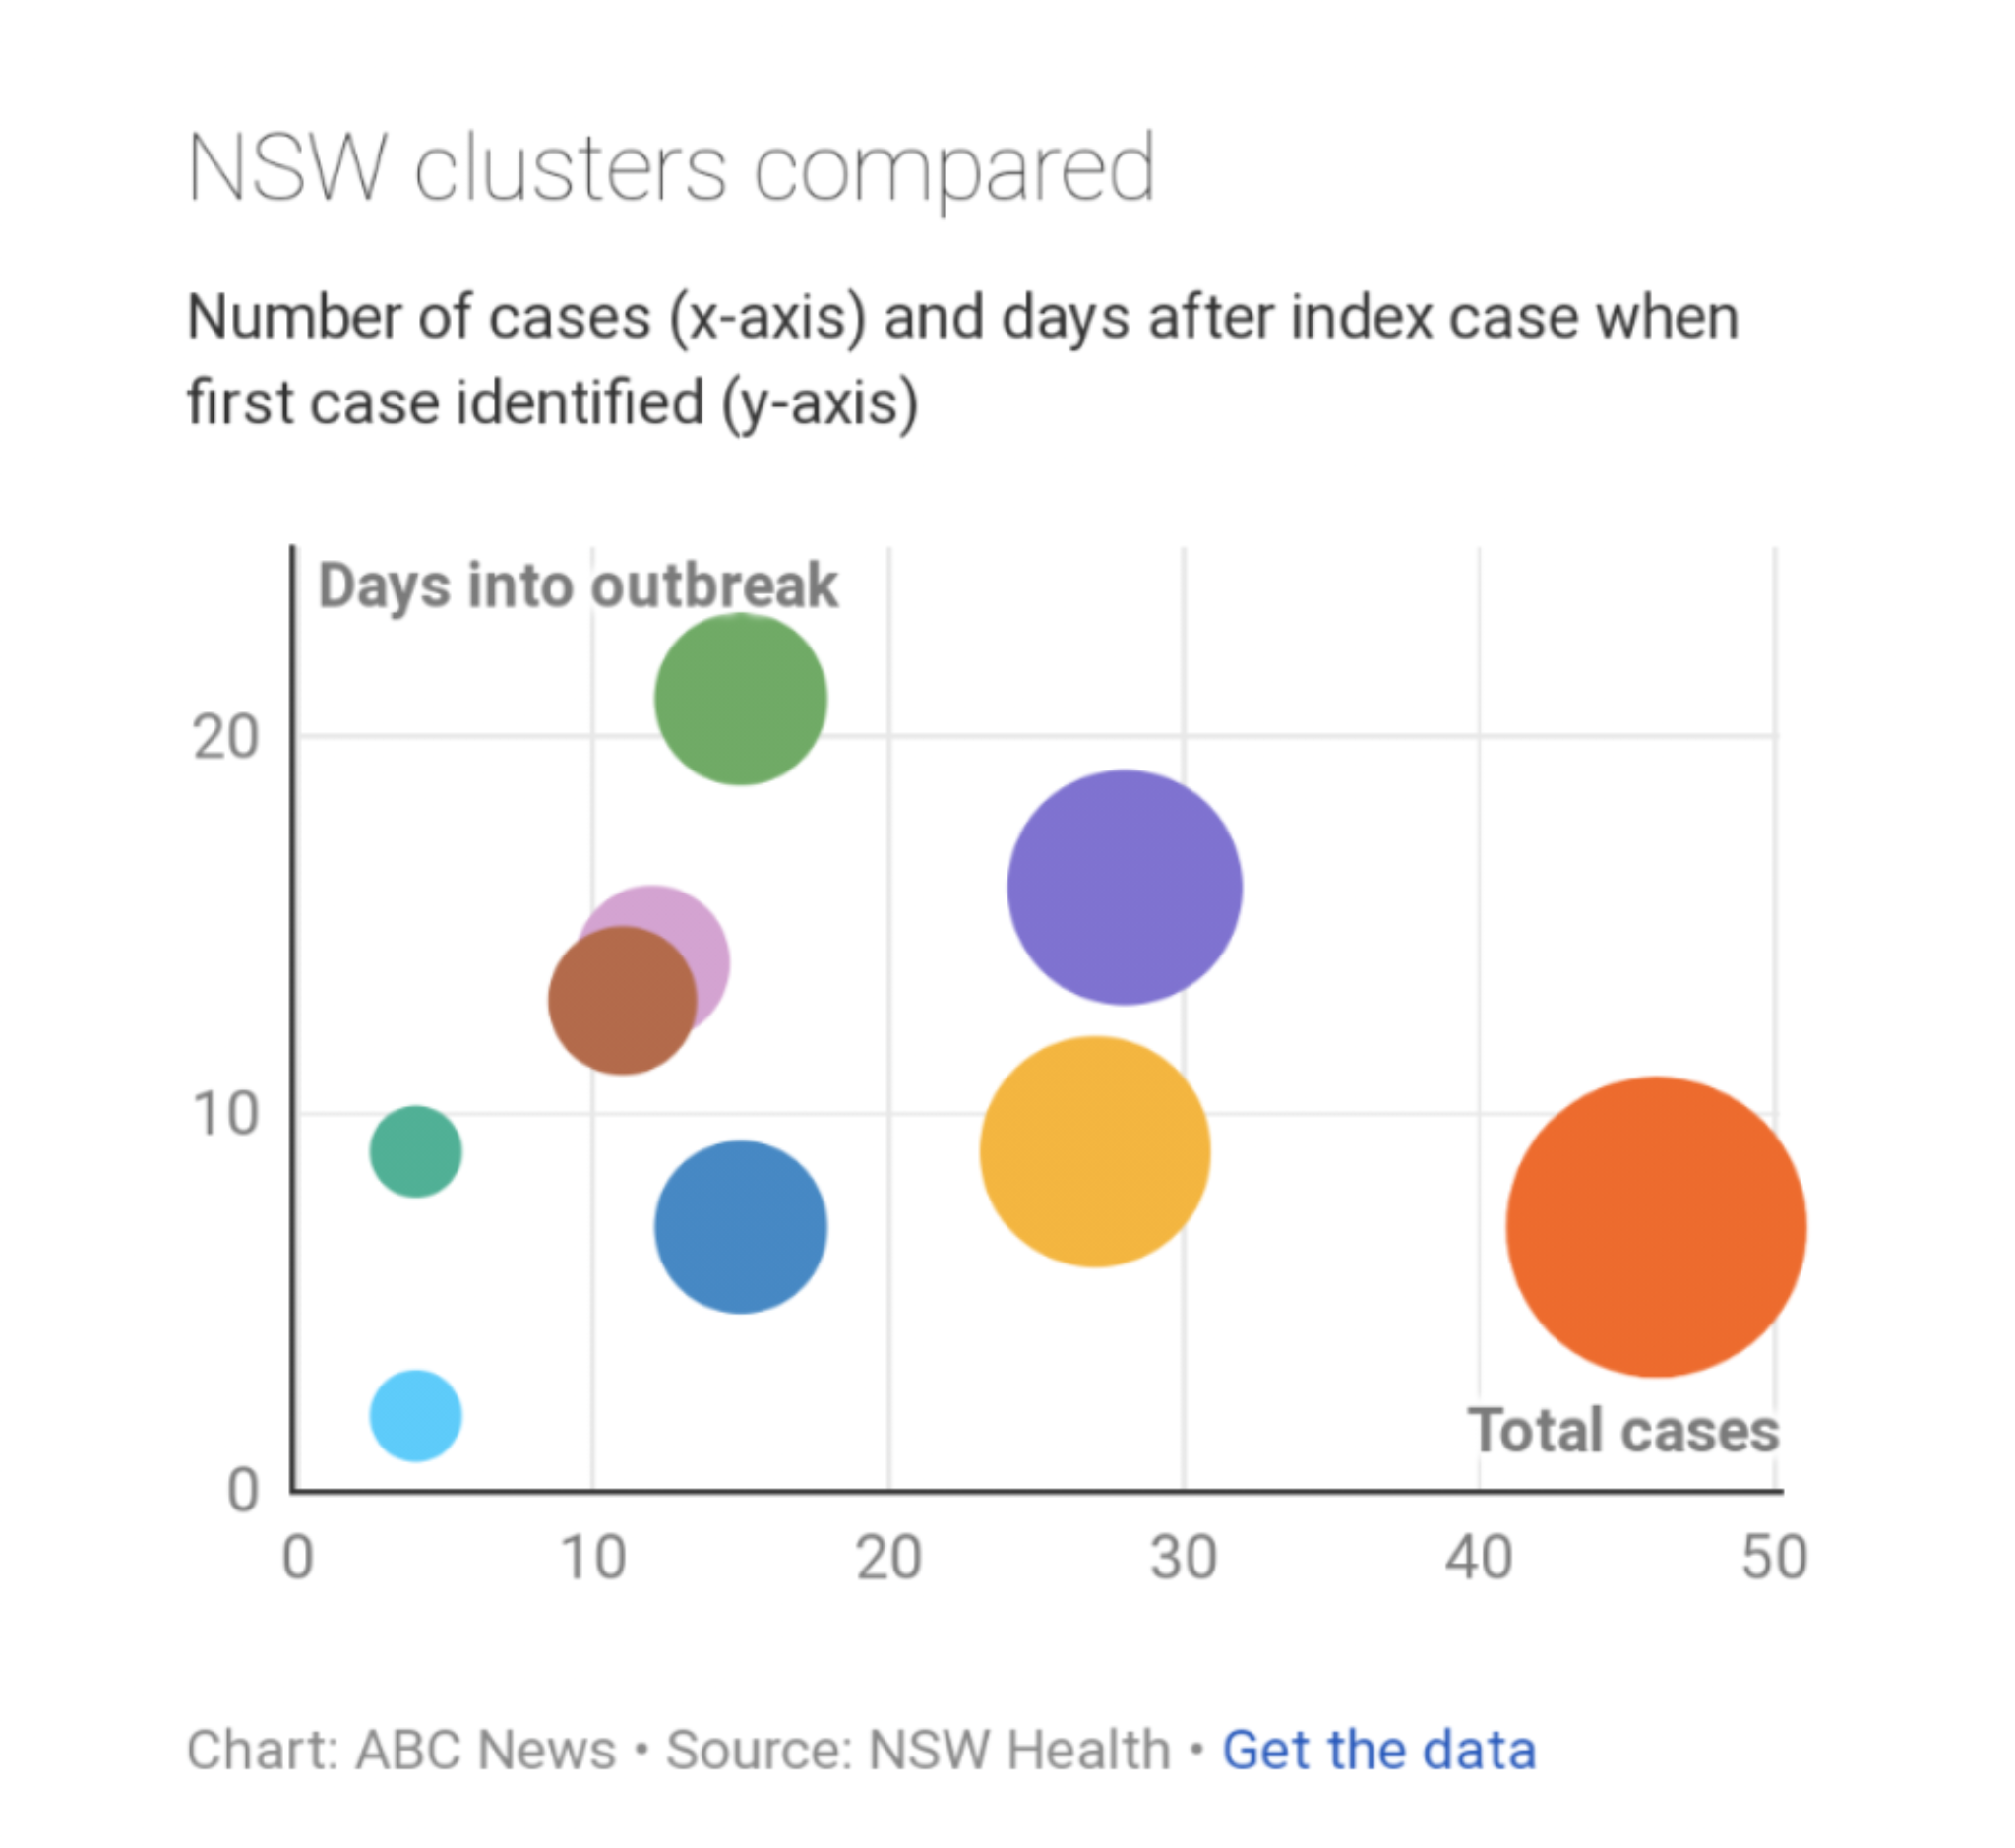
What encodings are used in this visualization?
What do you think this visualization is trying to communicate?
What aspects of the visual are effective?
What aspects are confusing?
Consumption basket of millennials in 2018
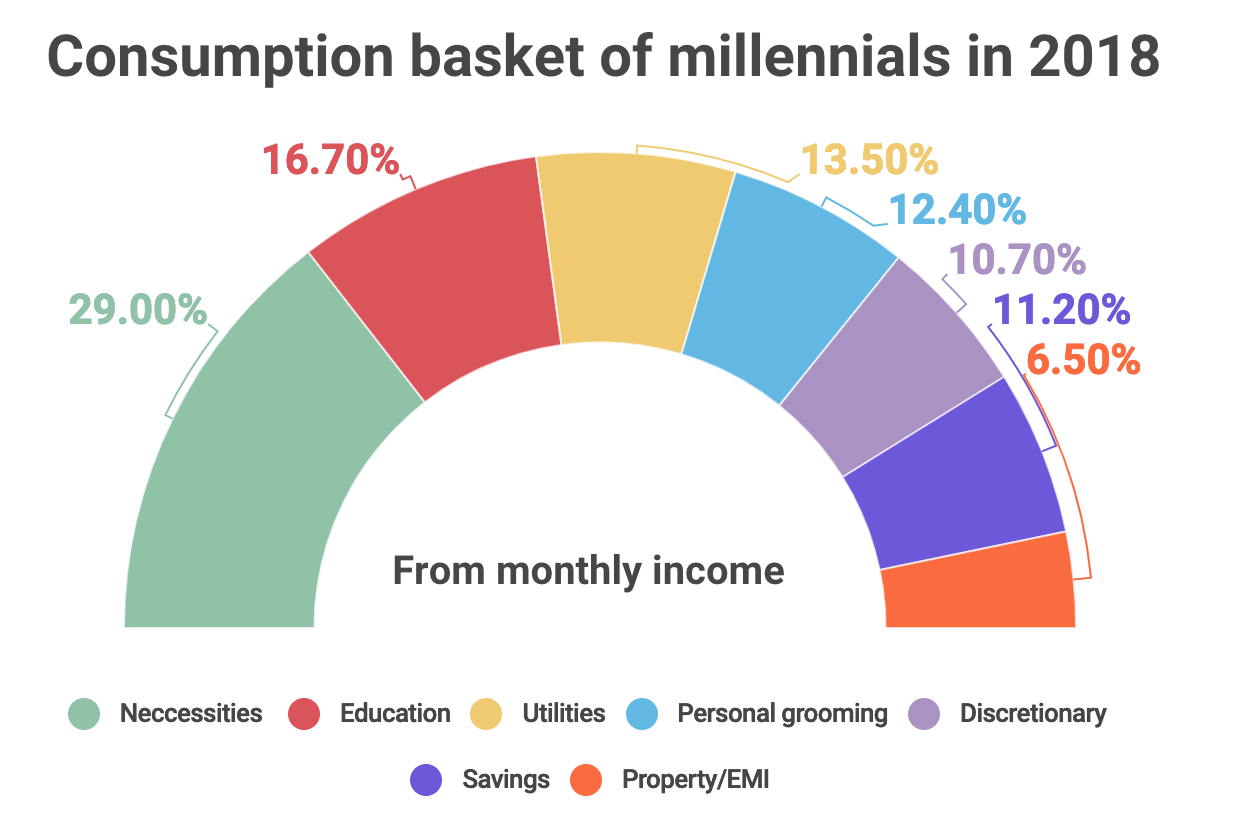
What encodings are used in this visualization?
What do you think this visualization is trying to communicate?
What aspects of the visual are effective?
What aspects are confusing?
⏸️ Pause and 🧠 Think
Take a moment to review the following concepts and reflect on your own understanding. A good temperature check for your understanding is asking yourself whether you might be able to explain these concepts to a friend outside of this class.
Here’s what we covered in this lesson:
Keyword arguments
Default parameters
Missing values and functions
NaN.isnull().notnull().dropna().fillna()
seabornrelplotcatplot
Data Visualization Principles
Let’s work on the problems in iris.ipynb. We will also need iris.csv and iris_missing.csv for these tasks.