CSE 163, Winter 2021: Assessment 5: Processing Geospatial Data
Overview
In this assignment, you will do a bit of data analysis involving geospatial data in order to investigate food deserts in Washington state.
Learning Objectives
This assessment will show students have mastery in the following skills::
- Use a join to merge data from different datasets.
- Graph geospatial information on a map (including multiple layers).
- Read library documentation to figure out how to call a library function
Expectations
Here are some baseline expectations we expect you to meet:
Follow the course collaboration policies
- For this assignment, you do not need to write any tests.
- However, you should include a main method in
hw5_main.pythat uses the main method pattern that calls every method you write using the provided dataset.
Files
The files for this assignment include:
cse163_utils.py: A file where we will store utility functions to help you write any tests you might want to write.tl_2010_53_tract00: A directory containing all of the shapefile information. You will most likely only be working with filetl_2010_53_tract00/tl_2010_53_tract00.shpinside this directory. The data is described below. This data is stored on the course directory on Ed so you will not see it in your toggle tree view while working on your submission.food-access.csv: CSV file containing information about food access. The data is described below. This data is stored on Ed so you will not see it on the toggle tree view while working on your submission.
Data
In this assignment, you will be working with two datasets.
The datasets for this assignment can be a lot to take in at first. Our ultimate goal with this dataset is to count how many people in a given census tract do not have easy access to food. For this dataset, we define "access" as being more than X miles from a food source. Ease of access depends on if the census tract is a urban or a rural area:
- For urban areas, we want to look at the number of people more than half a mile away from their closest food source (
lapophalf). - For rural areas (i.e., not urban), we want to look at people more than 10 miles away from their closest food source (
lapop10).
A census tract will be low access as a whole if exceeds some threshold of people who qualify as having low access (according to whether or not the census tract is urban). This process can help us identify potential "food deserts".
Shape File
The first dataset you will be using comes from the 2010 census. The information is stored in the tl_2010_53_tract00 directory, but you will most likely only be using the tl_2010_53_tract00/tl_2010_53_tract00.shp file as the access point to this data. The shapefile is similar to a CSV in the sense that it has columns and rows, but it has special functionality for geospatial data. Each row of the dataset corresponds to one census tract. The data has many columns, but you only need to understand the following:
- CTIDFP00: This is the identifier that specifies each census tract. This number will be how we link the two datasets.
- geometry: The column that stores the actual geometry of the census tract.
This dataset only has entries for census tracts in Washington state.
Food Access Data
The second dataset stores information about food access in each of these census tracts. The file is stored as a CSV format that we have been using all quarter. Each row in the dataset corresponds to a census tract and has the following columns. The data has many columns, but you only need to understand the following:
- CensusTract: This is the identifier that specifies each census tract. This number will be how we link the two datasets.
- State: Which state the census tract is in.
- County: The name of the county this census tract is in.
- Urban: Flag (0 or 1) that indicates if this census tract is an urban environment (i.e. city).
- Rural: Flag (0 or 1) that indicates if this census tract is a rural environment (i.e. not a city).
- LATracts_half: Flag (0 or 1) if this census tract is "low access" at the half mile level. This means there are a sufficient number of people in the census tract that are at least a half mile away from a food source (i.e. grocery store).
- LATracts10: Flag (0 or 1) if this census tract is "low access" at the 10 mile level. This means there are a sufficient number of people in the census tract that are at least 10 miles away from a food source (i.e. grocery store).
- POP2010: The number of people in this census tract according to the 2010 census.
- lapophalf: The number of people in this census tract that are considered having "low access" at the half mile level. You will use this number to determine if the census tract is low access like
LATracts_halfdoes. - lapop10: The number of people in this census tract that are considered having "low access" at the 10 mile level. You will use this number to determine if the census tract is low access like
LATracts10does. - lalowihalf: Similar to
lapophalfbut only counts the people that are considered low access and low income. - lalowi10: Similar to
lapop10but only counts the people that are considered low access and low income.
This dataset has entries for the entire country.
How To Run on Ed
Just like for HW4, to avoid having to duplicate the datasets, we will all use a shared location for the data. You can find the data files on Ed at the locations below. When submitting your assignment, you will need to use these path names so you can submit.
/course/food-access/tl_2010_53_tract00/tl_2010_53_tract00.shp/course/food-access/food-access.csv
Playground
You can access a playground notebook here. We recommend trying this out and seeing how the dataset looks like and for prototyping your solutions!
It seems like Ed is not able to sustain the notebook playground for this assignment. We have also provided a playground on a tool called Google Colaboratory (Colab) which you can access here. Colab is like Google Docs for Jupyter Notebooks so while the UI looks slightly different, all the great things about Jupyter Notebooks will stay. The one thing to note is that you will not be able to save if you edit our copy, so you will need to click the "Copy to Drive" button near the top to make your own copy! Please post on the message board if you have any troubles with this!
To access the data, you should use the files in the directory on Colab (e.g.,
tl_2010_53_tract00/tl_2010_53_tract00.shpandfood-access.csv) instead of the full paths on Ed. When you submit your assignment though, you will need the full paths.
Part 0
In this part of the assessment, you will load and merge the data from the files. See the Overview for a description of the dataset files.
Part 0 Expectations
- For this part of the assignment, you may import and use the
geopandasandpandaspackages, but you may not use any other imports to solve this problem. - You should not use any loops to loop over the dataset in this part of the assignment.
- You should avoid using extra
.copys of DataFrames.
Loading the Data
In hw5_main.py, write a function called load_in_data that takes two parameters, the file name of a shape file of Census Tract shapes and the file name of a CSV containing food access data. load_in_data should return a GeoDataFrame that has the two datasets merged together. For example, to call this method with the provided files:
load_in_data('tl_2010_53_tract00/tl_2010_53_tract00.shp', 'food-access.csv')This function should join the data on the columns that indicate the census tract ID. For the shape file, this column is called CTIDFP00, while it is called CensusTract in the CSV file. You may assume the given files reference datasets with the column names for merging. However for flexibility, in this function you should make no other assumptions about the other columns in the datasets.
It is possible that there are census tracts in the shape file that do not have corresponding data for food access. Part of the challenge in this assignment is figuring out how you will need to handle these missing values to answer the questions posed.
For the provided datasets, your function should return a GeoDataFrame with 1318 rows and 30 columns. As a sanity check, our solution is 4 lines long.
Part 1
In this section, we will perform some various data analyses on the combined dataset you created in Part 0.
For each of the functions below, they should be written in hw5_main.py and each one should only take in the merged data from Part 0 as a parameter.
Part 1 Expectations
- For this part of the assignment, you may import and use the
math,matplotlib.pyplot,geopandas, andpandaspackages, but you may not use any other imports. - Every plot should have a descriptive title you come up with. For problem 4, we tell you what the titles of the plots should be. Avoid overly long titles (40+ Characters). You do not need to make labels for the x-axis or y-axis.
- You do not need to specify a
figsizeunless we explicitly asked you to. - Your program should be efficient in the sense that it avoids unnecessarily doing join or group by operations when unnecessary. Particularly, you should avoid repeatedly doing these tasks to solve the same problem.
- For full credit, your solutions to these problems must not use any loops or list comprehensions that have to iterate over the entire dataset.
- If you are working in Ed save images with exactly the name we tell you to (do not add "/home/" to the front for example)
- You do not need to use
bbox_inches=tightfor any plot on this assignment - You should avoid using extra
.copys of DataFrames. - Redundancy in plotting code is expected and there is no need to try to refactor.
Problem 0: percentage_food_data
Write a function called percentage_food_data that takes the merged data as a parameter and returns the percentage of census tracts in Washington that we have food access data for. The returned percentage should be a float between 0 and 100. You should not round the result.
Problem 1: plot_map
Write a function called plot_map that takes the merged data as a parameter and plots a map of Washington. There is no need to customize this plot or add any data on top of it; it should just plot the shape of all the census tracts. The output should look like Washington state (e.g., it should have no "holes" in the map). You should save the plot in a file called washington_map.png.
Problem 2: plot_population_map
Write a function called plot_population_map that takes the merged data as a parameter and plots a map of Washington with each census tract colored by its population.
It is expected that there will be some missing census tracts.
Underneath the census tracts you should plot the map of Washington in #CCCCCC.
You should also include a legend to indicate what the colors mean (the legend does not need to contain the background grey color). You should save the plot in a file called washington_population_map.png.
Problem 3: plot_population_county_map
Write a function called plot_population_county_map that takes the merged data as a parameter and plots a map of Washington with each county colored by its population.
You'll need to aggregate the census tract data to be for each county instead.
It is expected that there will be some missing counties. Underneath the census tracts you should plot the map of Washington in #CCCCCC.
You should also include a legend to indicate what the colors mean (the legend does not need to contain the background grey color).
You should also include a legend to indicate what the colors mean. You should save the plot in a file called washington_county_population_map.png.
Problem 4: plot_food_access_by_county
For this problem, you will be writing a function called plot_food_access_by_county that takes the merged data as a parameter and makes various plots on the same figure showing information about food access and low income. This problem is more complicated than the others so we will provide a breakdown of the steps needed to solve it (some with provided code). Here is the final result that you should produce. 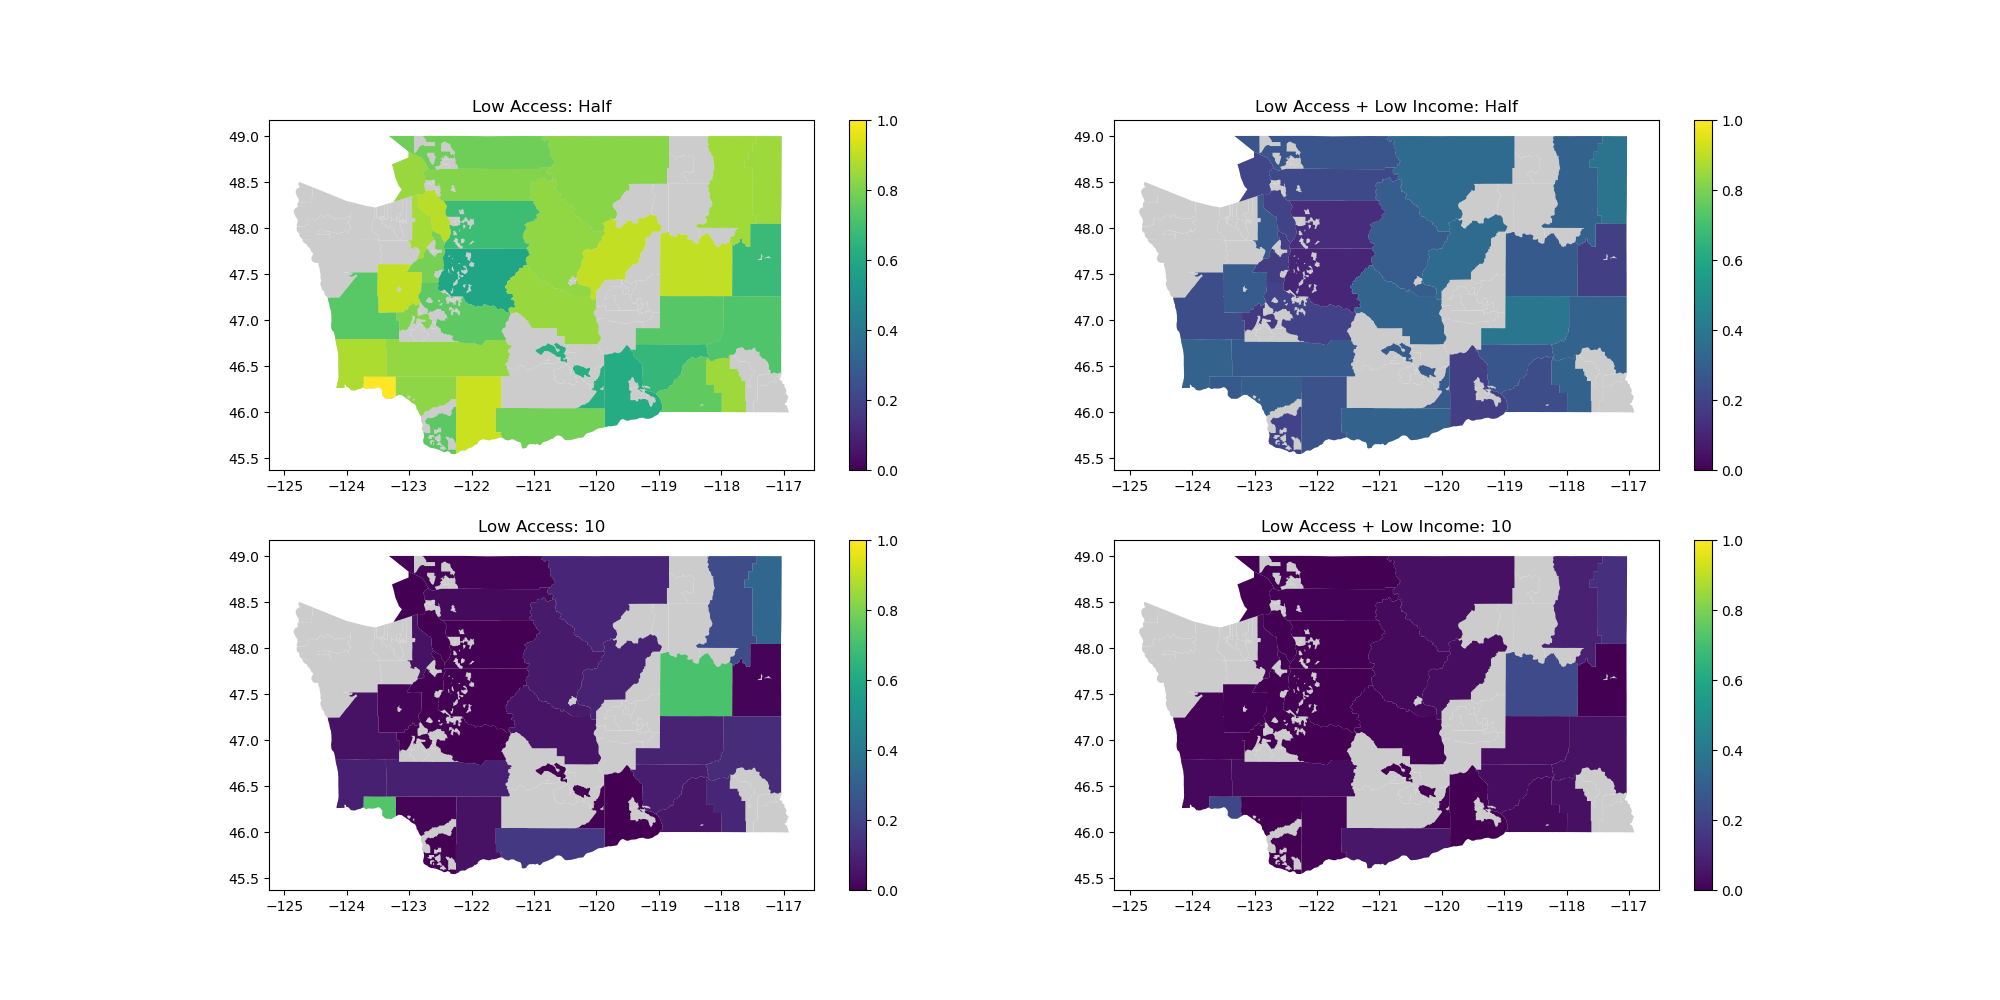
- To reduce some of the computation on unnecessary data, make a copy of the
GeoDataFramethat only has the columns'County','geometry','POP2010','lapophalf','lapop10','lalowihalf','lalowi10'. - Aggregate this dataset by county, summing up all of the numeric columns.
-
Compute columns named
'lapophalf_ratio','lapop10_ratio','lalowihalf_ratio','lalowi10_ratio'that store the ratio of people in that county that fall under each group respectively. These columns should be added to the local copy of the dataset.Clarifying Example
For example if we had a row for a county with the following data (shown as a dictionary for simplicity):
Then after this step, the row would have the data:{ 'County': 'Hunter County', 'geometry': ..., 'POP2010': 50, 'lapophalf', 15, 'lapop10': 3, 'lalowihalf': 7, 'lalowi10': 1 }{ 'County': 'Hunter County', 'geometry': ..., 'POP2010': 50, 'lapophalf', 15, 'lapop10': 3, 'lalowihalf': 7, 'lalowi10': 1, 'lapophalf_ratio', 0.30, 'lapop10_ratio': 0.06, 'lalowihalf_ratio': 0.14, 'lalowi10_ratio': 0.02 } - Create a figure with subplots. To do this, you will use the following line of code which will create a figure with 4 separate axes to draw subplots.
This line of code looks complicated, but all you need to know is the variablefig, [[ax1, ax2], [ax3, ax4]] = plt.subplots(2, figsize=(20, 10), ncols=2)figstores a reference to the whole figure (i.e. the picture) and each of the variables that start withaxstore a reference to one of sub-plot's axis. - Plot the map of Washington with the color
#CCCCCCas the background in each subplot and for each of the ratio columns you computed, you should plot it by calling theplotfunction on the dataset and changing the color by specifying the column you want. As before each plot should have legend. You'll need to specify theaxparameter and pass in the axis from the previous step to have it draw in the proper place. To keep things consistent, you should also specifyvminandvmaxto be 0 and 1 respectively so they all use the same scale. - Set the titles for each axis to match the picture shown above. For example, if you want to change the title of the first subplot you would write the line of code:
ax1.set_title('Foo') - Save the figure to a file by calling
fig.savefig('washington_county_food_access.png')
If these steps are done correctly, you should end up like the picture shown above.
Development Strategy:
It might help to start by making these on separate plots and then figuring out how to plot them on the same figure.
Problem 5: plot_low_access_tracts
In this problem, we will plot all of the census tracts that are considered low access. You should write a function called plot_low_access_tracts that takes the merged data as a parameter and saves the information described below in a file named washington_low_access.png. The definition for low access depends on whether or not the census tract is "urban". The data is set up so that each census tract is either "urban" or "rural".
- Urban: If the census tract is "urban", the distance of interest is half a mile from a food source. The threshold for low access in an urban census tract is at least 500 people or at least 33% of the people in the census tract being more than half a mile from a food source. An urban census tract that satisfies either of these conditions is considered low access.
- Rural (i.e. non-urban): If the census tract is "rural", the distance of interest is 10 miles from a food source. The threshold for low access in a rural census tract is at least 500 people or at least 33% of the people in the census tract being more than 10 miles from a food source. A rural census tract that satisfies either of these conditions is considered low access.
In this problem, you should compute all of the census tracts that match the definition above (depending on if it is urban or not). We will then make a plot in layers (all on the same axis) to highlight the census tracts that have low food access. Because we are plotting on the same set of axes, a new plot will "draw over" the old one which will allow us to highlight exactly as we want. You should plot the data in the following order.
- First, plot all of the census tracts. You should pass in
color='#EEEEEE'when plotting to make the census tracts a light gray. - Second, plot all of the census tracts that we have food access data for. You should pass in
color='#AAAAAA'when plotting to make these census tracts a dark gray. - Third, plot all of the census tracts that your computation has considered "low access". You should not pass in a color for this plot so that the low access census tracts are highlighted blue (blue is the default color).
For this problem, you are NOT allowed to use the 'LATracts_half' or 'LATracts10' columns since we are trying to compute something similar to these (although not exactly the same).
Problem 6: Reflection
Just like with take-home assessment 3, we want you to think over the analysis you just did in the previous problems to think about what impact that can have in the real world. For the following reflection questions consider the accuracy of data collected, and how it's used as a public dataset. All of your answers should be complete sentences and show thoughtful responses. "No" or "I don't know" or any response like that are not valid responses for any questions. There is not one particularly right answer to these questions, instead, we are looking to see you use your critical thinking and justify your answers! Be specific in your answers, and specifically relate your point back to something you did in one of the previous problems.
- What is one possible way that government officials could use one of your visualizations from Problem 4 or 5 to shape public policy on how to improve food access?
- What is a possible limitation or concern with using the visualization you discussed in the last problem for the purpose you discussed in the last problem?
Turn your answers to these question in by writing them in hw5-written.txt and submitting them on Ed. Each question should be answered in about 2-3 sentences.
Evaluation
Your submission will be evaluated on the following dimensions
- Your solution correctly implements the described behaviors. You will have access to some tests when you turn in your assignment, but some tests will 'hidden' in that they will show you whether you pass/fail the test, but it won't show the exact call being made. The hidden tests will be things described in the spec so they shouldn't be a surprise, but an important part of this class is learning how to test your own solution to be very sure it's correct. If you find yourself failing some of these hidden tests, a good sign is that you need to write some more of your own tests to test more cases. All behavior we test is completely described by the problem specification or shown in an example. Do note, the tests for this assignment take much longer to run (our solution takes about 30 seconds to run).
- When we run your code, it should produce no errors or warnings.
- You should remove any debug print statements in your program. Some students report Ed crashing when they try to print the whole dataset; remove those extra print statements to prevent excessive output.
- Your code meets our style requirements:
- All code files submitted pass
flake8. - Your program uses the main method pattern and the main method calls all the functions you implemented in this assignment.
- Every function written is commented, in your own words, using a doc-string format that describes its behavior, parameters, returns, and highlights any special cases.
- There is a doc-string at the top of each code file you write with your name, section, and a brief description of what that program does.
- Any expectations in the subsections listed above are met.
- All code files submitted pass
A note on allowed material
A lot of students have been asking questions like "Can I use this method or can I use this language feature in this class?". The general answer to this question is it depends on what you want to use, what the problem is asking you to do and if there are any restrictions that problem places on your solution.
There is no automatic deduction for using some advanced feature or using material that we have not covered in class yet, but if it violates the restrictions of the assignment, it is possible you will lose points. It's not possible for us to list out every possible thing you can't use on the assignment, but we can say for sure that you are safe to use anything we have covered in class so far as long as it meets what the specification asks and you are appropriately using it as we showed in class.
For example, some things that are probably okay to use even though we didn't cover them:
- Using the
updatemethod on thesetclass even though I didn't show it in lecture. It was clear we talked about sets and that you are allowed to use them on future assignments and if you found a method on them that does what you need, it's probably fine as long as it isn't violating some explicit restriction on that assignment. - Using something like a ternary operator in Python. This doesn't make a problem any easier, it's just syntax.
For example, some things that are probably not okay to use:
- Importing some random library that can solve the problem we ask you to solve in one line.
- If the problem says "don't use a loop" to solve it, it would not be appropriate to use some advanced programming concept like recursion to "get around" that restriction.
These are not allowed because they might make the problem trivially easy or violate what the learning objective of the problem is.
You should think about what the spec is asking you to do and as long as you are meeting those requirements, we will award credit. If you are concerned that an advanced feature you want to use falls in that second category above and might cost you points, then you should just not use it! These problems are designed to be solvable with the material we have learned so far so it's entirely not necessary to go look up a bunch of advanced material to solve them.
tl;dr; We will not be answering every question of "Can I use X" or "Will I lose points if I use Y" because the general answer is "You are not forbidden from using anything as long as it meets the spec requirements. If you're unsure if it violates a spec restriction, don't use it and just stick to what we learned before the assignment was released."
Submission
This assignment is due by Thursday, February 25 at .
You should submit your finished
hw5_main.py,
hw5-written.txt
on Ed.
You may submit your assignment as many times as you want until the deadline for the initial submission. Recall on Ed, you submit by pressing the "Mark" button. Work after the due date will not be accepted for an initial submission. Please see the syllabus for the policies on initial submissions and resubmissions.