VS Code on attu
Visual Studio Code is a
popular editor that can connect to attu over SSH so you can
edit and build your CSE 333 code with a graphical interface
while the files and tools live on the CSE Linux machines. This guide
covers connecting VS Code to attu over Remote - SSH. It then
shows how to set up VS Code's graphical debugger, which is optional.
attu
over Remote - SSH. We do not support doing this on your own
machine. You are still responsible for making sure your code compiles and
runs on the CSE lab machines before submitting.
attu. Make sure you can locate your
cse333-26su-hw-<netid> folder; we open it in a later
step. (If you only want to edit or compile other files on
attu, you don't need to clone a repo first.)
Connect VS Code to attu (Remote - SSH)
- Download and install VS Code from code.visualstudio.com/Download.
- Open the Extensions view (the icon that looks like
three blocks with a fourth being added, or Ctrl+Shift+X),
search for Remote - SSH
(
ms-vscode-remote.remote-ssh), and click Install.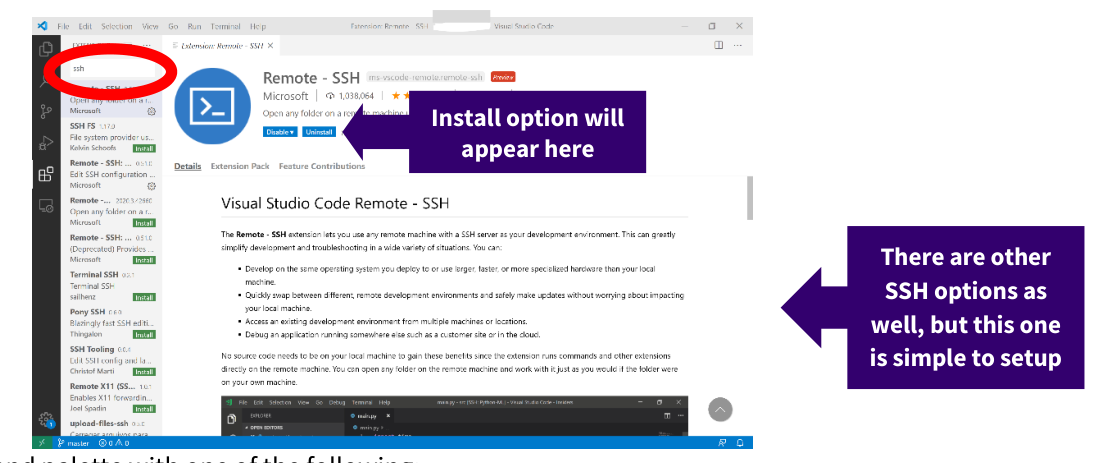
Search for Remote - SSH and install it. - Open the Command Palette (F1 or
Ctrl+Shift+P / Cmd+Shift+P), type
Connect to Host, and choose Remote-SSH: Connect to Host… (it may not be first in the list).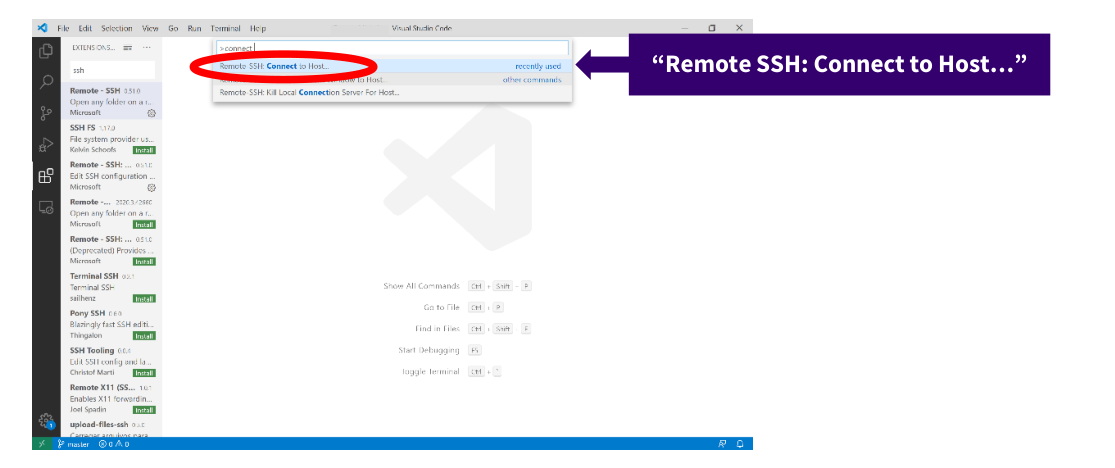
Pick Remote-SSH: Connect to Host…. - Enter
<netid>@attu.cs.washington.edu(substitute your UW NetID) and press Enter. If prompted to choose a platform, pick Linux.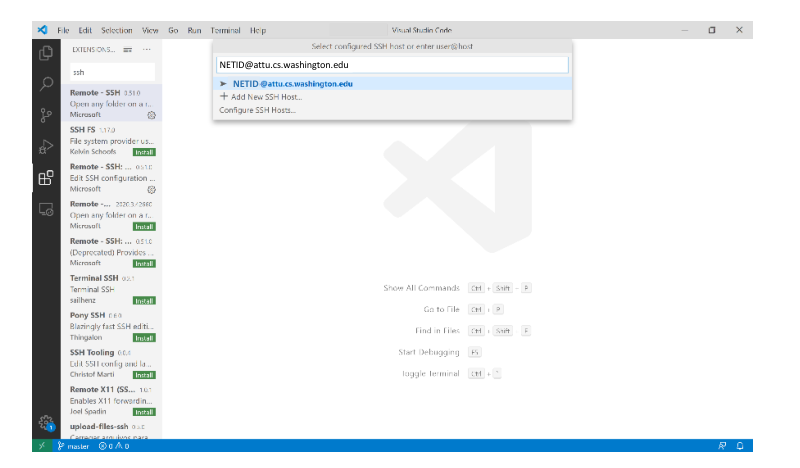
Connect to <netid>@attu.cs.washington.edu. - Enter your UW password when prompted and press
Enter.
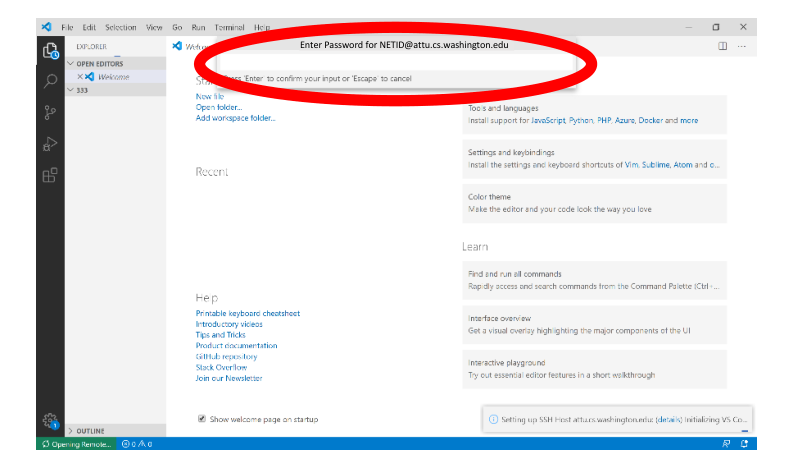
Enter your password to authenticate. - Click Open Folder and select the folder you
want to work in (for the course project, choose your
cse333-26su-hw-<netid>folder). Folders are nested, so you can click into them just likecdonattu.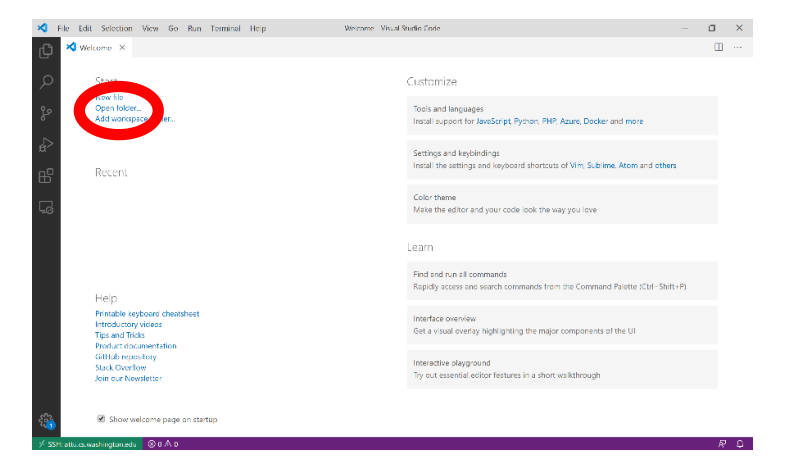
Click Open Folder… 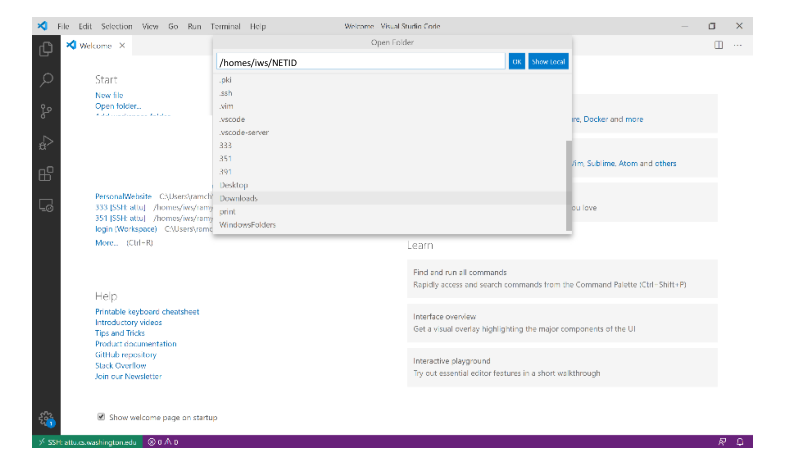
…then select your working folder. - You're connected! The Explorer shows the contents of
the folder you opened, and the bottom-left corner shows
SSH: attu.cs.washington.edu.
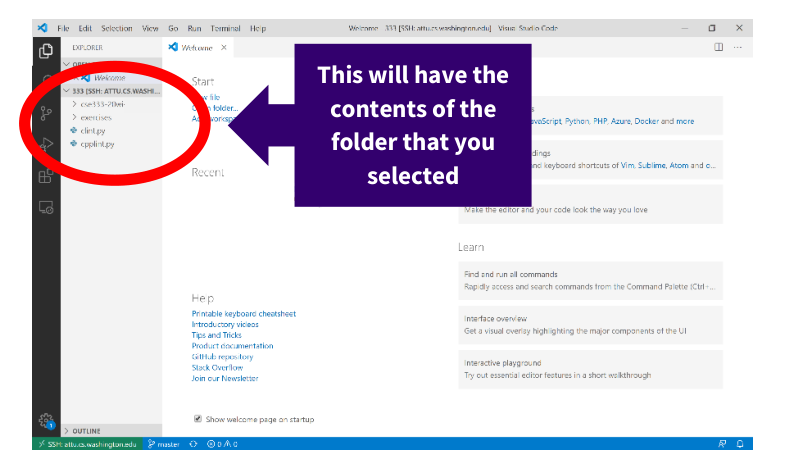
The Explorer now shows your files on attu.
attu and avoids that problem.
Remote Debugging (optional)
attu. This section is optional. Follow it only if
you want to step through your code with VS Code's graphical debugger.
You can also just use GDB in the terminal.
Install the C/C++ extension on attu
In the remote window (still connected to attu),
open the Extensions view again and install C/C++
(ms-vscode.cpptools). This extension provides the
debugger.
gdb.
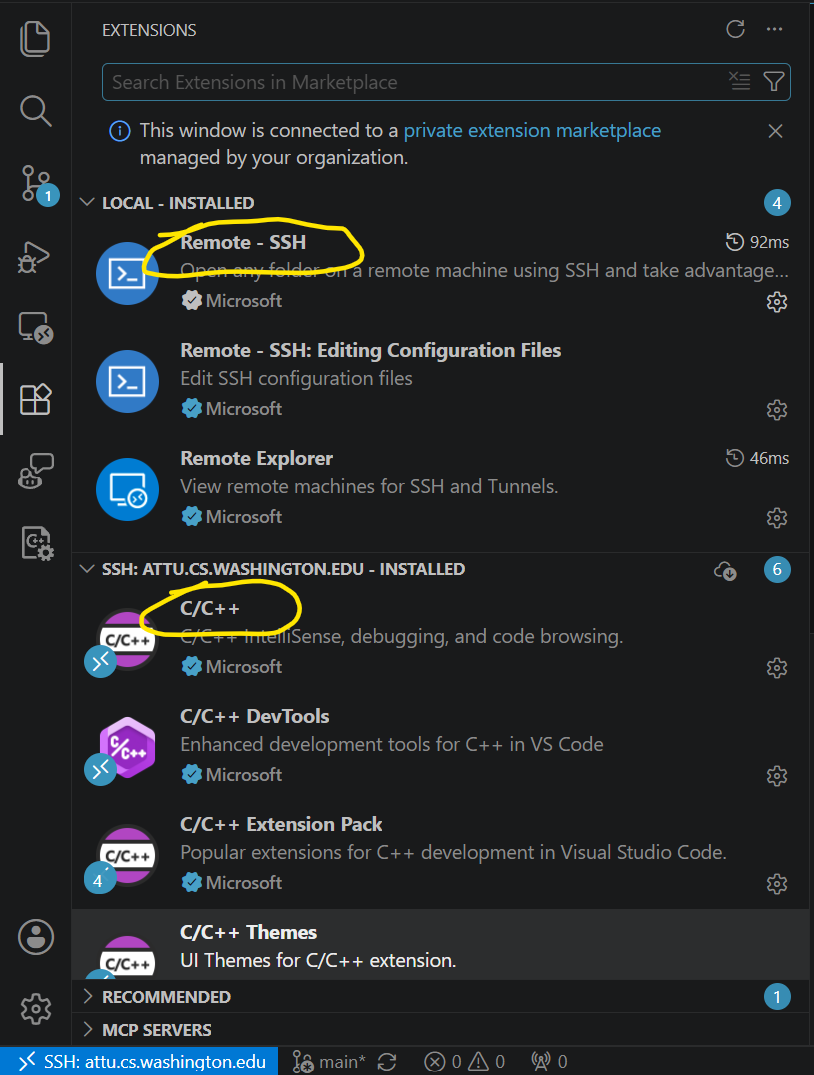
Run the debugger
Debug configs live in .vscode/, and we add one per
homework as it's released.
- Set a breakpoint by clicking the gutter left of a line number.
- Open Run and Debug (Ctrl+Shift+D), pick a config from the dropdown, press F5.
- VS Code builds first, then stops at your breakpoints. Step with F10 / F11 / Shift+F11, continue with F5.
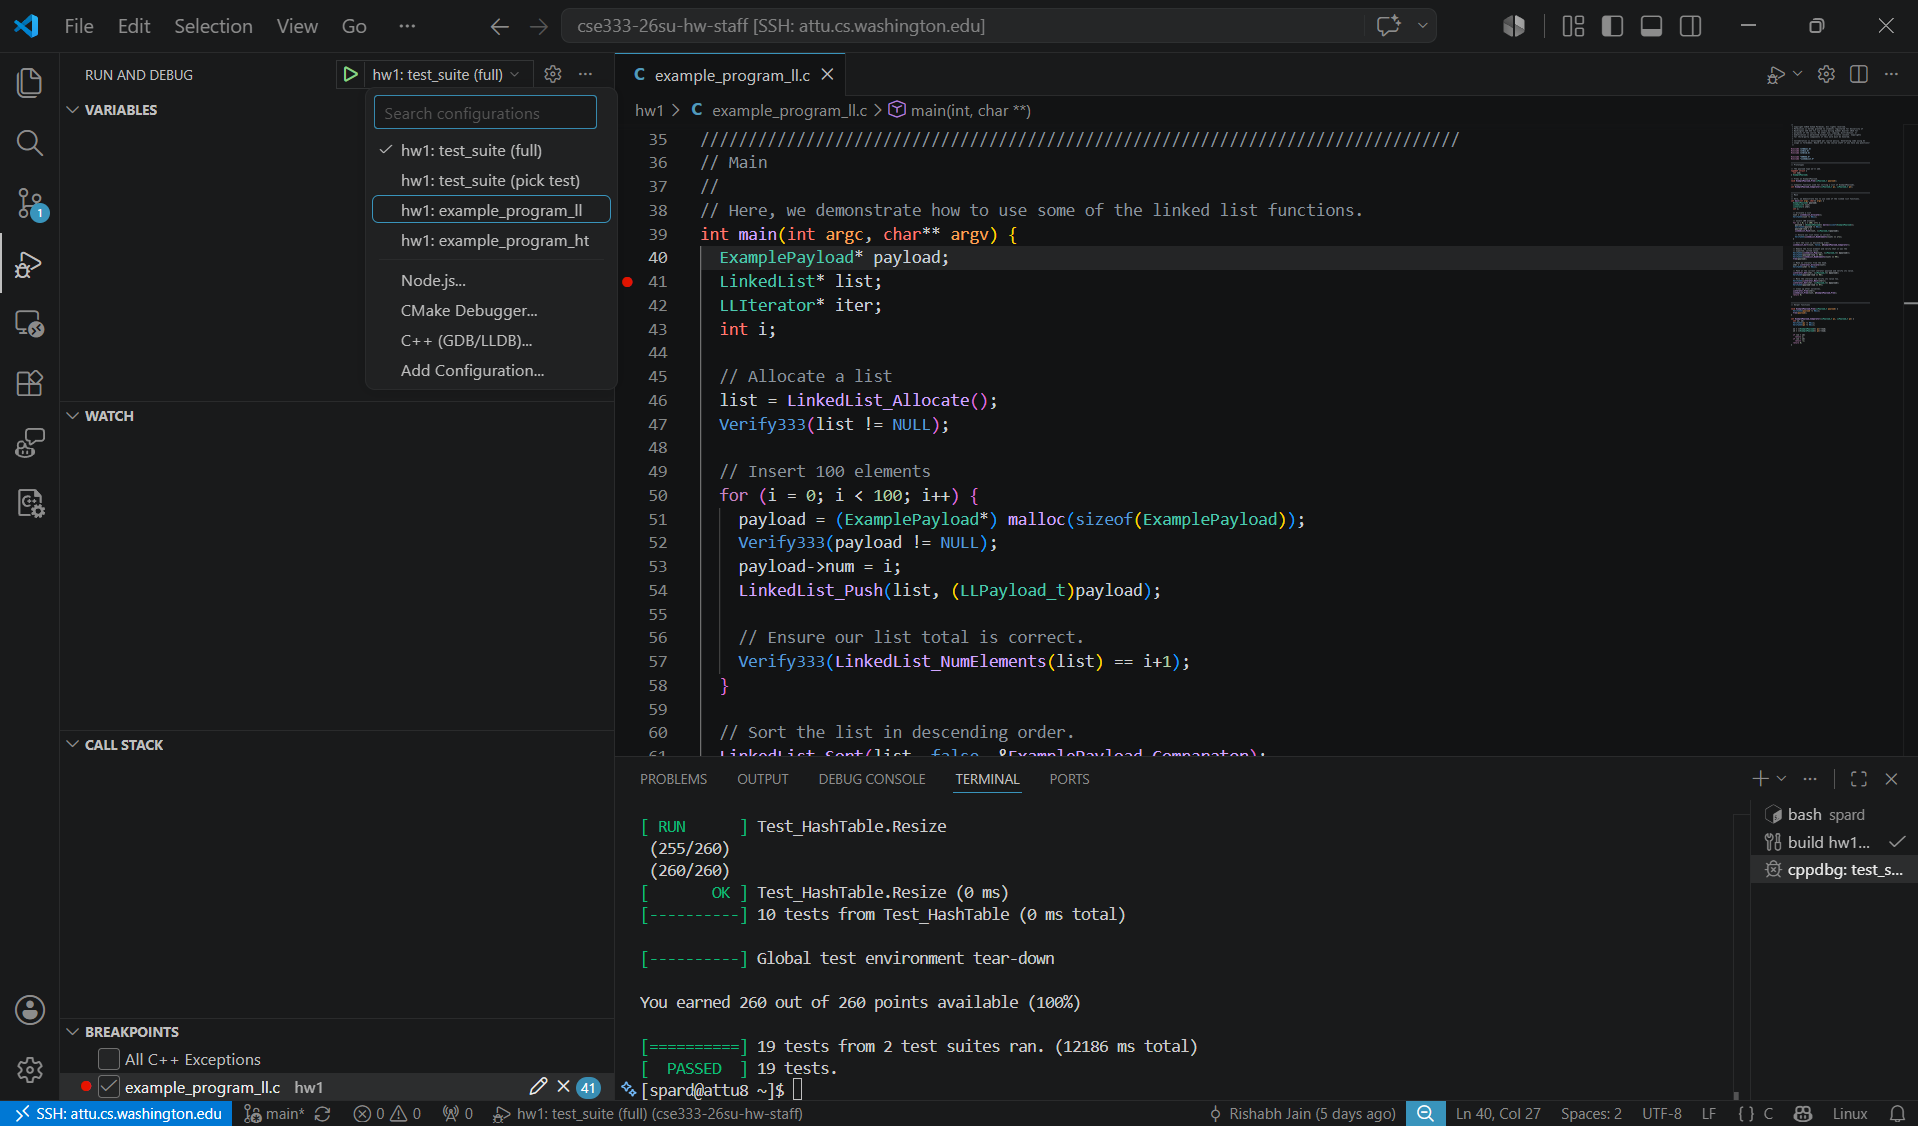
For test suites, the "pick test" config prompts for a GoogleTest
filter, e.g., Test_HashTable.AllocFree or
Test_LinkedList.*.
Writing your own config
Add an entry to configurations in
launch.json:
{
  "name": "hw1: example_program_ll",
  "type": "cppdbg",
  "request": "launch",
  "program": "${workspaceFolder}/hw1/example_program_ll",
  "args": [],
  "cwd": "${workspaceFolder}/hw1",
  "console": "integratedTerminal",
  "MIMode": "gdb",
  "preLaunchTask": "build hw1",
  "setupCommands": [
    { "text": "-enable-pretty-printing", "ignoreFailures": true }
  ]
}program: the binary to debug.args: command-line arguments, e.g.,["--gtest_filter=Test_LinkedList.Pop"].preLaunchTask: must match alabelintasks.json.
To be prompted at launch, use an ${input:...}
variable and define it in a top-level inputs array:
"args": ["--gtest_filter=${input:gtestFilter}"],
"inputs": [
  { "id": "gtestFilter", "type": "promptString", "default": "*" }
]
If you run into trouble, post on the Ed discussion board. Some of the staff have set this up before and can help you troubleshoot.