CSE 163, Winter 2021: Assessment 3: Data Analysis
Overview
In this assignment, you will apply what you've learned so far in a more extensive "real-world" dataset using more powerful features of the Pandas library. As in HW2, this dataset is provided in CSV format. We have cleaned up the data some, but you will need to handle more edge cases common to real-world datasets, including null cells to represent unknown information.
Note that there is no graded testing dimension for this assignment, but rather a Writeup dimension. We still recommend writing tests to verify the correctness of the methods that you write in Part 0, but it will be difficult to write tests for Part 1 and 2. We've provided tips in those sections to help you gain confidence about the correctness of your solutions without writing formal test functions!
This assignment is supposed to introduce you to various parts of the data science process involving being able to answer questions about your data, how to visualize your data, and how to use your data to make predictions for new data. To help prepare for your final project, this assignment has been designed to be wide in scope so you can get practice with many different aspects of data analysis. While this assignment might look large because there are many parts, each individual part is relatively small.
Learning Objectives
This assessment will show students have mastery in the following skills:
- Work with basic Python data structures.
- Use Pandas as the primary tool to process structured data in Python with CSV files, exploring more powerful library features to analyze time series data.
- Handle edge cases appropriately, including addressing missing values/data.
- Practice user-friendly error-handling.
- Use Seaborn to make simple plots to investigate a specific phenomenon.
- Read plotting library documentation and use example plotting code to figure out how to create more complex Seaborn plots.
- Train a machine learning model and use it to make a prediction about the future using the scikit-learn library.
Expectations
Here are some baseline expectations we expect you to meet:
Follow the course collaboration policies
Files
hw3-nces-ed-attainment.csv: A CSV file that contains data from the National Center for Education Statistics. This is described in more detail below.hw3.py: The file for you to put solutions to Part 0, Part 1, and Part 2. You are required to add a main method that parses the provided dataset and calls all of the functions you are to write for this assessment.hw3-written.txt: The file for you to put your answers to the questions in Part 3.cse163_utils.py: Provides utility functions for this assignment. You probably don't need to use anything inside this file except importing it if you have a Mac (see note below)
Developing Locally on Mac
There is a weird interaction with matplotlib and macOS that makes plots sometimes work. You don't need to understand why this error or how to fix it. We have a fix that runs inside cse163_utils.py that will fix it by importing it as the first line in hw3.py. This will cause a flake8 error for unused imports that you can fix by removing it right before you actually submit on EdStem.
Data
The dataset you will be processing comes from the National Center for Education Statistics. You can find the original dataset here. We have cleaned it a bit to make it easier to process in the context of this assignment. You must use our provided CSV file in this assignment.
The original dataset is titled: Percentage of persons 25 to 29 years old with selected levels of educational attainment, by race/ethnicity and sex: Selected years, 1920 through 2018. The cleaned version you will be working with has columns for Year, Sex, Educational Attainment, and race/ethnicity categories considered in the dataset. Note that not all columns will have data starting at 1920.
Our provided hw3-nces-ed-attainment.csv looks like: (⋮ represents omitted rows):
| Year | Sex | Min degree | Total | White | Black | Hispanic | Asian | Pacific Islander | American Indian/Alaska Native | Two or more races |
|---|---|---|---|---|---|---|---|---|---|---|
| 1920 | A | high school | --- | 22.0 | 6.3 | --- | --- | --- | --- | --- |
| 1940 | A | high school | 38.1 | 41.2 | 12.3 | --- | --- | --- | --- | --- |
| ⋮ | ⋮ | ⋮ | ⋮ | ⋮ | ⋮ | ⋮ | ⋮ | ⋮ | ⋮ | ⋮ |
| 2018 | F | master's | 10.7 | 12.6 | 6.2 | 3.8 | 29.9 | --- | --- | --- |
Column Descriptions
- Year: The year this row represents. Note there may be more than one row for the same year to show the percent breakdowns by sex.
- Sex: The sex of the students this row pertains to, one of "F" for female, "M" for male, or "A" for all students.
- Min degree: The degree this row pertains to. One of "high school", "associate's", "bachelor's", or "master's".
- Total: The total percent of students of the specified gender to reach at least the minimum level of educational attainment in this year.
- White / Black / Hispanic / Asian / Pacific Islander / American Indian or Alaska Native / Two or more races: The percent of students of this race and the specified gender to reach at least the minimum level of educational attainment in this year.
Interactive Development
When using data science libraries like pandas, seaborn, or scikit-learn it's extremely helpful to actually interact with the tools your using so you can have a better idea about the shape of your data. The preferred practice by people in industry is to use a Jupyter Notebook, like we have been in lecture, to play around with the dataset to help figure out how to answer the questions you want to answer. This is incredibly helpful when you're first learning a tool as you can actually experiment and get real-time feedback if the code you wrote does what you want.
We recommend that you try figuring out how to solve these problems in a Jupyter Notebook so you can actually interact with the data. We have made a Playground Jupyter Notebook for you that has the data uploaded. At the top-right of this page in Ed is a "Fork" button (looks like a fork in the road). This will make your own copy of this Notebook so you can run the code and experiment with anything there!
Part 0: Statistical Functions with Pandas
In this part of the assessment, you will write code to perform various analytical operations on data parsed from a file.
Part 0 Expectations
- All functions for this part of the assignment should be written in
hw3.py. - For this part of the assignment, you may import and use the
mathandpandasmodules, but you may not use any other imports to solve these problems. - For all of the problems below, you should not use ANY loops or list/dictionary comprehensions. The goal of this part of the assignment is to use
pandasas a tool to help answer questions about your dataset.
Problem 0: Parse data
In your main method, parse the data from the CSV file using pandas. Note that the file uses '---' as the entry to represent missing data. You do NOT need to anything fancy like set a datetime index.
The function to read a CSV file in pandas takes a parameter called na_values that takes a str to specify which values are NaN values in the file. It will replace all occurrences of those characters with NaN. You should specify this parameter to make sure the data parses correctly.
Problem 1: compare_bachelors_1980
What were the percentages for women vs. men having earned a Bachelor's Degree in 1980? Call this method compare_bachelors_1980
and return the result as a DataFrame with a row for men and a row for women with the columns "Sex" and "Total".
For example, assuming we have parsed hw3-nces-ed-attainment.csv and stored it in a variable called data, compare_bachelors_1980(data) will return the following (order of rows does not matter):
| Sex | Total | |
|---|---|---|
| 112 | M | 24.0 |
| 180 | F | 21.0 |
The index of the DataFrame is shown as the left-most column above.
Problem 2: top_2_2000s
What were the two most commonly awarded levels of educational attainment awarded between 2000-2010 (inclusive) for a given sex? Use the mean percent over the years to compare the education levels in order to find the two largest. Take a sex parameter so the client can specify 'M', 'F', or 'A' for evaluating. If a call does not specify the sex to evaluate, you should evaluate the top two levels for all sexes (sex = ‘A’). Call this method top_2_2000s and return a Series with the top two values (the index should be the degree names and the values should be the percent).
For example, assuming we have parsed hw3-nces-ed-attainment.csv and stored it in a variable called data, then top_2_2000s(data, 'A') will return the following Series (shows the index on the left, then the value on the right)
high school    87.557143
associate's    38.757143
Hint: The Series class also has a method nlargest that behaves similarly to the one for the DataFrame, but does not take a column parameter (as Series objects don't have columns).
Our assert_equals only checks that floating point numbers are within 0.001 of each other, so your floats do not have to match exactly.
Optional: Why 0.001?
Whenever you work with floating point numbers, it is very likely you will run into imprecision of floating point arithmetic. You have probably run into this with your every day calculator! If you take 1, divide by 3, and then multiply by 3 again you could get something like 0.99999999 instead of 1 like you would expect.
This is due to the fact that there is only a finite number of bits to represent floats so we will at some point lose some precision. Below, we show some example Python expressions that give imprecise results.
Because of this, you can never safely check if one float is == to another. Instead, we only check that the numbers match within some small delta that is permissible by the application. We kind of arbitrarily chose 0.001, and if you need really high accuracy you would want to only allow for smaller deviations, but equality is never guaranteed.
print(0.1 + 0.2)
    # 0.30000000000000004

    print((1.1 + 1.2) - 1.3)
    # 0.9999999999999998

    print(1.1 + (1.2 - 1.3))
    # 1.0
Part 1: Plotting with Seaborn
Next, you will write functions to generate data visualizations using the Seaborn library. For each of the functions save the generated graph with the specified name. These methods should only take the pandas DataFrame as a parameter. For each problem, only drop rows that have missing data in the columns that are necessary for plotting that problem (do not drop any additional rows).
Part 1 Expectations
- All functions for this part of the assignment should be written in
hw3.py. Each function should produce an image with the exact name specified.- When submitting on Ed, you DO NOT need to specify the absolute path (e.g.
/home/FILE_NAME) for the output file name. If you specify absolute paths for this assignment your code will not pass the tests! - You will want to pass the parameter value
bbox_inches='tight'to the call tosavefigto make sure edges of the image look correct! - Remember that you should make sure your produced plots match the example ones in the spec before submitting.
- When submitting on Ed, you DO NOT need to specify the absolute path (e.g.
- For this part of the assignment, you may import the
math,pandas,seaborn, andmatplotlibmodules, but you may not use any other imports to solve these problems. - For all of the problems below, you should not use ANY loops or list/dictionary comprehensions.
- Don't forget a call to
sns.set()! - Do not use any of the other
seabornplotting functions for this assignment besides the ones we showed in the reference box below. For example, even though the documentation forrelplotlinks to another method calledscatterplot, you should not callscatterplot. Instead userelplot(..., kind='scatter')like we showed in class. This is not an issue of stylistic preference, but these functions behave slightly differently. If you use these other functions, your output might look different than the expected picture. You don't yet have the tools necessary to usescatterplotcorrectly! We will see these extra tools later in the quarter.
Part 1 Development Strategy
As stated in the Overview, it is difficult to write tests for functions that create graphs. Instead, you can check the graphs manually. Some ways to gain confidence in your generated graph:- Print your filtered DataFrame before creating the graph to ensure you’re selecting the correct data.
- Call the DataFrame
describe()method to see some statistical information about the data you've selected. This can sometimes help you determine what to expect in your generated graph. - Re-read the problem statement to make sure your generated graph is answering the correct question.
- Compare the data on your graph to the values in hw3-nces-ed-attainment.csv. For example, for problem 0 you could check that the generated line goes through the point
(2005, 28.8)because of this row in the dataset:2005,A,bachelor's,28.8,34.5,17.6,11.2,62.1,17.0,16.4,28.0
Seaborn Reference
Of all the libraries we will learn this quarter, Seaborn is by far the best documented. We want to give you experience reading real world documentation to learn how to use a library so we will not be providing a specialized cheat-sheet for this assignment. What we will do to make sure you don't have to look through pages and pages of documentation is link you to some key pages you might find helpful for this assignment; you do not have to use every page we link, so part of the challenge here is figuring out which of these pages you need. As a data scientist, a huge part of solving a problem is learning how to skim lots of documentation for a tool that you might be able to leverage to solve your problem.
We recommend to read the documentation in the following order:
- Start by skimming the examples to see the possible things the function can do. Don't spend too much time trying to figure out what the code is doing yet, but you can quickly look at it to see how much work is involved.
- Then read the top paragraph(s) that give a general overview of what the function does.
- Now that you have a better idea of what the function is doing, go look back at the examples and look at the code much more carefully. When you see an example like the one you want to generate, look carefully at the parameters it passes and go check the parameter list near the top for documentation on those parameters.
- It sometimes (but not always), helps to skim the other parameters in the list just so you have an idea what this function is capable of doing
As a reminder, you will want to refer to the lecture/section material to see the additional matplotlib calls you might need in order to display/save the plots. You'll also need to call the set function on seaborn to get everything set up initially.
Here are the seaborn functions you might need for this assignment:
- Bar/Violin Plot (
catplot) - Plot a Discrete Distribution (
distplot) or Continuous Distribution (kdeplot) - Scatter/Line Plot (
relplot) - Linear Regression Plot (
regplot) - Compare Two Variables (
jointplot) - Heatmap (
heatmap)
Make sure you read the bullet point at the top of the page warning you to only use these functions!
Problem 0: Line Chart
Plot the total percentages of all people of bachelor's degree as minimal completion with a line chart over years. To select all people, you should filter to rows where sex is 'A'. Label the x-axis "Year", the y-axis "Percentage", and title the plot "Percentage Earning Bachelor's over Time". Name your method line_plot_bachelors and save your generated graph as line_plot_bachelors.png.
Your result should look like the following: 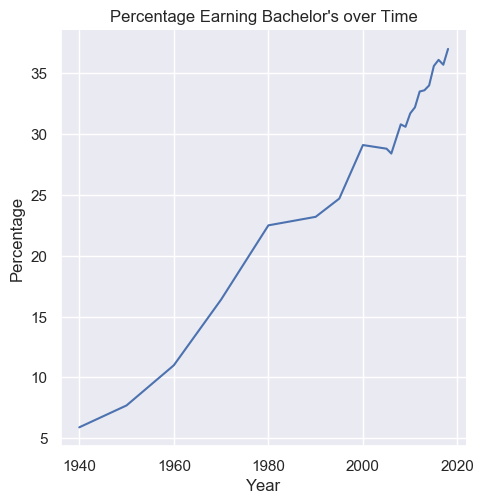
Problem 1: Bar Chart
Plot the total percentages of women, men, and total people with a minimum education of high school degrees in the year 2009. Label the x-axis "Sex", the y-axis "Percentage", and title the plot "Percentage Completed High School by Sex". Name your method bar_chart_high_school and save your generated graph as bar_chart_high_school.png.
Do you think this bar chart is an effective data visualization? Include your reasoning in hw3-written.txt as described in Part 3.
Your result should look like the following: 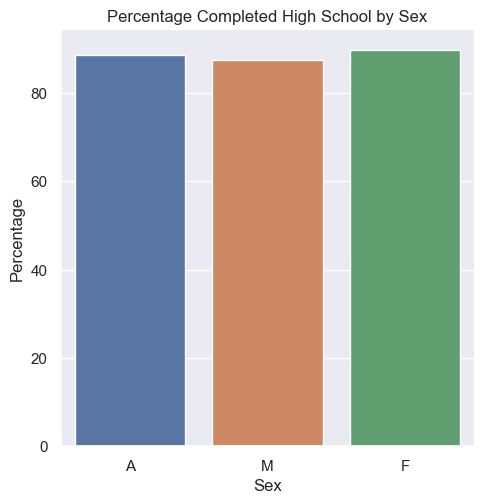
Problem 2: Custom Plot
Plot the results of how the percent of Hispanic individuals with degrees has changed between 1990 and 2010 (inclusive) for high school and bachelor's degrees with a chart of your choice. Make sure you label your axes with descriptive names and give a title to the graph. Name your method plot_hispanic_min_degree and save your visualization as plot_hispanic_min_degree.png.
Include a justification of your choice of data visualization in hw3-written.txt, as described in Part 3.
Part 2: Machine Learning using scikit-learn
Now you will be making a simple machine learning model for the provided education data using scikit-learn. Complete this in a function called fit_and_predict_degrees that takes the data as a parameter and returns the test mean squared error as a float. This may sound like a lot, so we've broken it down into steps for you:
- Filter the
DataFrameto only include the columns for year, degree type, sex, and total. - Do the following pre-processing: Drop rows that have missing data for just the columns we are using; do not drop any additional rows. Convert string values to their one-hot encoding. Split the columns as needed into input features and labels.
- Randomly split the dataset into 80% for training and 20% for testing.
- Train a decision tree regressor model to take in year, degree type, and sex to predict the percent of individuals of the specified sex to achieve that degree type in the specified year.
- Use your model to predict on the test set. Calculate the accuracy of your predictions using the mean squared error of the test dataset.
You do not need to anything fancy like find the optimal settings for parameters to maximize performance. We just want you to start simple and train a model from scratch! The reference below has all the methods you will need for this section!
scikit-learn Reference
You can find our reference sheet for machine learning with scikit-learn at the same Playground workspace mentioned earlier in "Interactive Development" box. To navigate to the scikit-learn Reference, click on the "Files" button on the left side of the Playground screen. This reference sheet has information about general scikit-learn calls that are helpful, as well as how to train the tree models we talked about in class. At the top-right of this page in Ed is a "Fork" button (looks like a fork in the road). This will make your own copy of this Workspace so you can run the code and experiment with anything there!
Part 2 Development Strategy
Like in Part 1, it can be difficult to write tests for this section. Machine Learning is all about uncertainty, and it's often difficult to write tests to know what is right. This requires diligence and making sure you are very careful with the method calls you make. To help you with this, we've provided some alternative ways to gain confidence in your result:
- Print your test y values and your predictions to compare them manually. They won't be exactly the same, but you should notice that they have some correlation. For example, I might be concerned if my test y values were [2, 755, …] and my predicted values were [1022, 5...] because they seem to not correlate at all.
- Calculate your mean squared error on your training data as well as your test data. The error should be lower on your training data than on your testing data.
- To ensure full credit for this section of the assignment, you're urged to check back on previous examples from class to ensure your code contains all the necessary steps to train your model as described.
Optional: ML for Time Series
Since this is technically time series data, we should point out that our method for assessing the model's accuracy is slightly wrong (but we will keep it simple for our HW). When working with time series, it is common to use the last rows for your test set rather than random sampling (assuming your data is sorted chronologically). The reason is when working with time series data in machine learning, it's common that our goal is to make a model to help predict the future. By randomly sampling a test set, we are assessing the model on its ability to predict in the past! This is because it might have trained on rows that came after some rows in the test set chronologically. However, this is not a task we particularly care that the model does well at. Instead, by using the last section of the dataset (the most recent in terms of time), we are now assessing its ability to predict into the future from the perspective of its training set.
Even though it's not the best approach to randomly sample here, we ask you to do it anyways. This is because random sampling is the most common method for all other data types.
Part 3: Written Responses
Review the source of the dataset here. For the following reflection questions consider the accuracy of data collected, and how it's used as a public dataset (e.g. presentation of data, publishing in media, etc.). All of your answers should be complete sentences and show thoughtful responses. "No" or "I don't know" or any response like that are not valid responses for any questions. There is not one particularly right answer to these questions, instead, we are looking to see you use your critical thinking and justify your answers!
- Plotting questions
- Do you think the bar chart from part 1b is an effective data visualization? Explain in 1-2 sentences why or why not.
- Why did you choose the type of plot that you did in part 1c? Explain in a few sentences why you chose this type of plot.
- Datasets can be biased. Bias in data means it might be skewed away from or portray a wrong picture of reality. The data might contain inaccuracies or the methods used to collect the data may have been flawed. Describe a possible bias present in this dataset and why it might have occurred. Your answer should be about 2 or 3 sentences long.
-
Context: Later in the quarter we will talk about ethics and data science. This question is supposed to be a warm-up to get you thinking about our responsibilities having this power to process data. We are not trying to train to misuse your powers for evil here! Most misuses of data analysis that result in ethical concerns happen unintentionally. As preparation to understand these unintentional consequences, we thought it would be a good exercise to think about a theoretical world where you would willingly try to misuse data.
Congrats! You just got an internship at Evil Corp! Your first task is to come up with an application or analysis that uses this dataset to do something unethical or nefarious. Describe a way that this dataset could be misused in some application or an analysis (potentially using the bias you identified for the last question). Regardless of what nefarious act you choose, evil still has rules: You need to justify why using the data in this is a misuse and why a regular person who is not evil (like you in the real world outside of this problem) would think using the data in this way would be wrong. There are no right answers here of what defines something as unethical, this is why you need to justify your answer! Your response should be 2 to 4 sentences long. For additional inspiration, you can refer back to the When not to use ML reading from Lesson 12.
Turn your answers to these question in by writing them in hw3-written.txt and submitting them on Ed
Evaluation
Your submission will be evaluated on the following dimensions:
- Your solution correctly implements the described behaviors. All behavior we test is completely described by the problem specification or shown in an example.
- No method should modify its input parameters.
- You solution file
hw3.pyuses the main method structure we've shown on previous assignments.- Your main method in
hw3.pymust call every one of the methods you implemented in this assignment. There are no requirements on the format of the output, besides that it should save the files for Part 1 with the proper names specified in Part 1.
- Your main method in
- We can run your
hw3.pywithout it crashing or causing any errors or warnings. - Your code meets our style requirements:
- When we run your code, it should produce no errors or warnings.
- All files submitted pass
flake8 - All program files should be written with good programming style. This means your code should satisfy the requirements within the CSE 163 Code Quality Guide.
- Any expectations on this page or the sub-pages for the assignment are met as well as all requirements for each of the problems are met.
Evaluation
Make sure you carefully read the bullets above as they may or may not change from assignment to assignment!
A note on allowed material
A lot of students have been asking questions like "Can I use this method or can I use this language feature in this class?". The general answer to this question is it depends on what you want to use, what the problem is asking you to do and if there are any restrictions that problem places on your solution.
There is no automatic deduction for using some advanced feature or using material that we have not covered in class yet, but if it violates the restrictions of the assignment, it is possible you will lose points. It's not possible for us to list out every possible thing you can't use on the assignment, but we can say for sure that you are safe to use anything we have covered in class so far as long as it meets what the specification asks and you are appropriately using it as we showed in class.
For example, some things that are probably okay to use even though we didn't cover them:
- Using the
updatemethod on thesetclass even though I didn't show it in lecture. It was clear we talked about sets and that you are allowed to use them on future assignments and if you found a method on them that does what you need, it's probably fine as long as it isn't violating some explicit restriction on that assignment. - Using something like a ternary operator in Python. This doesn't make a problem any easier, it's just syntax.
For example, some things that are probably not okay to use:
- Importing some random library that can solve the problem we ask you to solve in one line.
- If the problem says "don't use a loop" to solve it, it would not be appropriate to use some advanced programming concept like recursion to "get around" that restriction.
These are not allowed because they might make the problem trivially easy or violate what the learning objective of the problem is.
You should think about what the spec is asking you to do and as long as you are meeting those requirements, we will award credit. If you are concerned that an advanced feature you want to use falls in that second category above and might cost you points, then you should just not use it! These problems are designed to be solvable with the material we have learned so far so it's entirely not necessary to go look up a bunch of advanced material to solve them.
tl;dr; We will not be answering every question of "Can I use X" or "Will I lose points if I use Y" because the general answer is "You are not forbidden from using anything as long as it meets the spec requirements. If you're unsure if it violates a spec restriction, don't use it and just stick to what we learned before the assignment was released."
Submission
This assignment is due by Thursday, February 4 at .
You should submit your finished
hw3.py,
and hw3-written.txt
on Ed.
You may submit your assignment as many times as you want until the deadline for the initial submission. Recall on Ed, you submit by pressing the "Mark" button. Work after the due date will not be accepted for an initial submission. Please see the syllabus for the policies on initial submissions and resubmissions.