In this assignment, you will use a hidden Markov model (HMM) to predict a user's tasks from the items sensed over time.
DUE: 11:59pm on Monday, November 21st. (Submit by email to <lowd@cs>.)
A growing area of research is the use of computers in assisted living situations, helping elderly or disabled people live safer, more independent lives. One way to do this is by collecting sensor data on a person's daily routine and detecting when it deviates from the normal pattern. When a significant deviation is detected, the system may take action by prompting the user or alerting caregivers. For more information about this research at UW, see the Assisted Cognition group web site.
Donald J. Patterson has collected data on a morning routine involving 12 different activities and 60 different objects. Each object contained an RFID tag that was automatically sensed with an RFID reader embedded in a glove. Of course, a single object may be associated with multiple activities. Furthermore, RFID readings are not reliable and the pattern of items touched may vary from day to day, so we cannot infer the activities with certainty. For more information on the research project using this data, see the paper: Fine-Grained Activity Recognition by Aggregating Abstract Object Usage.
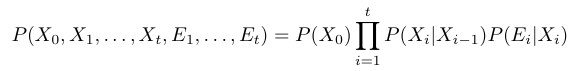
Your task is to code a hidden Markov model (in the language of your choice) to predict the activity (X_i) associated with each sensor reading (E_i). We will assume the data is generated by the following probabilistic model:
Which is represented graphically as follows:
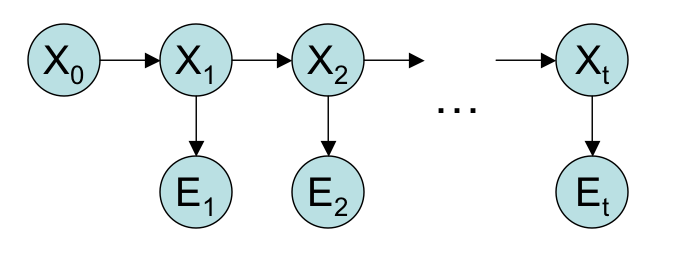
(See R&N, chapter 15 for more details.)
First, learn the parameters of the HMM from training data. These consist of the activity priors, P(Activity), the sensor model, P(Object | Activity), and the transition model, P(Activity_i| Activity_(i-1)). Each of these can be computed using maximum likelihood (ML) estimation. (Just count the occurrences of each event and normalize appropriately.) It is recommended that you use smoothing to avoid assigning a probability of zero to any possible sequence: just add an initial count of m to each state.
Then use these probabilities to infer the activity associated with each sensor reading, in four different ways:
Estimation from current sensor reading: Infer the activity at each point from only the current sensor reading. Note: this does not require the activity transition probabilities at all, it only requires the activity priors, P(Activity), and the sensor model, P(Object | Activity).
Filtering/Monitoring: For each sensor reading in the data, predict the most likely activity using only current and earlier sensor readings. This requires passing forward messages. (Note: we want the most likely activity overall, not the final activity of the most likely sequence.)
Smoothing: Using the forward-backward algorithm, use the entire sequence to predict the most likely activity associated with each sensor reading. This requires computing both forward and backward messages.
Most likely explanation: Run the Viterbi algorithm to find the most likely activity sequence associated with the sequence of sensor readings.
The file formats and operation protocol specified here are important! (This is for tractable, timely grading. Failure to follow this protocol will reduce your grade on the assignment.)
Your program must run from the command line (with no user interaction) as follows:
[program name] <training data> <test data>
[program name] may be anything from "java Foo" to "/usr/bin/perl -w uberHMM.pl" to "hmm.exe", but it must run on Aqua or a departmental Linux server. You are free to add different interfaces, but they must be specified by different compile-time or run-time options. (For example, you can add a "--verbose" command line option that gives extra debugging information, but the above interface must work as well.)
Training and test data are in the following format:
<objectID> <activityID>
<objectID> <activityID>
<objectID> <activityID>etc.
Different lines correspond to distinct sensor readings, ordered by time. Your output will consist of a list of activity IDs for each time step, inferred in the different ways:
<current reading> <filtering> <smoothing> <Viterbi> <true reading>
That is, for each line of the test data, your program will print one line with 5 activity IDs: the activities inferred by the 4 methods discussed above, and the true value from the test data.
At the end, print out the accuracy of each of the four methods. (Accuracy = (# correct predictions)/(total # of readings).) For example,Single-reading accuracy: 60.243% Filtering accuracy: 68.41% Smoothing accuracy: 77.8098% Viterbi accuracy: 78.09%
You can also download a zip file of all data here: a5data.zip
Important data: Included are 10 days of data (e.g., day01.data). Also included are concatenations of all but one of those days (e.g., allbut01.data). The latter files allow you to train from multiple days. By training on all but the first day, then using the first day as test data, you have independent training and test sets. You can repeat using all but the second day and testing on the second day, etc.
Other files: If you're curious about the meanings of the numbers, state_mapping.txt and tag_mapping.txt give the actual state and object names. Also included are extended data files that give a time stamp for each reading, along with all secondary activities being performed concurrently at each time step (e.g., full.002.01.data.) Sensor readings for single activities are provided as well (e.g., single.door.01.data).
In addition to your code, you must submit a brief write-up discussing (at least) the few following questions:
Train and test your code on the same single day (say, day01.data). Then try training your code on one day and testing on another. How do the accuracies compare? Try tuning your smoothing parameter.
Then try training your model on 9 of the days combined and testing on the 10th (e.g., train on allbut05.data, test on day05.data). Average your accuracies over the "held out" day to estimate the overall accuracy of each technique. This is known as cross-validation (specifically, 10-way cross-validation, since there are 10 training/test splits of the data). Cross-validation is a common technique for testing learning algorithms when limited data is available.
Compare and contrast the four techniques in terms of their performance and the specific types of errors that they make.
Submit the following to Daniel Lowd <lowd@cs> by 11:59pm on Monday, November 21st:
Please submit this in a single archive.
Late policy: Late submissions will lose 10 points (out of 100) for every day late.
Last updated: November 7, 2005 2:35 AM