jGRASP Tutorial
by Marty Stepp
last updated August 7, 2008
- Using the Debugger
- Bracket Matching
- Opening Files in a Larger Window
- Enabling Line Numbers
- Mac OS X Common Error Message
Using the Debugger:
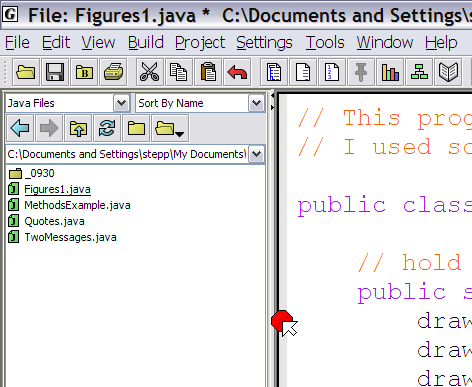
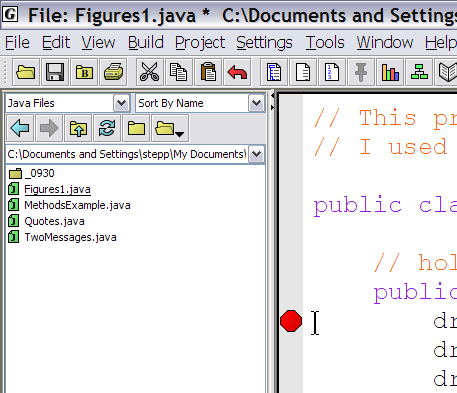
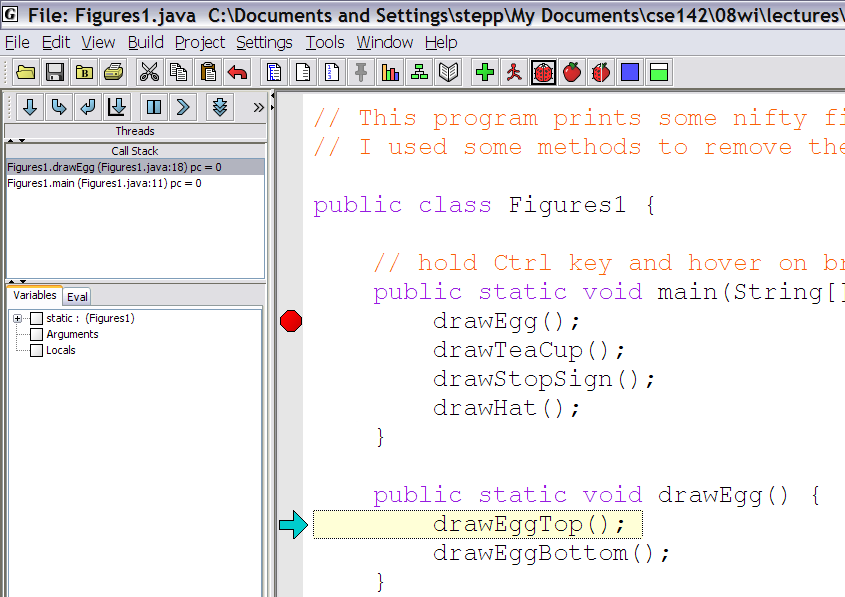
The debugger lets you run your program partially and then stop it. From there, you can run each line one at a time and see the results. To use it, first you must tell jGRASP where to pause the execution; this is called a breakpoint. To set a breakpoint, move your mouse cursor to the left margin of your file's editor window until the cursor becomes a stop sign, and press the left mouse button.
(One good place to set a breakpoint is on the first line inside your main method, so that you can step through the entire program's execution.)
Once you have set the breakpoint, compile your program (if you haven't already) and then press the ladybug icon to run it in debugging mode.
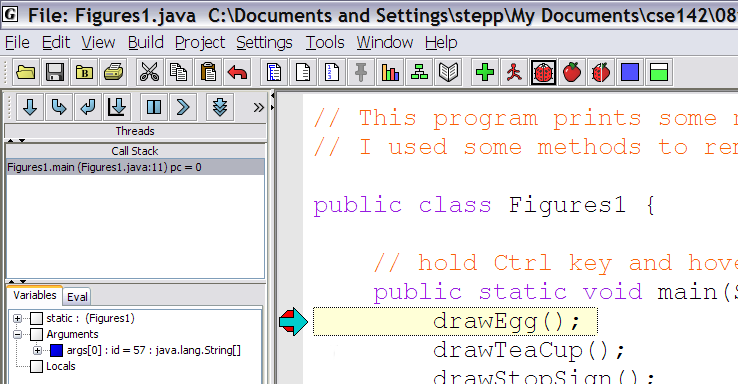
The program will run until it hits the line of your breakpoint. Then the execution will pause. The next line to execute will be highlighted.
Notice that near the top-left corner of jGRASP, there is a new set of buttons. These buttons control the execution of the debugger. From left to right, their behavior is the following:
 Step Over: Executes the current line. If the current line is a method call, runs that entire method call.
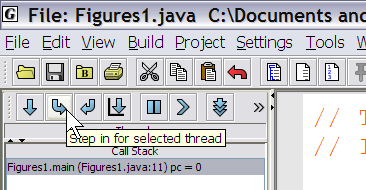
 Step In: Executes the current line. If the current line is a method call, jumps inside that method and pauses at its first line of code.
 Step Out: Executes all remaining lines of the method you are currently in, and returns to the place from which it was called. (If you click this while in your
 mainmethod, it runs the rest of your entire program.) Run to Cursor: Executes lines until reaching the line where your keyboard cursor is sitting.
 Suspend: Stops the program. We won't use this option.
 Resume: Tells the program to continue executing until it is finished, or until another breakpoint is encountered.
 Auto Step: When you turn on this button and then press Step Over/In/Out, it will repeatedly perform that action.
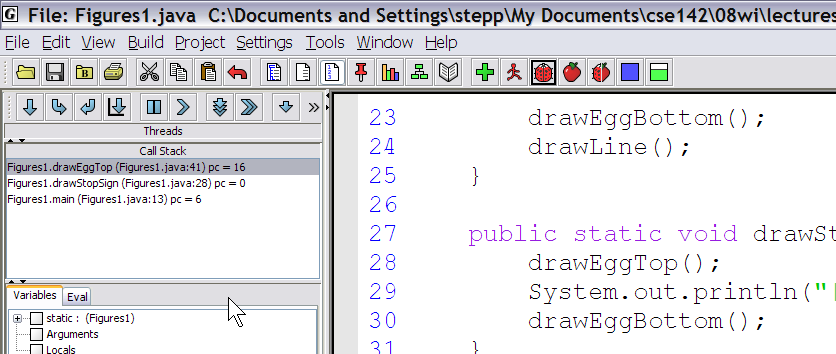
The most useful of these buttons is  Step In, so if you only learn to use one of them, make it that one. For example, we'll Step In to the call of
 drawEgg from our previous example. The result is the following:
Any output that results from the code as it is being run will appear in the bottom console pane.
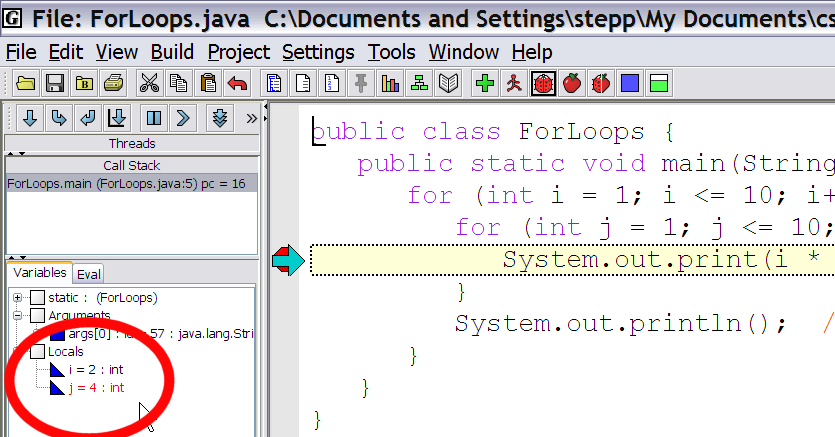
If you're running a program that uses variables, all of the variables' values will be shown on the left as well. As you step through the code, if a variable's value changes, it will turn red on the left.
Bracket Matching:
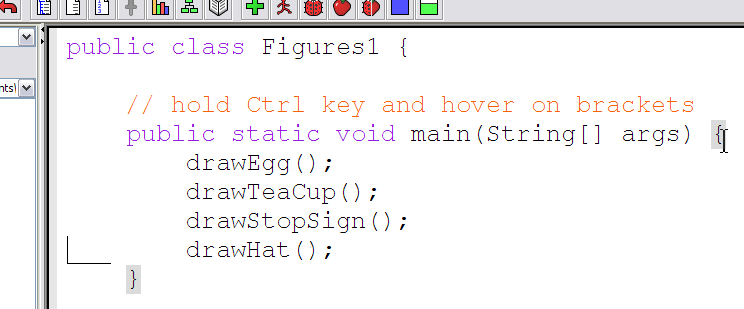
Many bugs have to do with brackets, { and } . Students will have too many, too few, or just have them in the wrong places. jGRASP has a useful feature that matches pairs of brackets to help you track down these kinds of bugs.
To see which bracket matches a particular bracket in your program, hold the Ctrl key and hover your mouse over that bracket. The bracket, along with its matching partner, will highlight in gray.
Opening Files in a Larger Window:
jGRASP has as annoying default setting that causes newly opened files to appear in small box windows. To change this and make the files open in larger windows, click the third button on the bottom left of the jGRASP window.
Enabling Line Numbers:
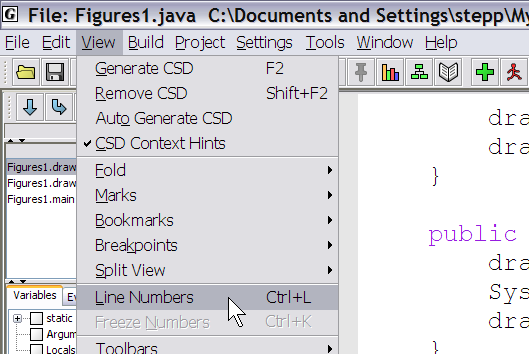
Line numbers are useful so that you can find the line where a compiler error occurs. To tell jGRASP to number the lines of your program, press Ctrl-L or click View, Line Numbers.
Mac OS X Common Error Message:
Some students report seeing a common error message when running jGRASP on their Mac, particularly when using the DrawingPanel. The message looks something like this:
2008-08-07 11:37:06.353 java[4565] CFLog (0): CFMessagePort: bootstrap_register(): failed 1103 (0x44f), port = 0x10303, name = 'java.ServiceProvider'
See /usr/include/servers/bootstrap_defs.h for the error codes.
2008-08-07 11:37:06.353 java[4565] CFLog (99): CFMessagePortCreateLocal(): failed to name Mach port (java.ServiceProvider)
If you see this message, it is not your program's fault. You may safely ignore it. You will not lose any points for this message.
[an error occurred while processing this directive]

 Practice-It!