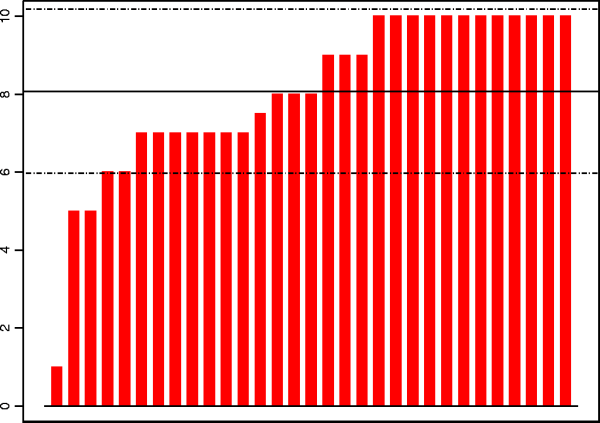
Project 1 (Impressionist)
(10 points possible)

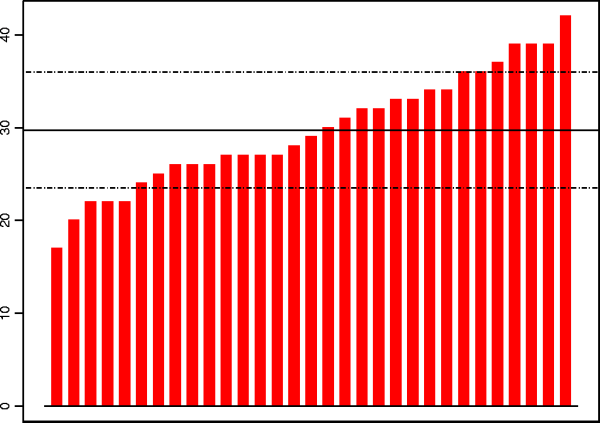
Quiz 1
(42 points possible)
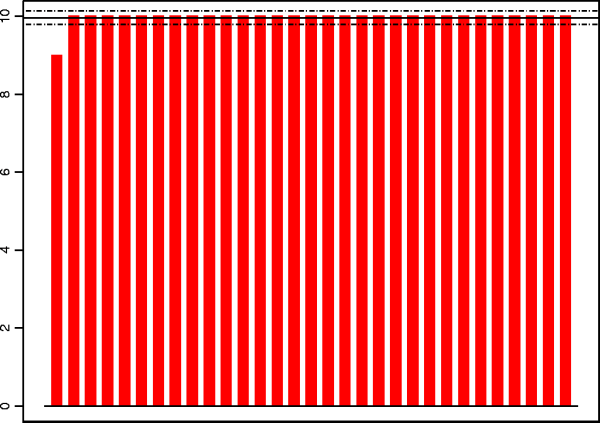
Project 2 (Articulate)
(10 points possible)

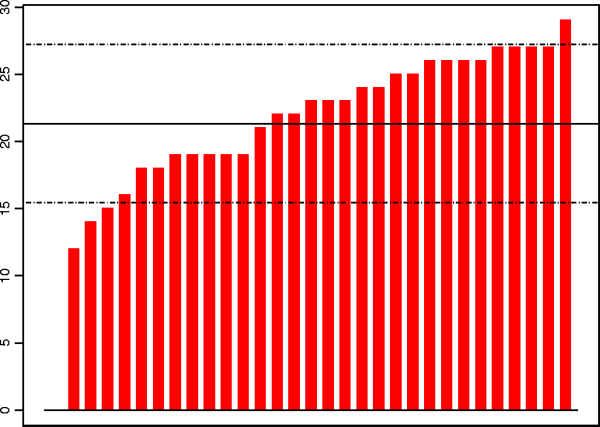
Quiz 2
(30 points possible)
Project 3 (Trace)
(10 points possible)

Quiz 3
(30 points possible)
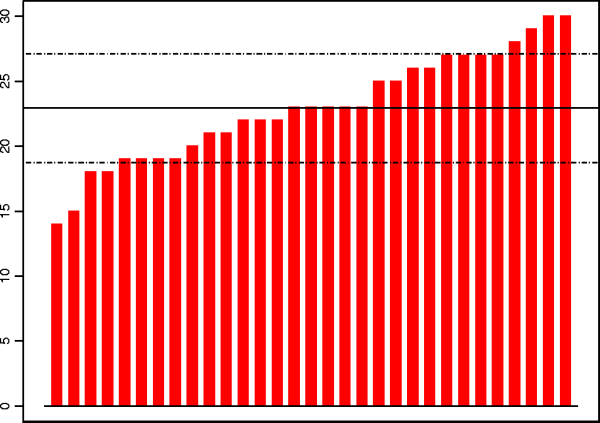
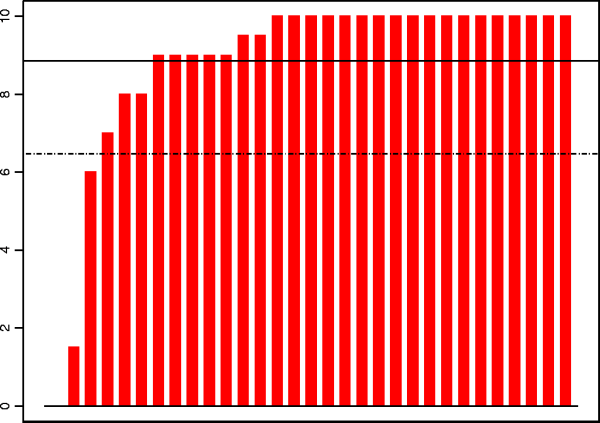
To satisfy your lust for statistics, here are the class scores for each of the projects and quizzes (so far).
Keep in mind that your final grade does not depend on your ranking in the class. We only made these graphs because a number of people wanted to judge for themselves how they were doing relative to everybody else.
To protect privacy, the bars in each graph are sorted by score. The horizontal lines indicate the mean score and +/- one standard deviation. For projects, there are two graphs: one for the main project score, one for bells and whistles (blue).


