 [1]
[1]Program Anywhere: Never Need a Desktop Again
Kevin Deus, Jennifer Romelfanger, Davor Bonaci, Chaoyu Yang
Right now there is no good way to program from a tablet. It’s possible by turning a tablet into a workstation, adding a keyboard, and essentially using the tablet as a small screen, but this doesn’t take advantage of the tablet’s strengths, and it ignores its weaknesses. We propose an interface that would allow you to create useful programs, working directly with the tablet without a keyboard. The interface would focus on relatively small applications with just a few events and actions. This makes it possible to automate common tasks that would otherwise take far too long to do by hand. We’ve designed a visual programming application that takes advantage of the tablet’s touch interface, uses familiar tablet interactions (tapping, dragging, long presses), and minimizes typing.
In the Contextual Inquiry report, we described our selected design, which uses a dataflow programming model in a tablet application with simple left-bar menus. We built a paper prototype of this design, with all the functionality required for our test scenarios. While we created components for a superset of what was needed for the scenarios, we limited the elements in the prototype to a reasonable set of what the user was likely to want, rather than a comprehensive set of what you’d find in a full programming environment.
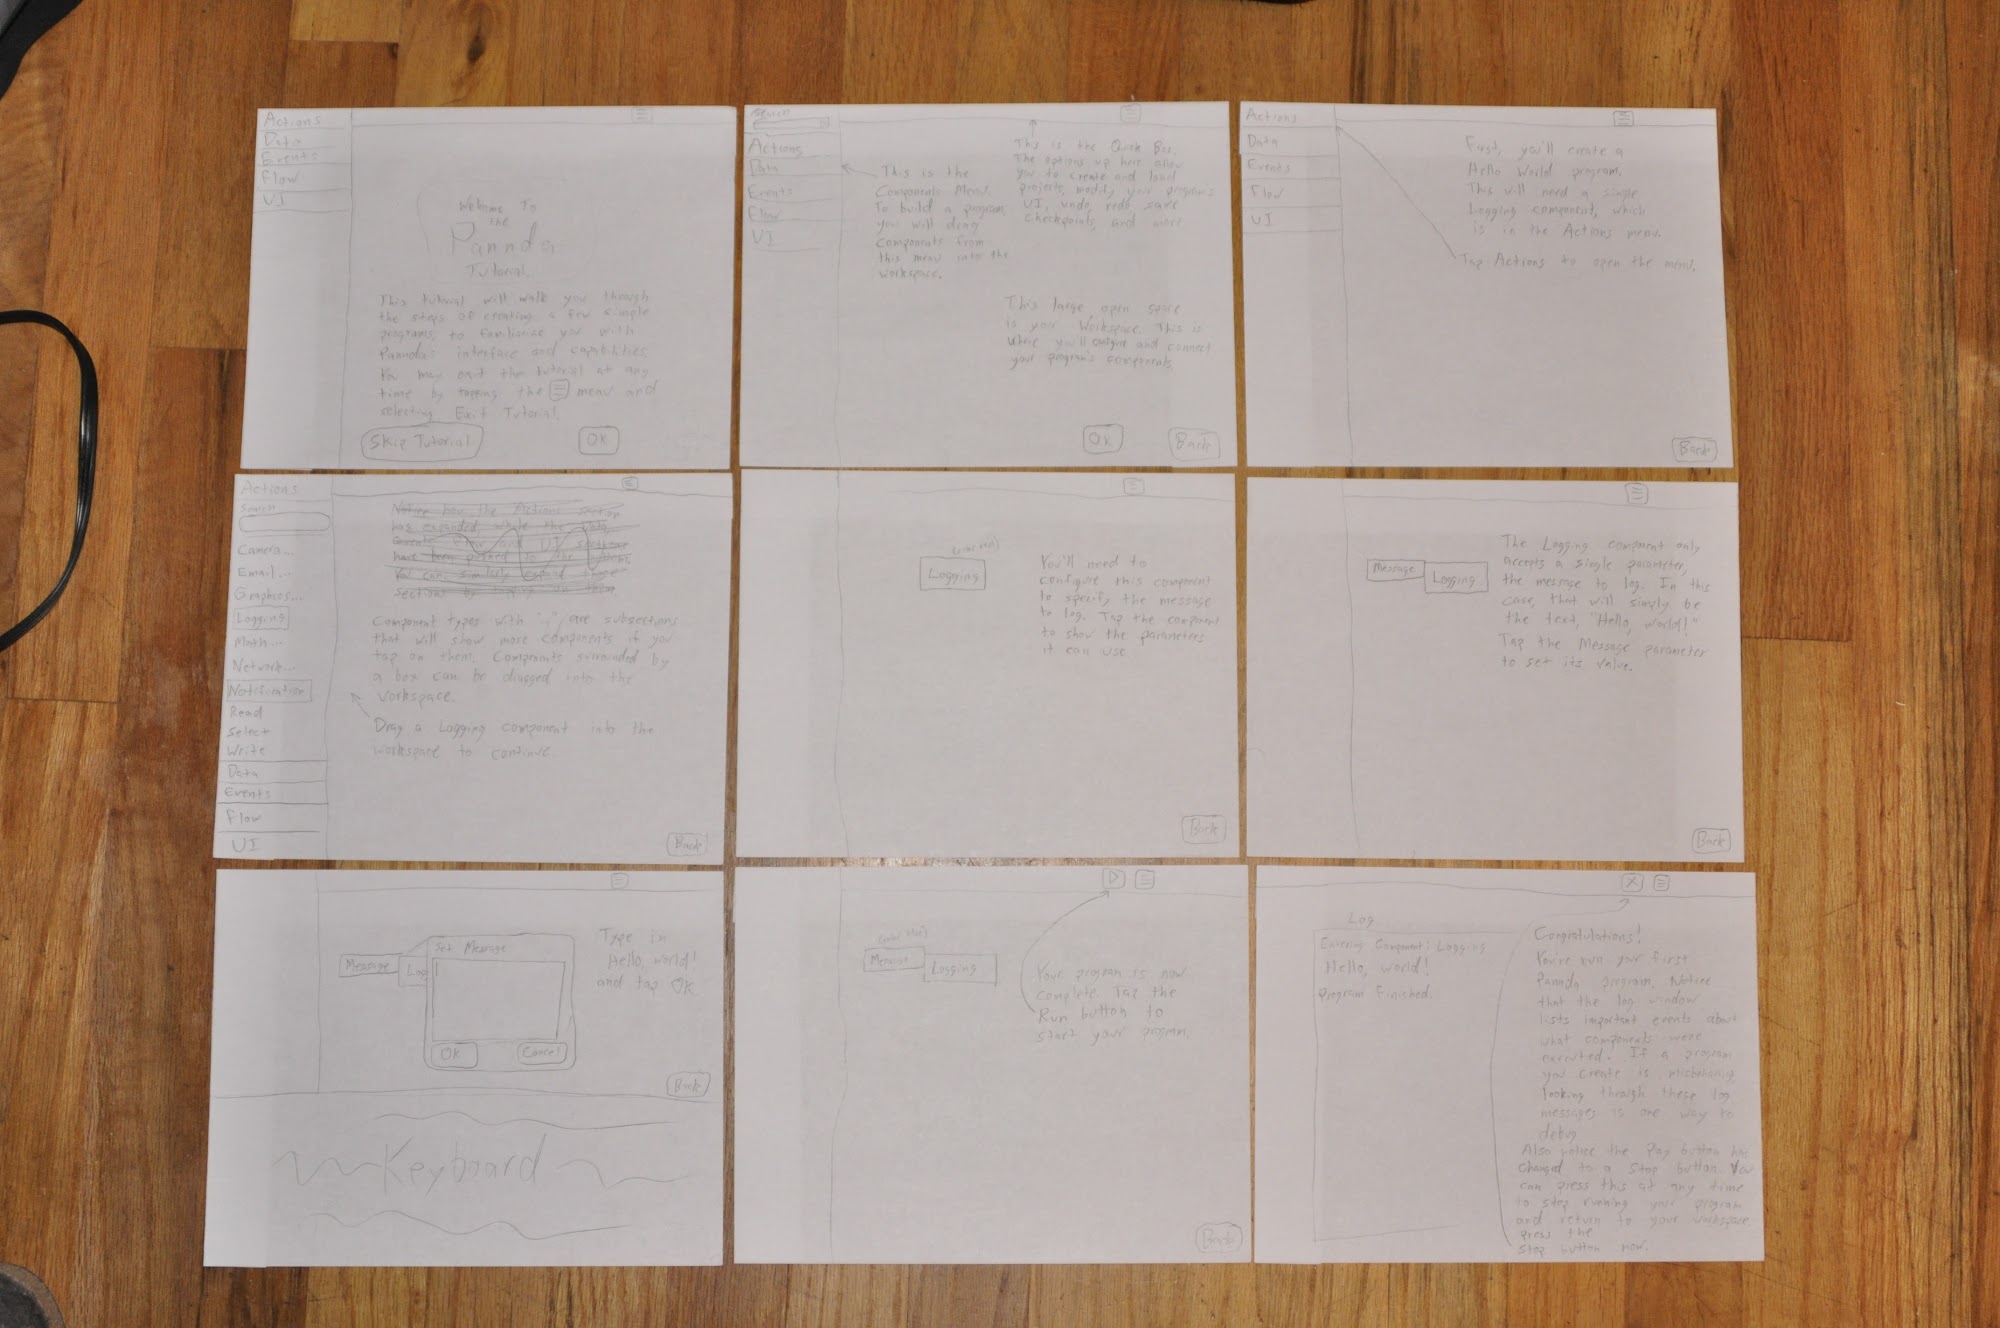
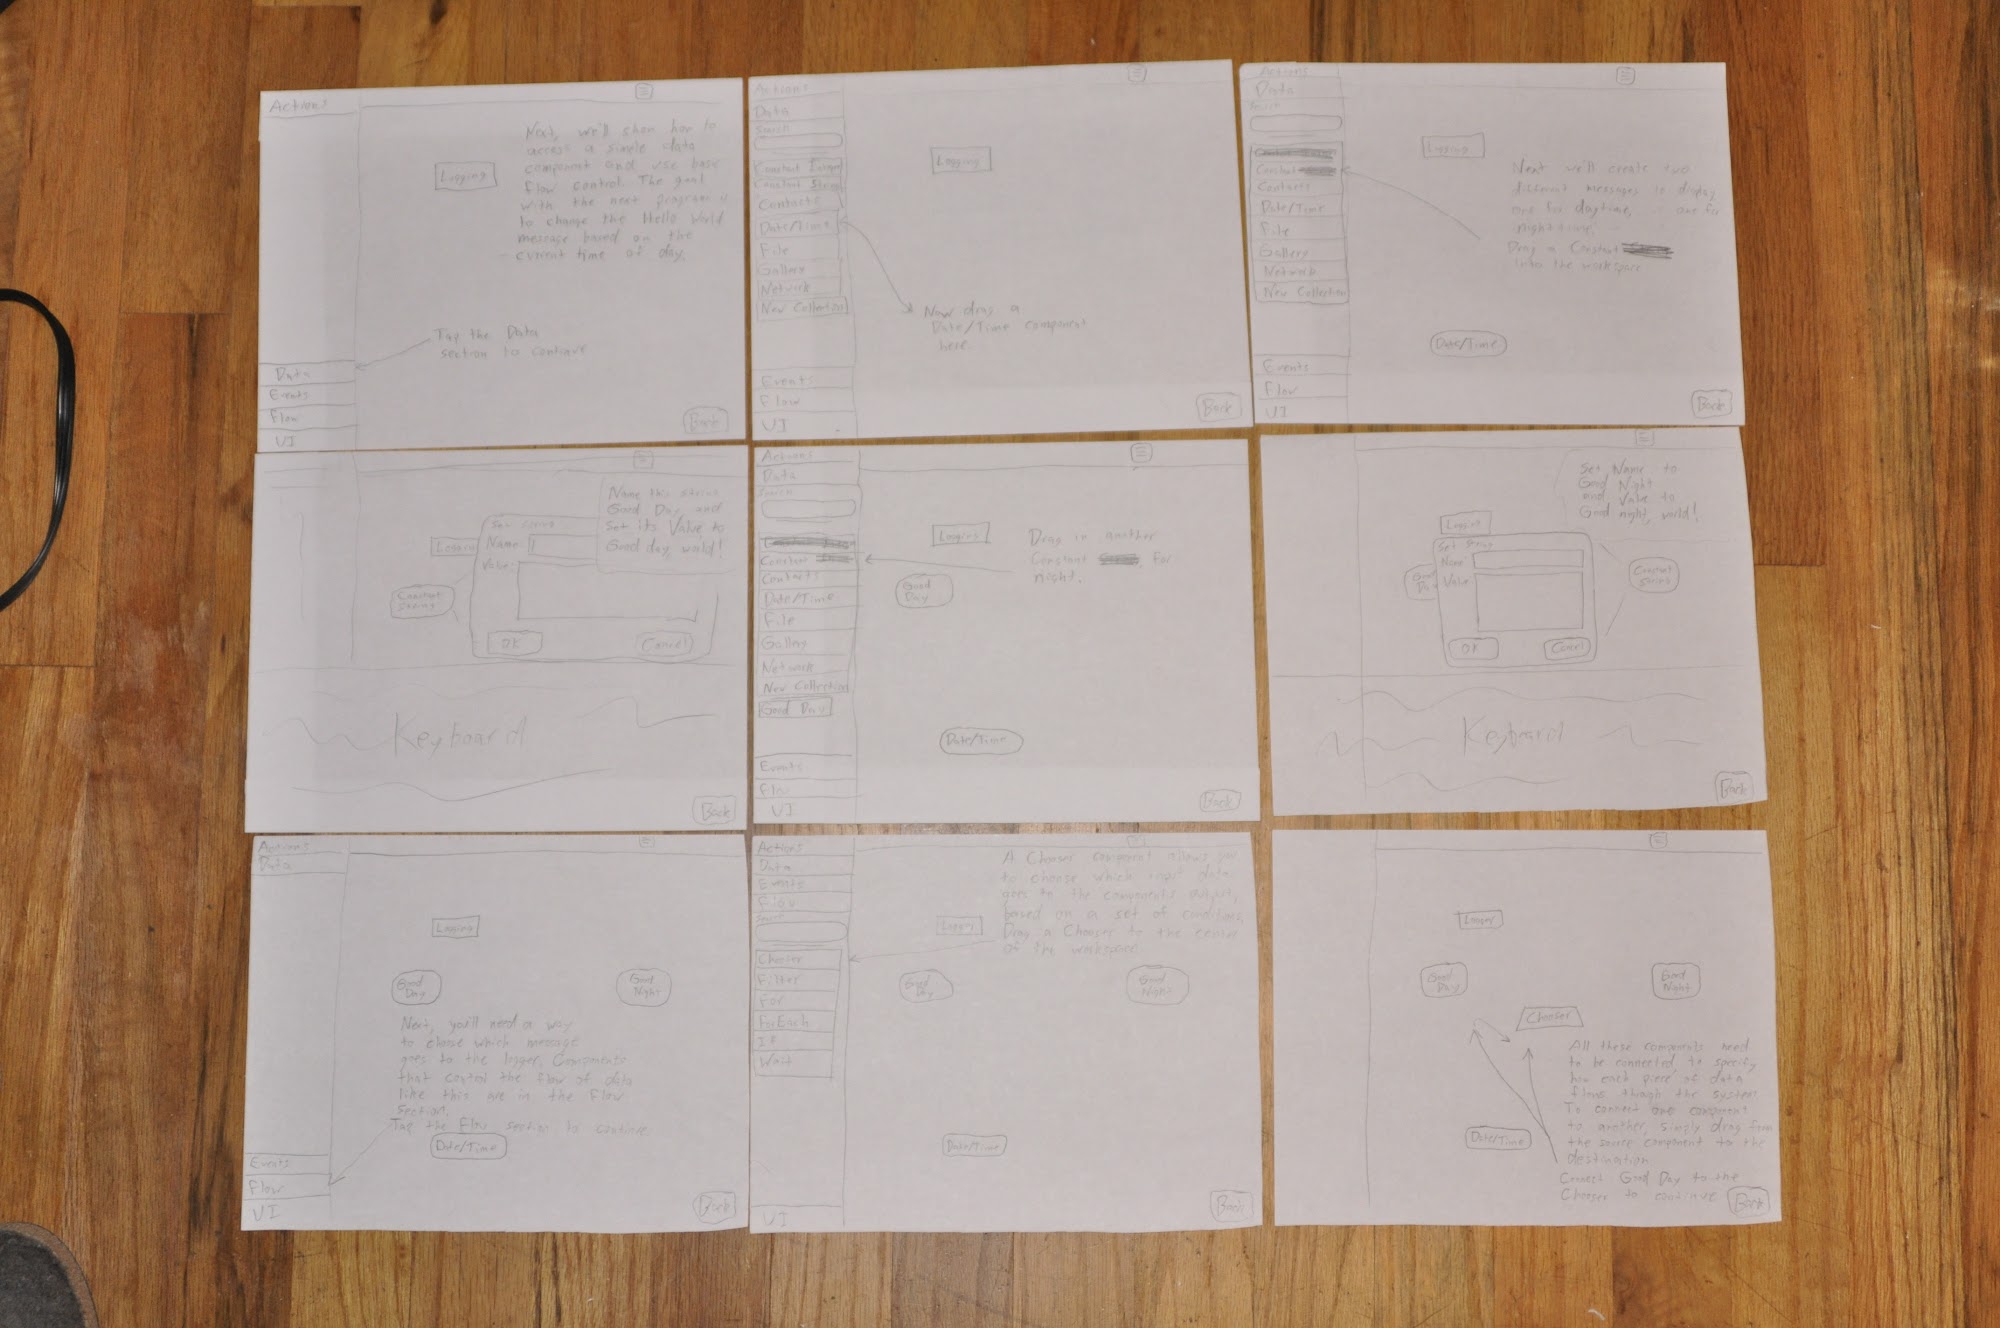
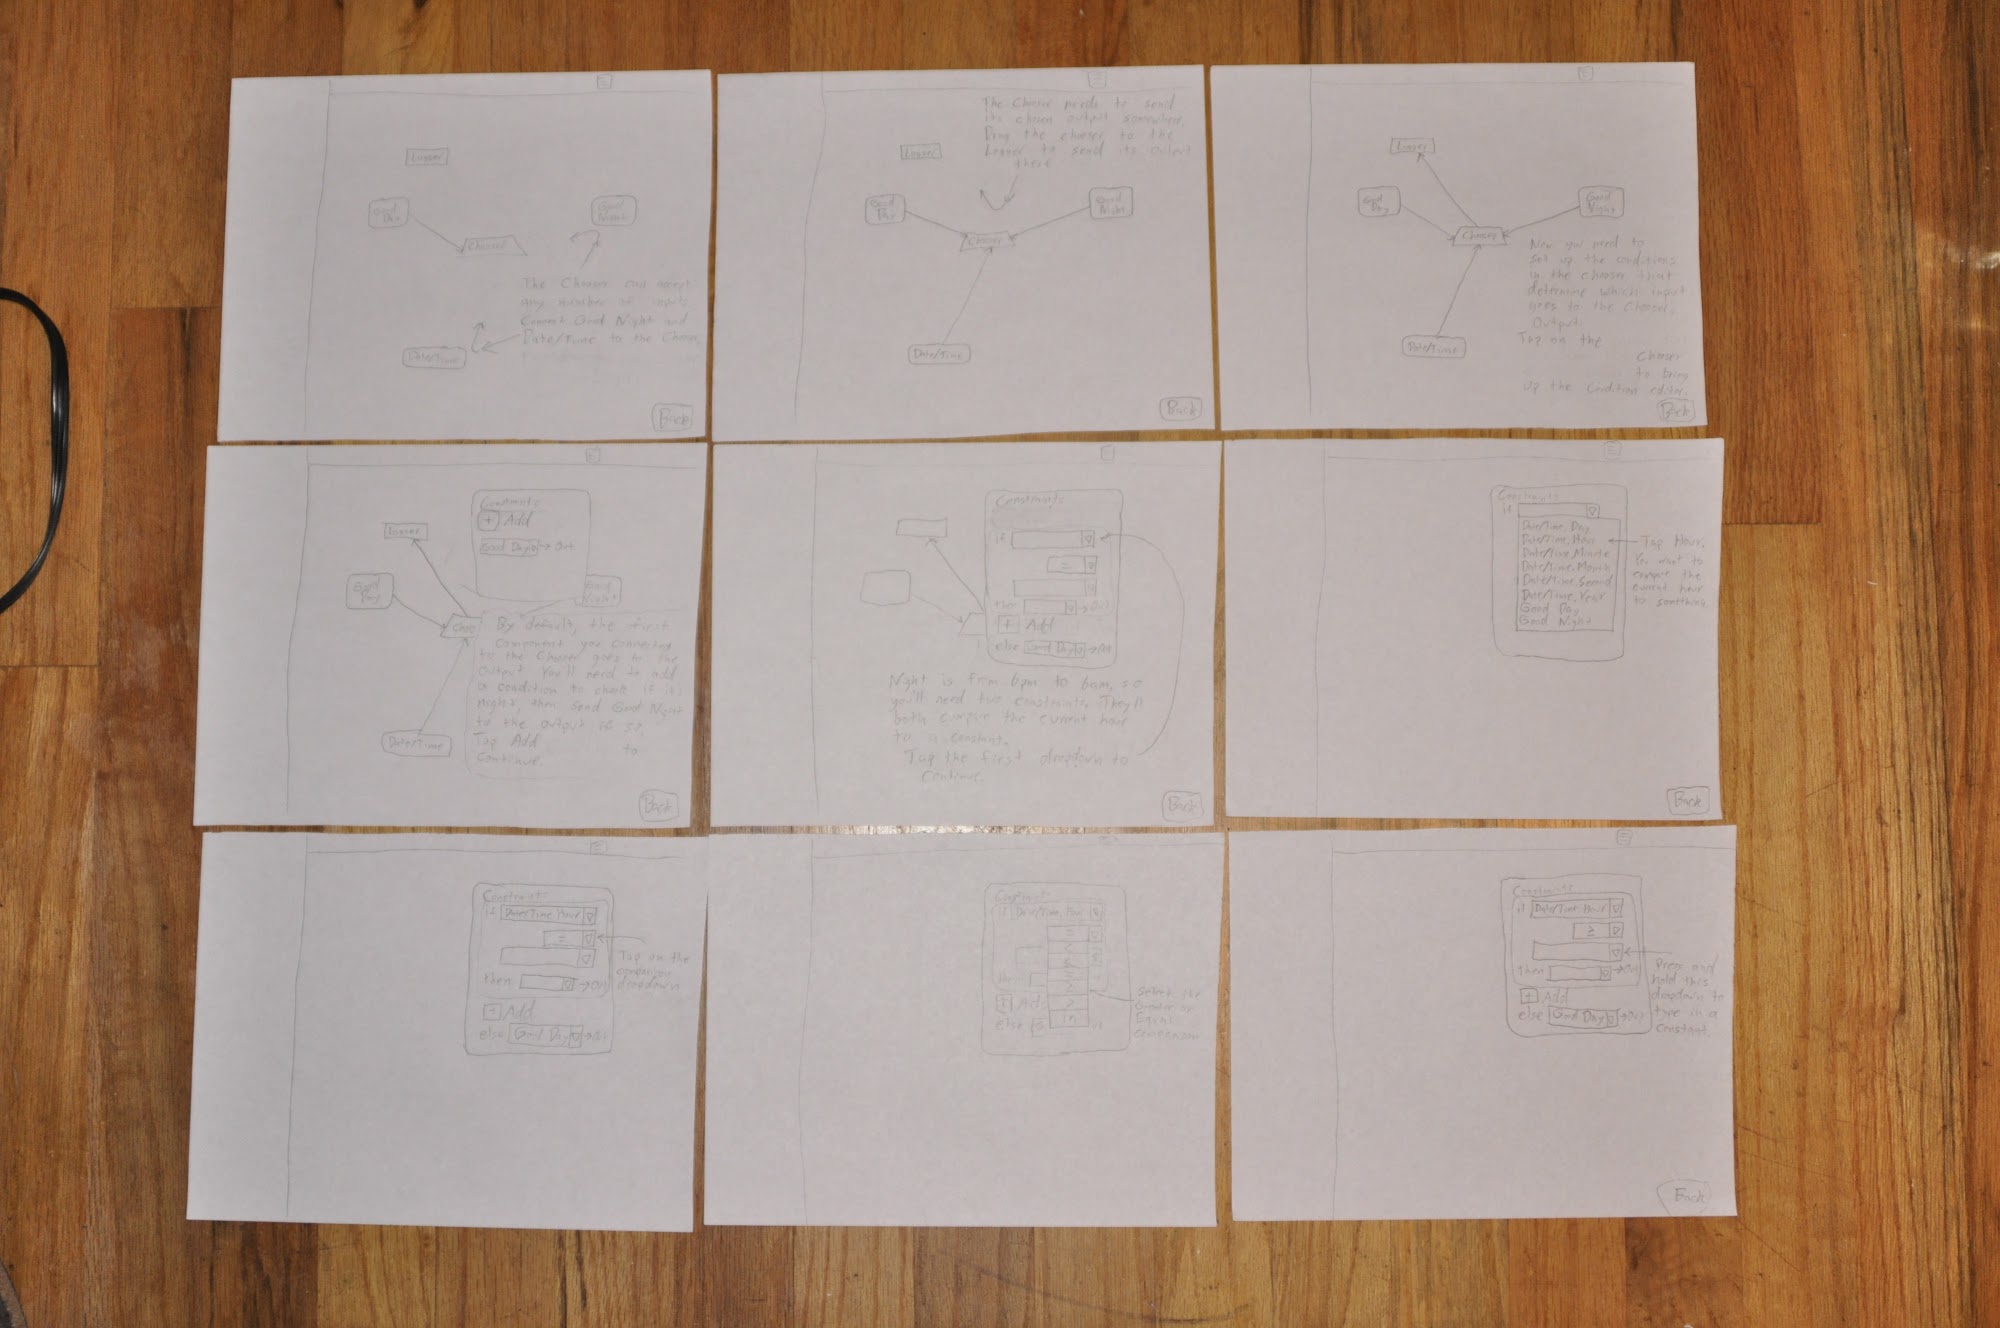
Pannda has 3 main screens: tutorial, development, and execution. We developed a 34 screen tutorial that is offered upon starting the application. The tutorial guides users step-by-step through building their first Pannda application and teaches them how the interface works. Pannda is quite different from desktop-based programming tools and utilizes an uncommon programming model, so we feel the tutorial is essential to introduce users to the programming model and basic interactions with the programming environment. The tutorial screens offer Exit and Back commands, and the user can advance to the next page by successfully performing the action that the current screen asks for. Figure 1 shows a few of the tutorial screens. The complete tutorial is available in the Appendix.
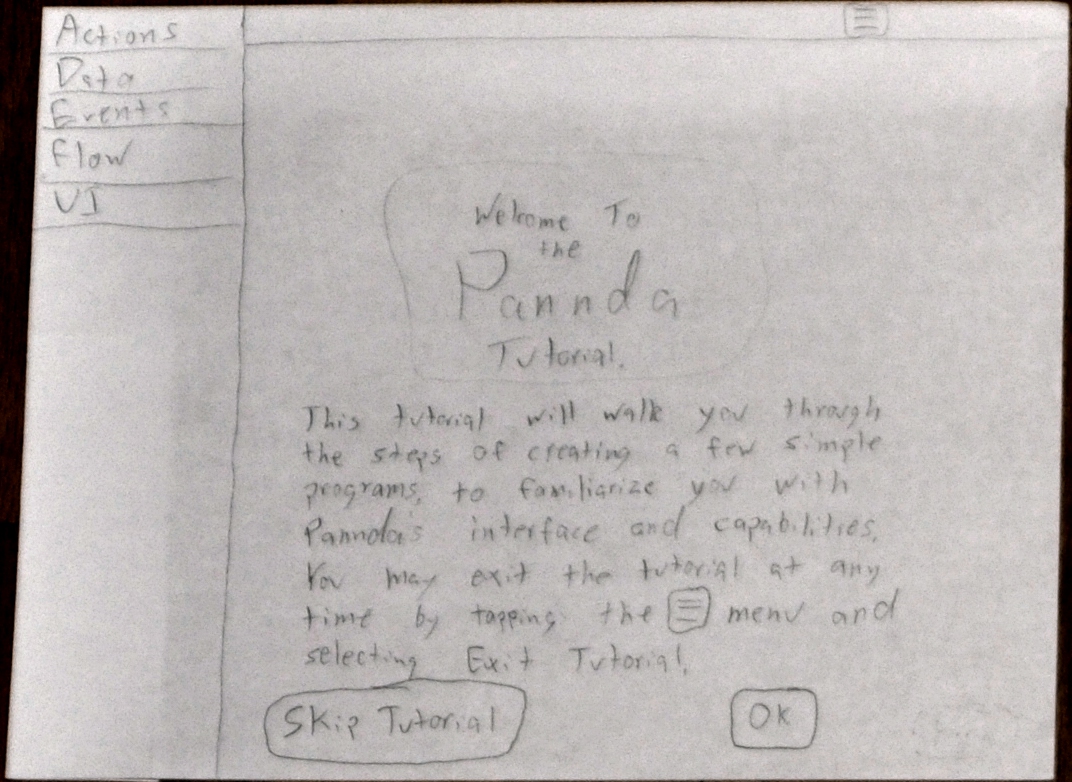
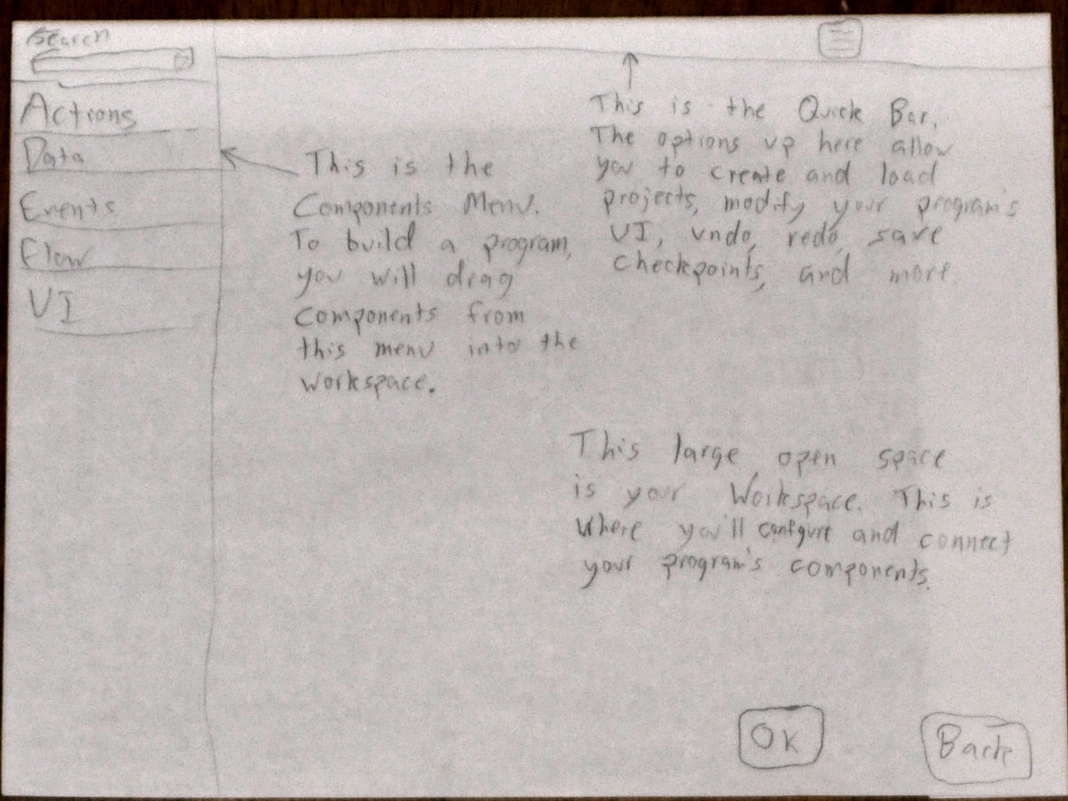


Figure 1 Sample tutorial screens
The main screen is the development view, which consists of an open programming workspace, a left-bar Components Menu, and a top-bar menu, as shown in Figure 2. The development view is on one sheet of paper, and we stick different pieces of paper on top of it for menus and components. For example, all states of the left-bar Components Menu are prepared on separate pieces of paper and can be placed on the main page when necessary. All pieces of the Components Menu are shown in Figure 3.
|
|
Figure 2 Development view | Figure 3 Components Menus |
Components themselves, along with their contextual menus for parameters, are on small sticky notes that can be placed on the programming surface quickly. All components come in two flavors: normal and misconfigured. A misconfigured component has a red border around the edge, to indicate to the user that there’s a problem. We prepared instances of each component in both flavors. Our components “database” in shown in Figure 4. In the workspace, to indicate that one component connects to another, we used sticky notes in the shape of an arrow. An example screen is shown in Figure 5, including a left-bar Components Menu, a few components, and their connections.
|
|
Figure 4 Components database | Figure 5 Sample program layout |
Interaction with program components is one of the most fundamental operations the user can do with Pannda. Components are instantiated by dragging them from the Components Menu to the programming surface. Conversely, they can be removed by dragging them back to the Components Menu. Users connect components by dragging from one component to the other. They remove connections by swiping across an existing arrow on the programming surface, cutting it. Tapping on a component opens up a menu showing the component’s properties and parameters. Finally, a long press + drag gesture moves the component around the workspace. These are familiar gestures to any tablet user, and we felt they mapped to actions in Pannda in a fairly natural way.
When the user runs their application, the execution screen appears, showing the execution log of the application. Naturally, the contents of the log are dependent on the program being created and cannot be prepared in advance. Each time our test participants ran their program, we wrote down an execution log on a separate piece of paper and placed it onto this screen. An example screen is shown in Figure 6. The stop button allows the user to stop the execution of the program and to return to the development screen.
|
Figure 6 The execution log screen |
Some pieces of the paper prototype are easy to operate, and others are more complex. The easiest part is the tutorial, since it only requires switching from one page to the next. Operating the left-bar Components Menu is also reasonably easy, swapping one menu state for another by replacing that piece of paper. Managing interactions in the workspace is more difficult. The operator needs to watch user’s gestures carefully and add, remove, or configure components on demand. Some actions will cause a component to be misconfigured, in which case the operator needs to replace the component with the variant with a red border. Finally, every time the user runs the program, the operator needs to play the role of a programming language interpreter and produce a log that the current program would produce in the real application. All of this requires the operator to pay close attention to the participant’s actions.
After building the initial paper prototype, we conducted some initial testing between ourselves, which brought up a few fundamental issues that we fixed immediately. After this initial pass, we conducted user testing with four different candidates.
Three selected participants were professional software engineers at local companies, while the fourth was a computer science graduate student, with no affiliation with this course or prior exposure to this project. Three of them had no experience programming on a tablet, while one of the software engineers had experimented with a few but didn’t use them frequently. All of them were accustomed to using tablets. This group matched our targeted audience very well, as our system targets engineers and power users. In principle, we were aiming for participants that understood programming concepts, such as loops and branching, and use tablets or smartphones, but have minimal or no experience in tablet or dataflow programming. We felt this target audience could provide the most useful feedback, since they’re already familiar with programming fundamentals, but they’d need to ramp up on the type of programming environment and methodology used by Pannda. We wouldn’t expect most Pannda users to understand dataflow programming without some introduction.
Our system enables programming anywhere, so conducting the test in a specific environment is not important to get successful test results. In the interest of convenience, we chose to conduct the testing in the participant’s normal office environment.
The prototype was set up on a table in the participant’s office or a conference room. There were two team members conducting testing with each participant. One team member operated the paper prototype as described in the previous section. The other team member was the facilitator, which included interacting with the participant, giving initial explanations, taking notes and obtaining final feedback.
Initially, we planned to use these three tasks for testing:
The first participant took a little over an hour to complete only the first task. After the second participant failed to complete even the first task in the same amount of time, we decided that our three tasks were far too difficult. In order to get more useful feedback from the testing, we decided to drastically change the tasks. We split one of our tasks into three smaller pieces, then we used those as the three tasks for the remaining two participants. The time required to complete these new tasks proved to be much more reasonable. Both remaining participants successfully finished the tasks in a reasonable amount of time.
To create the final three tasks, we split the “send an email to a subset of the contact list” task into:
First, the participant is expected to take the Contacts collection from the Components Menu, perform filtering based on a given last name, then log the output using a Logging component. A sample solution is shown in Figure 7.
|
Figure 7 Sample implementation of task 1 |
Once the first task is completed, the participant is expected to instantiate a Send Email component and use the previously computed list as input. They’ll also need to configure the Send Email component, specifying the message body and which email address to send the email from. A sample solution is shown in Figure 8.
|
Figure 8 Sample implementation of task 2 |
Finally, the third task is to send individual emails to the same group of people, instead of one group email. This involves inserting a ForEach component into the flow. A sample solution is shown in Figure 9.
|
Figure 9 Sample implementation of task 3 |
The test procedure is reasonably simple. The paper prototype operator silently operates the prototype, while the facilitator manages the test and takes notes. The facilitator starts by explaining the process to the participant, including the basic description that Pannda is a tablet programming tool. Next, the facilitator explains the participant’s role, including aspects of informed consent and the fact that we’re testing the system, not the participant.
The participant is then given a paper card with the description of the first task. When it’s clear the participant understands the task, testing begins with the first tutorial screen. The participant can freely choose whether or not to go through the tutorial. While we didn’t necessarily expect every participant to go through the tutorial, we created it as a way to introduce them to Pannda’s programming model. This approach also provides an evaluation of the tutorial’s effectiveness, since we can see during the test which elements they remembered or which elements we need to add to future versions of the tutorial.
After finishing the tutorial (or skipping it), the participant is free to complete the task in whatever way he likes. At this stage, we try to interfere as little as possible. We enforce a 90 minute time limit for the entire procedure for two reasons: respect for the participant’s time and fear that the results would be negatively skewed after participant becomes tired.
At the conclusion of the test, the facilitator spends 5-15 minutes performing a semi-structured interview where the participant can provide general feedback. In our case, our participants are also programmers, so they can offer a perspective both as a user and a software designer when making recommendations for improvement.
In principle, testing focuses on identifying spots that a participant finds complex or unintuitive, or cases where the participant seems confused. Those trouble spots are the most important feedback we can collect during testing, with the intent to fix interaction around those spots in subsequent iterations. While these don’t necessarily provide quantitative metrics, we feel this sort of feedback highlights the most important areas for improvement.
To measure task completion, we care only about a successful program. We don’t track whether the program created by the participant is optimal, efficient, or pretty, as that would evaluate the participant’s programming skills and not our system.
If we were to conduct a larger test where we could generate more statistically significant results, the following test measures might be interesting to track:
We mentioned one of the key results earlier: our initial tasks were far too complex and time consuming for the allotted time, and we decided to correct this during testing. We don’t view this as a complete failure of our interface, but rather as feedback that we underestimated the complexity of programming in a new environment with an unfamiliar programming model.
We were pleasantly surprised that all participants went through the entire tutorial, which took 12 minutes on average. This gave all participants a good introduction and a similar starting point. We do suspect, however, that this is partly influenced by the test environment, and that in the wild many users would either skip the tutorial completely or would exit out partway through.
In Table 1, we summarize a subset of the test measures. These numbers demonstrate the overall effectiveness of the system, as reasonably complex programs can be built quickly. We don’t attempt to dissect the numbers as we feel they aren’t statistically significant.
Task | Average # times Help System used | Average time to complete the task |
Task 1 | 1.2 | 16 min |
Task 2 | 0 | 13 min |
Task 3 | 1 | 15 min |
Table 1 Summary of test measures[a]
Overall, some elements of the prototype that turned out to be very successful were:
Some of the main problems that participants ran into were:
To some degree, participants had issues interacting with the paper prototype that, in our opinion, wouldn’t occur in the real application. It is difficult to try to emulate simple movement and animation in a paper prototype. We had to explain a lot verbally (eg. “This component is following your finger”). In some cases, it was hard to determine whether a particular piece of feedback was caused by a deficiency in the design or if it was caused by this type of low-fidelity prototyping.
We tried to address any major issues before interviewing the next participant, if we believed we had enough data points to make a reasonable decision. This is detailed in the next section. Overall feedback from our participants was quite positive, although everyone wanted to see some degree of simplification.
We made several simple changes between tests, if it was clear that something needed to change. Initially, arrows connecting components had no labels. After the first test, we decided to add the targeted parameter name to the arrows so users knew how the arrows map to inputs. Figure 10 shows an example before (left) and after (right).
|
Figure 10 Adding parameter labels to connection arrows |
We also realized that in our dataflow model, most components require a Start Event input which could be used to trigger the event. We had implemented this for a few components, but we didn’t initially realize it applied to almost all components. The left side of Figure 11 shows the initial design, without a start event, while the right side shows the Start Event parameter added.
|
Figure 11 Adding a Start Event to every component |
The help menus proved crucial in the first test, but the participant always had to complete an extra step to get to the part of the documentation they wanted. This step was slow, since it required them to type in a search parameter. To speed up this interaction, we added a quick link to Help for the last component touched, show in Figure 12.
|
Figure 12 Quick Help link to the last touched component |
After the third test, we added a trash can icon to the top bar to enter delete mode. We had hoped that deleting by “cutting” connections or by dragging components back to the left menu would be discoverable, but this was definitely not the case in the paper prototype. Figure 13 shows the toolbar before and after adding the delete icon.
|
Figure 13 Toolbar before and after adding delete icon |
After reviewing the results of our user testing, we decided to make several more adjustments to our interface. Several issues were common to all participants, and others were severe enough that, even if only one user ran into them, they were still worth fixing. Some of these adjustments changed fundamental interactions with the system, while others are just minor fixes.
One issue that came up in multiple tests was the organization of the Components Menu, especially with items related to data. One participant looked for data-related actions under the Data submenu, while we had placed them under Actions. To improve this we decided to rename Data to Data Sources and move data-related actions under a new top level item called Data Processing, seen in Figure 14.
|
Figure 14 Components Menu before and after reorganizing data-related submenus |
A second issue that arose was that logging did not work as the users expected. Initially, logging was the same as any other function: the log message was a parameter that could be entered directly or sent from an input component. Since many users expected to be able to customize a message with multiple inputs, we changed Logging to be a special case, with a new dialog for editing the Logging output.
|
Figure 15 Configuring the Logging component, before and after revision |
The dataflow model was another point of confusion for many of our users. To clarify what data was flowing where, we added a few features. Figure 16 shows that we added the data type to the input arrow. We also decided to grey out parameter options that do not match the input data type, indicating that the input couldn’t apply to that parameter.
|
Figure 16 Data type added to connection arrows |
We added more intelligent data pickers, such as a time picker and email selection dropdown.
|
Figure 17 Intelligent data pickers |
Several test participants didn’t realize that many parameters could be set directly, or they were confused about how to do so. To address this, we added a pencil icon to all fields which could have manual inputs, as shown in Figure 18.
|
Figure 18 Pencil icons added to manually editable inputs |
Many test participants had trouble discovering how to move components, so we added a bar at the top of every component. This is a common visual indication that the component could be grabbed there and dragged around.
|
Figure 19 Draggable bar added to each component |
Finally, some participants were concerned that the log screen was either too detailed or not detailed enough. Following common logging conventions, we added a choice of log level to the execution log screen, as shown in Figure 20.
|
Figure 20 Log levels added to execution log |
We decided to do a video prototype rather than an interactive prototype. A lot of our interface depended on drag and drop, UI pieces that react in a variety of ways to user action, and animation. None of us were familiar with any web technologies that would make those things easy for an interactive prototype, so it seemed like a video prototype was a better option.
Our tech-savvy hero goes to the local Apple store to get a new iPhone 5S. But alas, they’re all sold out. Instead, he’s given a link to a website that will tell him when the phone will be available.

He returns home disappointed after his long journey. Over the next few weeks he continuously checks the website for the availability of this greatly desired treasure.


“Enough! There must be a better way… I know! I can automate this using Pannda!”

To demonstrate how to write a program in Pannda, we create a walkthrough showing step by step how to build webpage checking and notification app. First, our hero creates a new project and calls it iPhone Notifier.


Then he drags out a “Load Web Page” component and manually enters the URL for the website.


He adds a few more components to find the flag in the webpage’s XML indicating phone availability and send that value to be logged.


He runs the program and verifies that it is working as expected. Then he adds a timer to trigger this check repeatedly.


He runs the program again to test it out. Everything looks correct, so he swaps the “Logging” component for a “Notification”.


“That was easy. Time to try it out.” He starts the program thinking he’s finished, but he immediately gets an alert! That’s not right! He fixes it by adding a filter before the notification so he only gets notified when it becomes available.


He also sets the filter to stop the timer once the value has changed, so it will only notify him once. He starts the program and returns to a normal life, free of the undying need to check his tablet every free moment to see if his phone is available.


After many ages, the program finally receives word that a phone is available and alerts our hero. He makes the long journey back to the store and finally receives his long-awaited reward.

There are two main components to the video prototype: the backstory and the walkthrough of the interface. The backstory involved several days of filming, plus numerous nights of editing and effects. The interface walkthrough was built in Balsamiq Mockups, then saved as 231 screenshots that were placed into the video.
One of the team members has experience creating videos and is familiar with software for video editing (Sony Vegas), visual effects (Adobe After Effects), music (Sony Cinescore), and audio adjustments (Audacity). All four of these were crucial to putting the video together quickly. Some of these are fairly advanced tools, and they allowed us to create a film we’re happy with.
Due to time constraints and the difficulty of filming during the Thanksgiving holiday season, one of the key scenes couldn’t be filmed on location: the scene in the Apple store. This one required video compositing using After Effects to place the actors in front of a still image of the Apple store. This was complicated by the lack of a green screen. Fortunately, the sky was cooperative and we were able to use the sky as a sort of blue screen. This wasn’t ideal, and the resulting footage has some visible artifacts, but it was good enough to get the idea across.
Again, given time constraints, we couldn’t come up with a good way to show interaction with the program on a tablet, so we decided the next best thing was to zoom in and have the tablet screen fill the view. This allowed us to create the screenshots in parallel with the filming and editing. Also, this allowed us to cycle through the screenshots and show how to use the interface without having to worry about how to create a working prototype on a tablet or composite shots together. A few short scenes have the screenshots composited onto the tablet, but these have minimal interaction. While After Effects worked well for those short scenes, it would have been far too time consuming to do that for all the interactions.
Cinescore is a tool used to create custom royalty-free music for short videos such as this one. It has a limited library of tunes available, but its ability to customize the songs and adjust their time was very useful. Fortunately, a couple songs in the library happened to fit the mood of the video very well, so we were able to use those.
We used Balsamiq Mockups to create the interface walkthrough. This also required some Balsamiq extensions, Photoshop to modify the icons, and some Bash scripts to handle file exporting and management.
Balsamiq is a great tool to create mockups, and it has a rich set of built-in UI elements and UI extensions from the user community. It also allows users to customize the built-in UI elements as well as create and import their own. Several tools from the community were helpful to save and export the resulting XML files.
Unfortunately, Balsamiq has poor support for interactive controls. The drag and drop interface Pannda uses couldn’t be implemented in this tool, so we had to duplicate screens and move components bit by bit to indicate that a component was being dragged around. Also, Balsamiq doesn’t support version control or the sort of advanced file management you’d need for a large project. The way Balsamiq creates and exports files makes it hard to manage projects with more than 200 screens, such as ours.
The video prototype does not show all aspects of the design. A significant component left out of this prototype is the ForEach component, shown in Figure 21. This was not included in the video because the sample scenario we chose to implement doesn’t require it, but it was used by users during user testing. The ForEach component is a resizeable box that iterates through each item in a collection and passes it to a component inside the box. The box itself can be resized by dragging the rectangles located on the right and bottom sides of the box.
|
Figure 21 Sample usage of the ForEach component |
The remaining portions which are not shown in the video are some of the menus which are secondary to the programming interface. The first is the help menu, previously shown in Figure 12. Users used this often during user testing, but since we always did Wizard of Oz simulation of the results, we didn’t have actual documentation to show in the video.
Next, since source control came up often in the contextual inquiry, we wanted to include a checkpoint system. Figure 22 shows the checkpoint menu. One of our test participants briefly explored this menu, but none of them made use of it, largely because we never asked them to save their programs. We also chose not to include it in the video as it is not the main focus of the application.
|
Figure 22 Checkpoint menu |
Figure 23 shows the Load Project screen. This uses a carousel widget to display already existing projects. Each project will display a thumbnail version of the program and the project name. In the video, it made more sense to create a program from scratch, so there was no need to show this menu.
|
Figure 23 Sample Load Project screen |
Here are several lessons we learned over the course of this project:
The original 3 tasks:


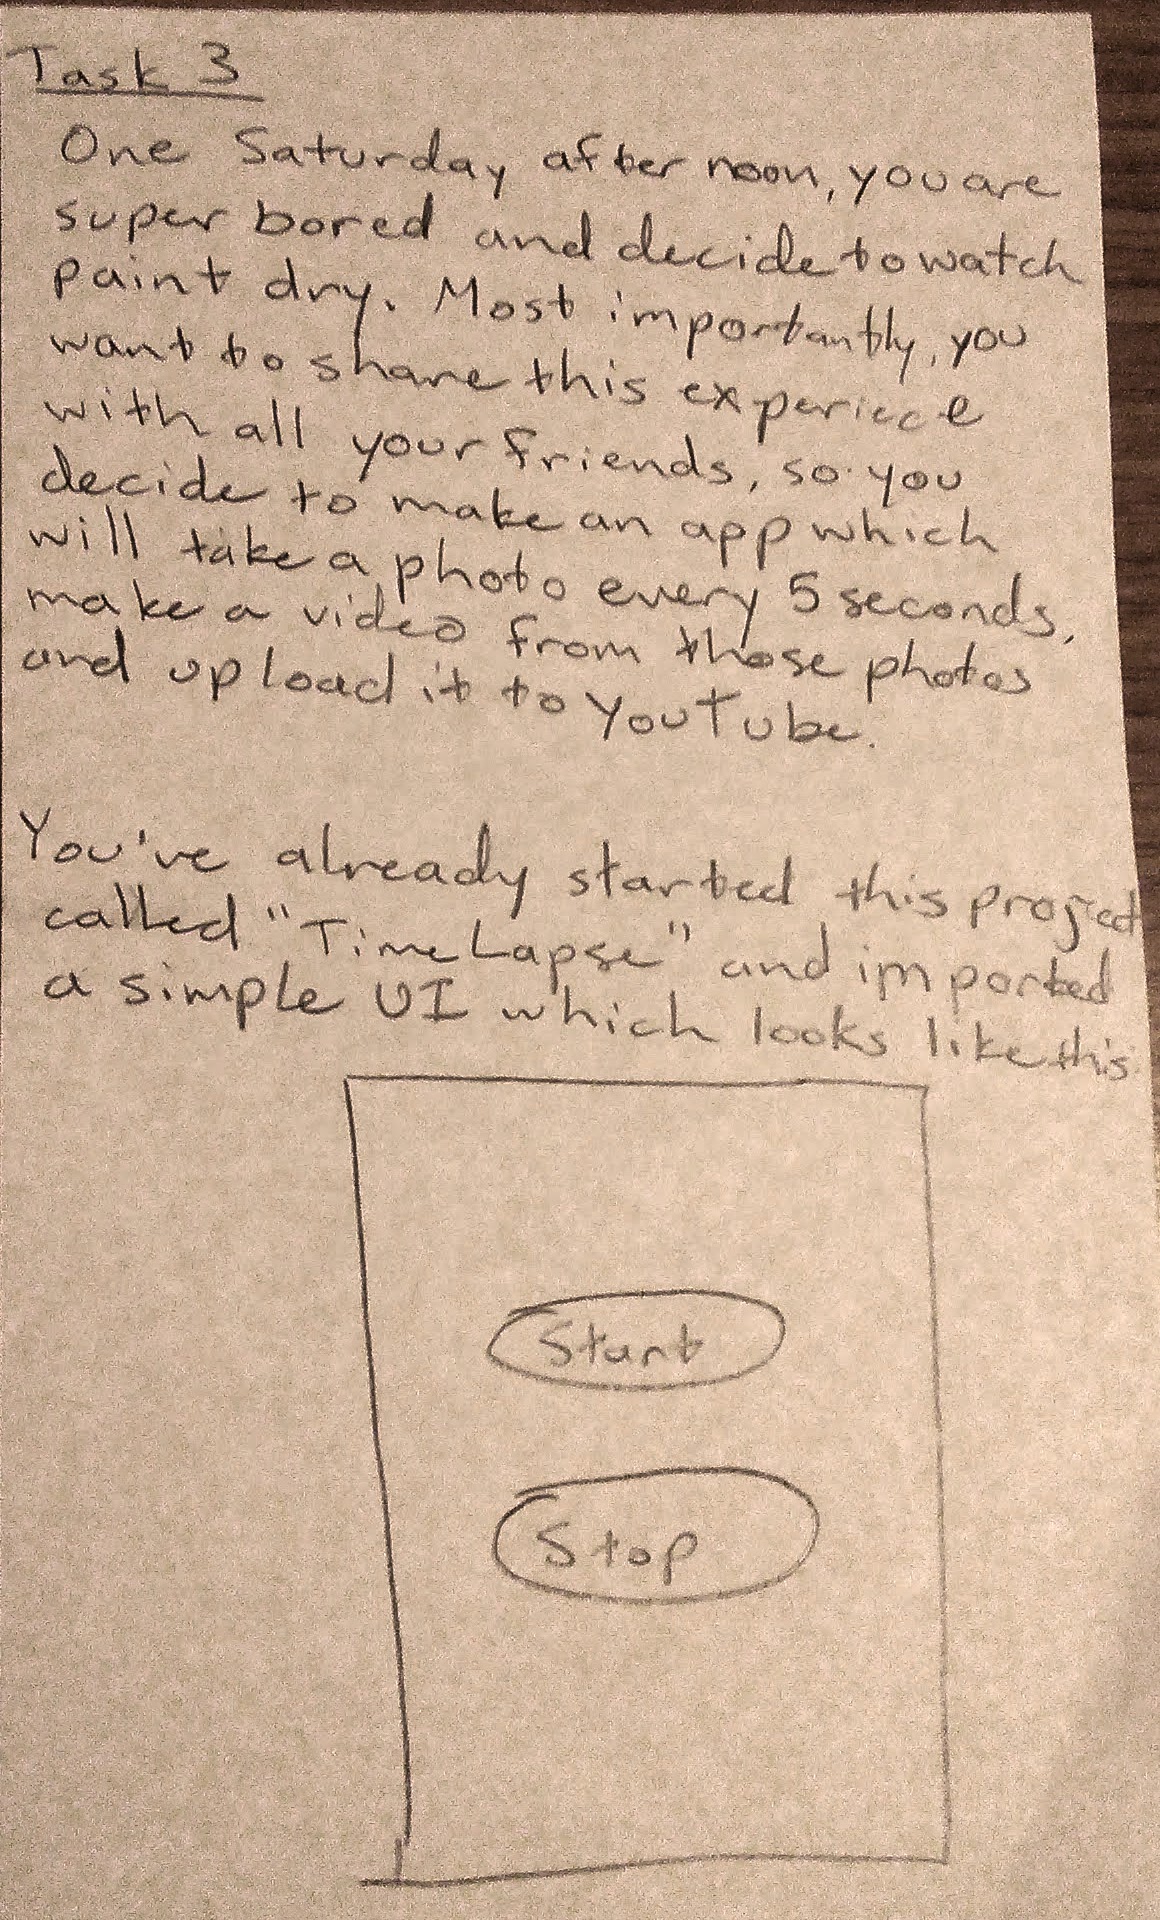
The final 3 tasks:

Tutorial:
iPhone task:
Overall comments:
Tutorial:
iPhone task:
Other thoughts/questions:
Tutorial - Time 11:52
Task 1 - Time 15:38
Taks 2 - Time 8:56
Task 3 - Time 13:20
General Feedback
Tutorial - Time 16:27
Task 1 - Time 16:50
Task 2 - Time 17:08
Task 3 - Time 17:22 - 17:40
General Feedback


