
CSE/EE 577: Medical Image AnalysisAutumn 2017 |
Download the images you need: CTdicom.tar.gz, hw1.m
|
|
|
|
| a) sample DICOM image | b) illustration of image elements in 2D and 3D space | c) reconstructed bones |
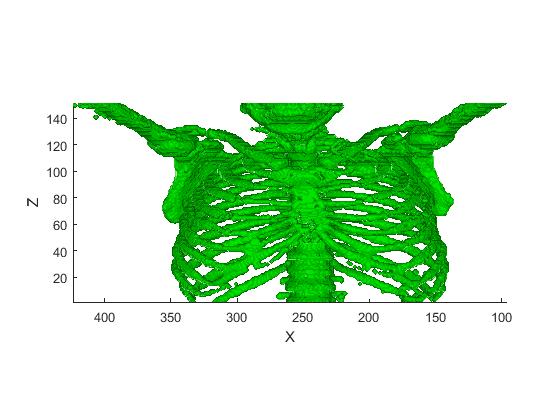
The main goal of this assignment is to reconstruct the rib cage in a stack of CT images that come from the neck to chest area of a patient. While some other organs (lungs, heart) are visible, the large tumor takes away from being able to reconstruct them, and the bones are the easiest structure to find, as they are essentially white.
You should do this assignment in Matlab. We provide you with a partial script, and you are to experiment with parameters to get the best reconstruction you can. It is best to run this on a computer with as much memory as you have access to. It WILL run on an old slow computer, such as Dr. Shapiro's Linux machine Lilith, which is 8 years old and has 4G of memory. It took over 15 MINUTES to run on Lilith. It took 1 second to run on our Windows server Craniowin2, and it took about 20 seconds to run on Dr. Shapiro's 4 year old Windows desktop Rupert who has 16G of RAM after she coughed up the price for installing Matlab on it. You get the picture. The reason for the slowness is that you are going to be working with 512 x 512 x 152 images to create the reconstruction. While the images are not large by today's stardard, the stack of all of them is large.
We will provide you the code to read in all the DICOM images in order. Your task is to select the pixel threshold for bone regions, erode/dilate the CT images to remove noise and set boundary box to remove background. You will need to create a set of voxels out of the stacked CT images and we will provide you the code to convert the voxels to a 3D mesh.
Get all the DICOM files in the target directory. Matlab has the function dicomread to read all the DICOM files and parse all the tags from the DICOM header. All the CT images are stored in order as a stack in matrix DI.
| clc;clear all;close all; %% Get all the images in the DICOM directory dicom_path = 'CTdicom/'; files = dir([dicom_path '*.dcm']); |
| %% Read all the images disp('start reading.'); clear DI; for i = 1:length(files) info = dicominfo([dicom_path files(i).name]); % info has all the tags from the DICOM header % InstanceNumber is the slice location DI(:,:,info.InstanceNumber) = dicomread([dicom_path files(i).name]); end disp('end reading.') |
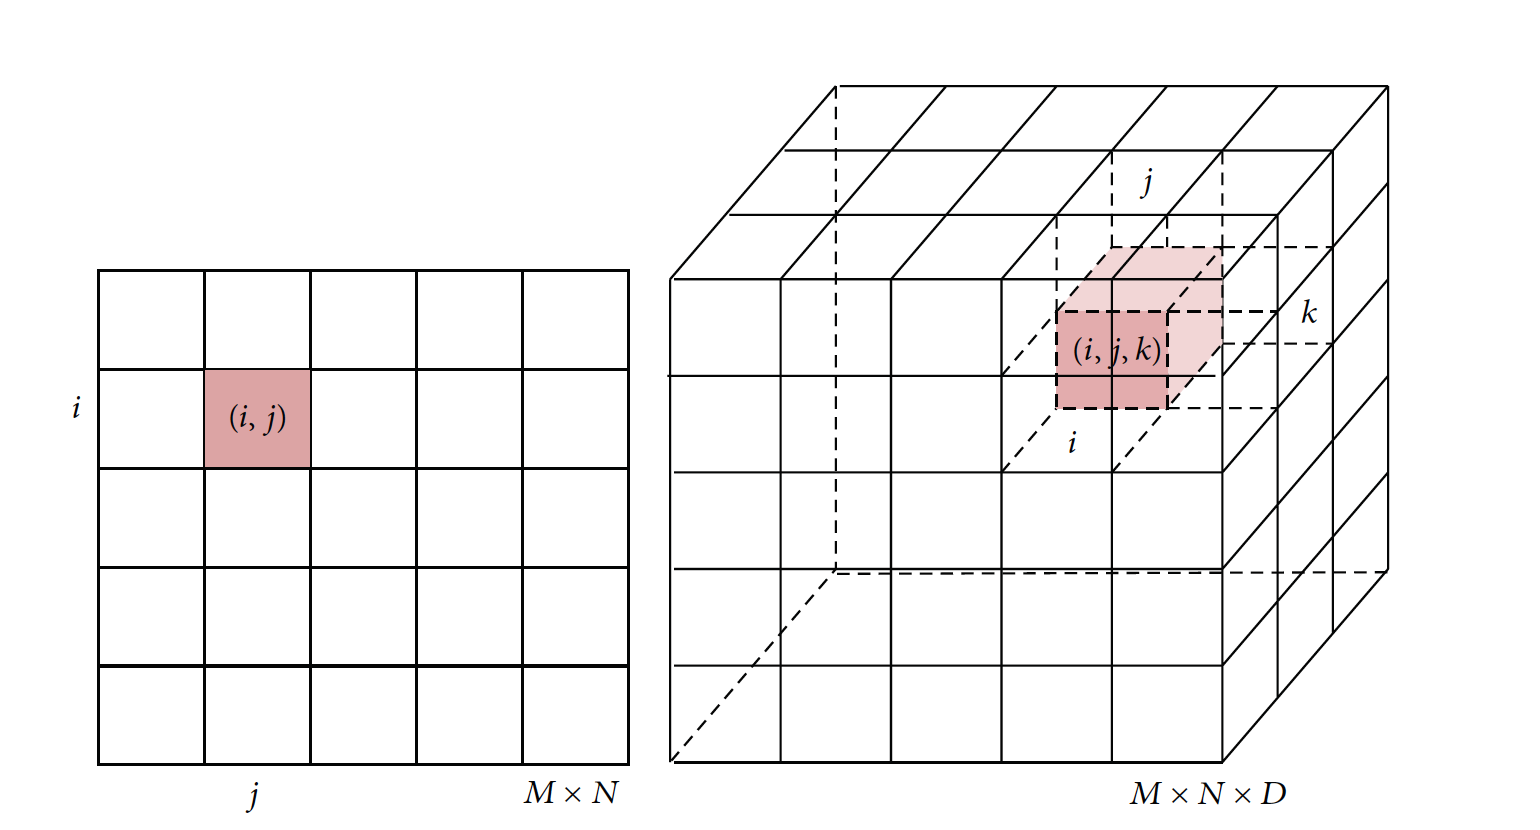
We use voxels to represent the 3D geometry from the CT stack. A voxel (wiki) represents a value on a regular grid in three-dimensional space, as pixels in a bitmap. Each element DIijk represents a voxel grid in the 3D space with x- and y-coordinates given by the 2D x- and y- coordinates and z-coordinate given by the instance number of the DICOM file. See Figure b) for illustration. We use the Matlab function meshgrid to create the X, Y and Z coordinate arrays for DI.
| %% %create mesh grids to make voxels xlim = [size(DI,1), 1]; ylim = [size(DI,2), 1]; zlim = [size(DI,3), 1]; Resolution = 1; ux = xlim(1) : -Resolution : xlim(2); uy = ylim(1) : -Resolution : ylim(2); uz = zlim(1) : -Resolution : zlim(2); [X,Y,Z] = meshgrid( ux, uy, uz ); |
Here, you need to specify a threshold for bone regions. Bone regions are usually the brightest compared to the other regions. We suggest you first to rescale the DI values to [0,1] for easy visualization. The thresholded images are stored in masks.
| %% %TODO hint: rescale DI values to [0,1]. Set a threshold for to extract the bone region. maxval = minval = masks = |
Clean the bone region. Put the result in values.
| %% %TODO hint: use imerode/imdilate to clean the bone region values = |
Save the thresholded images to file.
| %% %output thresholded result for visulization mkdir('thresholded/'); for i=1:length(files) imwrite(values(:,:,i),['thresholded/',num2str(i),'.jpg']); end |
When looking at the thresholded images, you will find some noisy parts around the edge of the CT scans. Try to find a bounding box to include only the bone region.
| %% %TODO hint: look at all the thresholded results, try to find a bounding box to %remove the background noise cleanmask = values = values.*cleanmask; |
Save the cleaned images to file.
| %% mkdir('cleaned/'); for i=1:length(files) imwrite(values(:,:,i),['cleaned/',num2str(i),'.jpg']); end |
Convert the voxels to a 3D mesh using the Matlab function isosurface. This might take a little bit longer. The mesh of spine and ribs will be displayed in the figure window.
| %% figure; ptch = patch( isosurface( X, Y, Z, values, 0.1 ) ); isonormals( X, Y, Z, values, ptch ) set( ptch, 'FaceColor', 'g', 'EdgeColor', 'none' ); set(gca,'DataAspectRatio',[1 1 1]); xlabel('X'); ylabel('Y'); zlabel('Z'); view(180,0) lighting( 'gouraud' ) camlight( 180,0 ) axis( 'tight' ) |
Homework is due on October 18 (Wednesday) by 11:59 PM PST.
This assignment can be done alone or in groups. If you do not know and/or do not have Matlab, we will pair you with someone who does, and you can get help from Shu.