CSE576 Project1 Report by Xinwei Liu
1. Feature Detector
In this project, I used Harris Operator as my feature detector. I
followed the standard algorithm by computing the Harris Matrix and used
harmonic mean to select key pixels. Particularly, I used 3x3 sobel
operator to compute each pixel's gradient in x and y direction. When
come to thresholding harris value, I selected threshold to be 0.0005
after several experiements. For simplicity, I "ignored" boundary pixels
and artibiturily set their harris value to be 0. As boundary pixels
usually only count for a tiny portion of whole image, I assumed this
degree of "slopiness" won't affect the big picture very much.
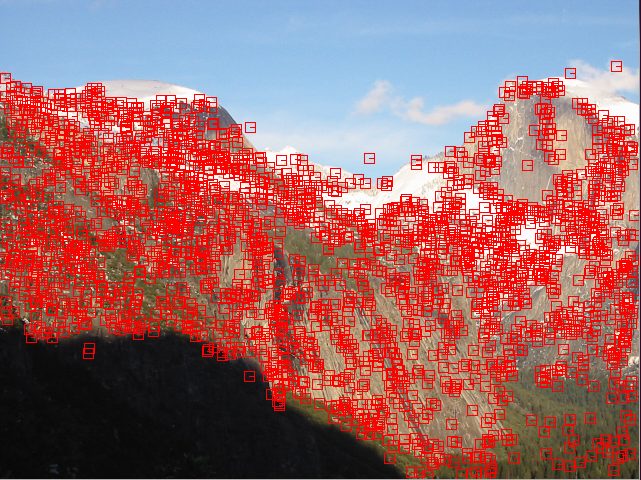
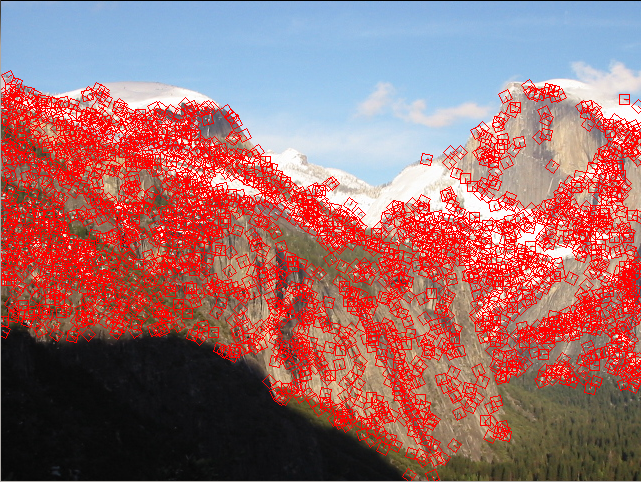
Below are a simple comparison of feature detector's result with given SIFT features
Given SIFT
features
Harris Features at threshold=5e-4
Below are the Harris Images of Yosemite1 and Graf1
Graf1
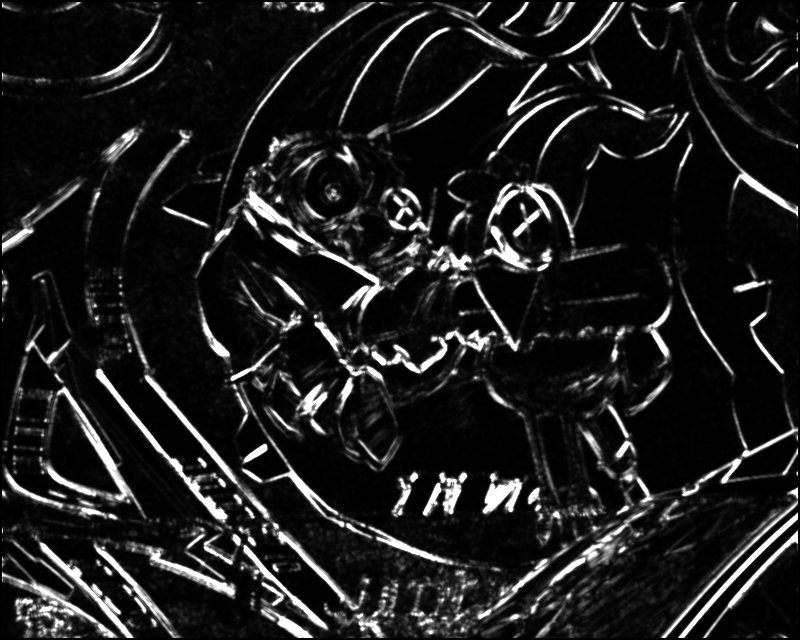
Yosemite1

2. Feature Descriptor
In this project, I tentatively used two feature descriptor and compared their performance.
This first one is relatively simple, just taking of 5x5 patch of each
feature pixels and rotate it such that its normal orientation overlab
with horizontal orientation. Then I simply used the pixels' values in
the rotated patch to serve as pixels' featrues. When come to compute
the x,y gradients for computing radians, I again used the standard 3x3
size sobel operator. In this way, I expected the quatified features
should be reletively
invariant to rotation of images, but not invariant to scaling and
lighting variance.
I used Mops as my second less naive descriptors. For more details, I
take a 18x18 patch over each feature pixel and rescale it to its 1/2
size and retrieve a 9x9 patch with feature pixel sit right in the
middle. Then again I rotated the scaled patch to horizontal and
calculated the mean and standatd deviation of the patch. Finally, I
normalize the patch by substracting mean and dividing the deviation, so
that I could expect the descriptor would be invariant to not only
rotation, but scaling and difference degree of exposure.
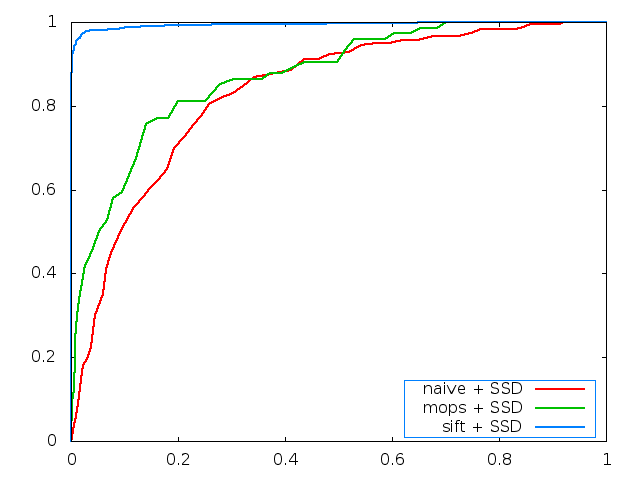
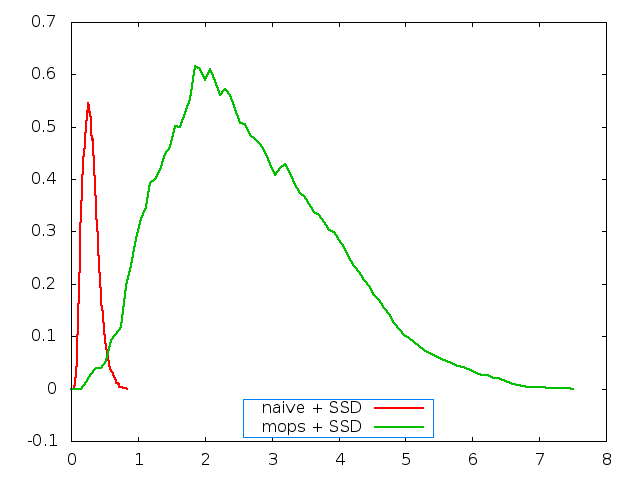
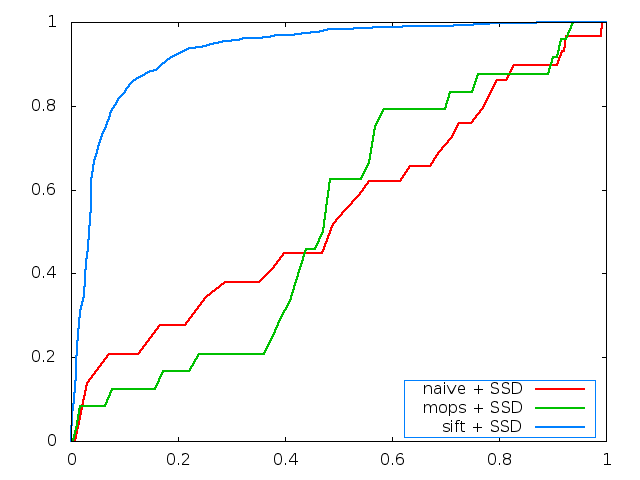
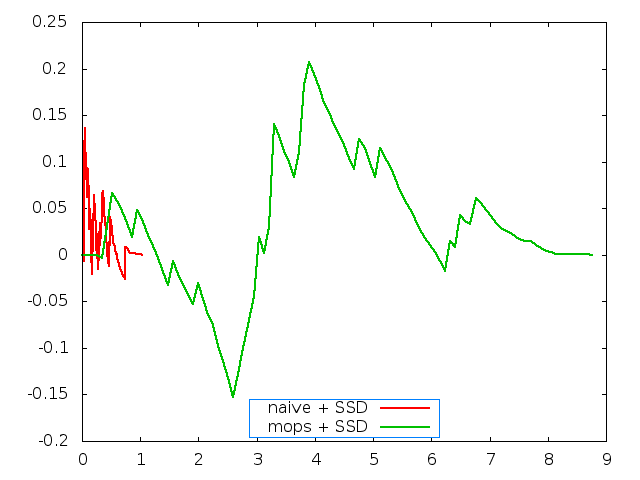
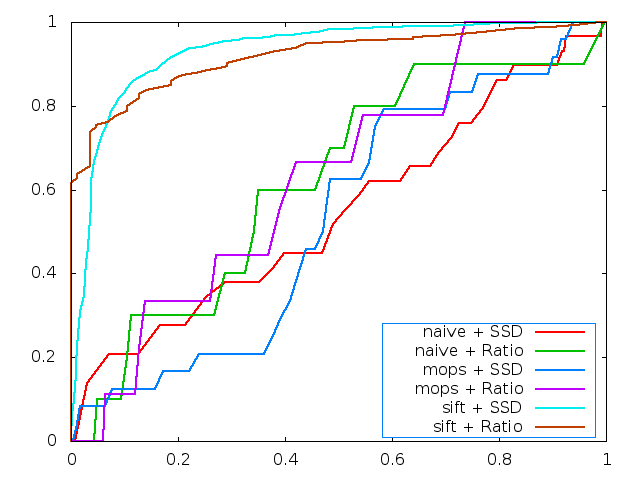
Below are a comparision of performance of the two descriptor, when
using SSD matching. It could be seen obviously that SIFT serves the
best, with leading performance among the three. On the other hand,
there is relatively small difference between naive descriptor and mops
descripter. Yet mops desciptor still outperforms the naive descriptor
in general.
Yosemite ROC
plot:
Yosemite threshold plot
Graf ROC
plot
Graf threshold plot
3. Ratio Matching Algorithm
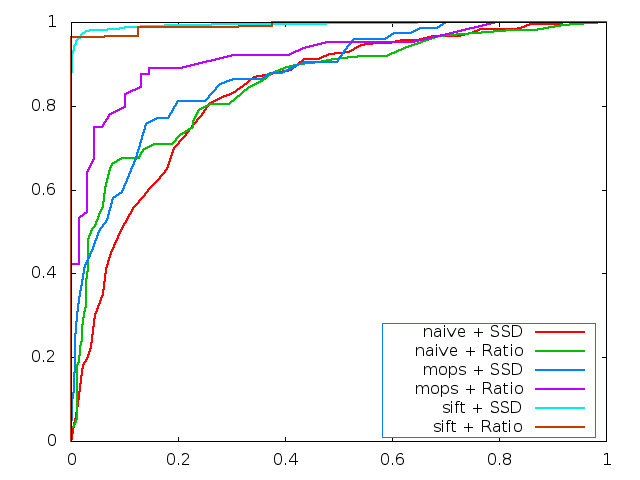
In addtion with the given SSD mathcing algorithm, I implemented SSD
Ratio matching algorithm, I will compare the performance of two
matching algorithms below.
Below are some comparison of Ratio and SSD matching on difference images :
Yosemite:
Graf
4. Experiments on Benchmark images
Below is a table showing the resting results of experimenting on Benchmark images.
For number of error pixels
|
naive+SSD
|
naive+Ratio
|
mops+SSD
|
mops+Ratio
|
bikes
|
473.678946
|
473.678946
|
433.568988
|
433.568988
|
graf
|
317.098707
|
307.646352
|
318.352372
|
306.970318
|
leuven
|
397.111416
|
397.111416
|
324.047320
|
195.330101
|
wall
|
362.361222
|
362.361222
|
321.561565
|
321.561565
|
For AUC
|
naive+SSD |
naive+Ratio
|
mops+SSD |
mops+Ratio |
biks
|
0.405101
|
0.524628
|
0.519000
|
0.567903
|
graf
|
0.472503 |
0.676933
|
0.510010
|
0.606283
|
leuven
|
0.492061
|
0.653848
|
0.713039
|
0.832068
|
wall
|
0.418162
|
0.589448
|
0.546393
|
0.821694
|
(Remark: it turns out that
threshold=5e-4 for feature detectors is too large for bikes set image,
I changed it to 1e-4 for experimenting on bikes. Others all remain
threshold 5e-4)
5. Experiments on my own images
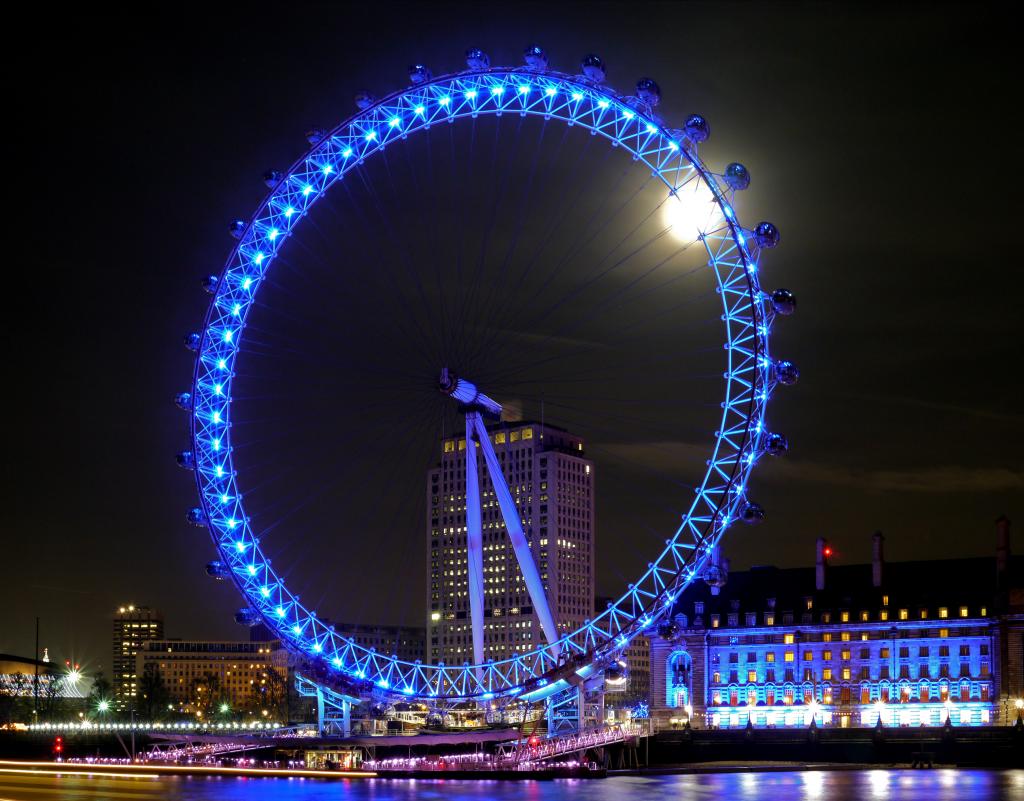
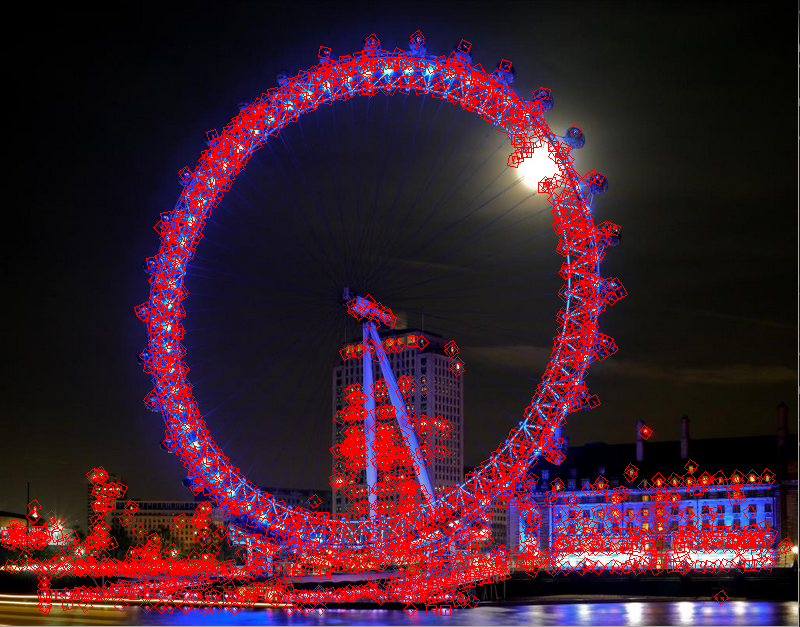
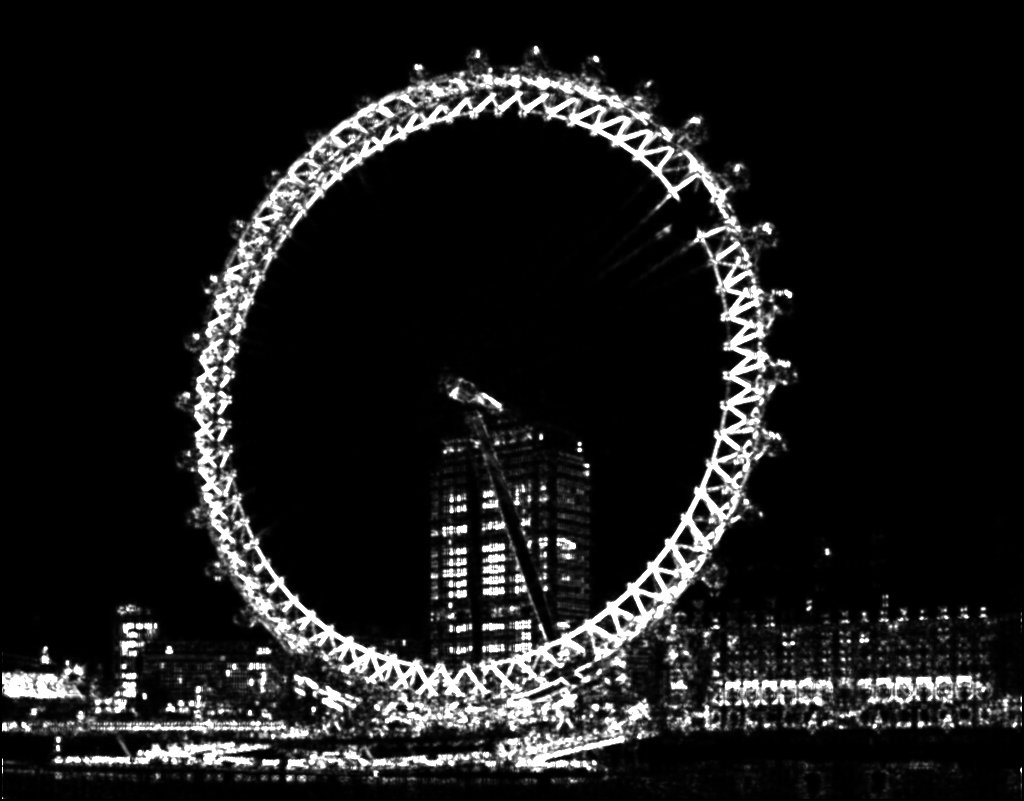
Since I don't have the homography file for my images, I could only test how feature detector works, and here are some result:
original image
whose computed results are as follows:
feature
selected:
harris image
(Remark, how to run the program: One can simply run the program by
running the command.sh bash file. In the file, one has the flexibility
of changing featuretype with 2 correponding to naive descriptor and 3
mops descriptor, and also matchtype with 1 corresponding to SSD
matching and 2 to Ratio matching. Notice, one might need to modifyt
file path.)


