1. Testing recognition with cropped class images
Use the cropped, non-smiling students (in class_nonsmiling_cropped) to compute 10 eigenfaces. Show the average face and eigenfaces.
![]()
![]()
![]()
![]()
![]()
![]()
![]()
![]()
![]()
![]()
![]()
Use the same set of images to compute a userbase.
Have the program recognize the cropped, smiling students.Plot the number of faces correctly recognized versus the number of eigenfaces used.

Note: black line describes the trend of MAP-Based Recognition method, while magenta line describes the trend of basic PCA.
Q1: Describe the trends you see in your plots. Discuss the tradeoffs; how many eigenfaces should one use? Is there a clear answer?
The basic trend in the plots is when the number of eigenfaces increases, the correct recognition ratio is also increasing. But the basic algorithm can not recognize me, which makes me very depressive. So I have to choose the method MAP-Based Recognition in paper "Principal Manifolds and Probabilistic Subspaces for Visual Recognition", which has the best recognition accurancy compared with PCA, ICA and KPCA. Eventually, I was recognized!
Q2: About eigenfaces number, what is small(to decrease the computation complexity) but can get relatively good recognization ratio is a good choice. I think the local steady state in this figure is a good answer, i.e. about 10 in both methods.
You likely saw some recognition errors in step 3; show images of a couple. How reasonable were the mistakes? Did the correct answer at least appear highly in the sorted results?

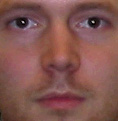
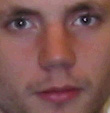
In this example, Face 'smiling_cropped/treuille.tga' recognized as being closest to:
0: nonsmiling_cropped/hoyt; MSE: 1229.67
1: nonsmiling_cropped/gauthier; MSE: 1351.83
2: nonsmiling_cropped/treuille; MSE: 1367.14
The right face is ranked in No. 3.
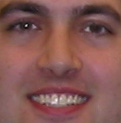
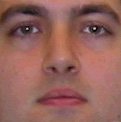
I also chose a image which can not been recognized by both methods, and in the sorted results, the true face is ranked out of top ten by the basic method, while ranked 2 by MAP-Based Recognition.

2. Cropping and finding faces
Use the 10 eigenfaces file computed in the previous problem.
Use your program to crop the aseem.tga image. Use min_scale,max_scale, step parameters of .45, .55, .01.
min_scale: 0.45, max_scale: 0.55, step: 0.01
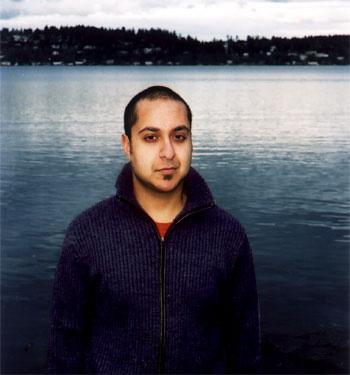

Find a digital picture of yourself; if you really don't have one, use any portrait on the web. Use your program to crop the picture.
min_scale: 0.1, max_scale: 0.2, step: 0.01
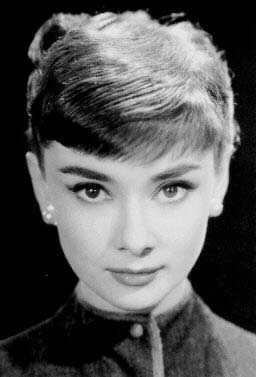
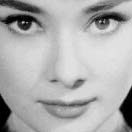
Experiment with min_scale, max_scale, and step parameters to find ones that work robustly and accurately.
Find the faces in two different photos (use the crop=false option)
First, try the group1.tga image given;
min_scale: 0.95, max_scale: 1.05, step: 0.05
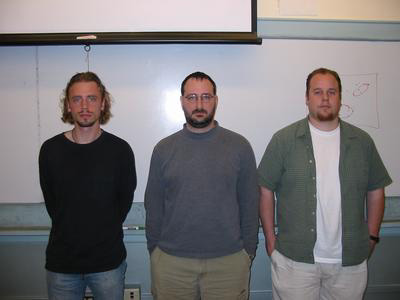
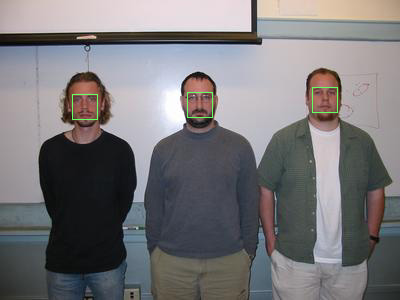
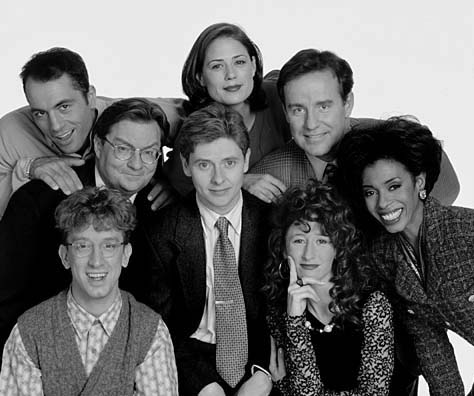
Find and try another group photo. This could be of family and/or friends, or one from the web. The photo should have at least four faces.
min_scale: 0.4, max_scale:0.6, step:0.05
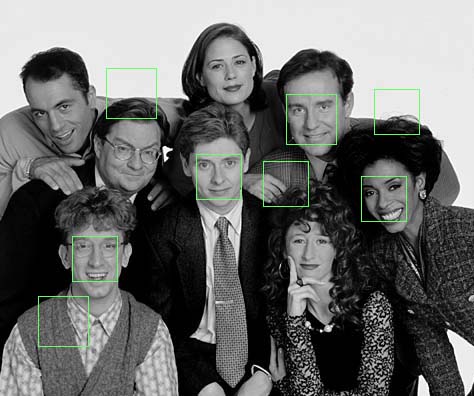
Q: Did you attempt to find faces result in any false positives and/or false negatives? Discuss each mistake, and why you think they might have occurred.
false positive ratio = false nective ratio = 50%. PCA is senstive to the illumination, and pose changes.
Extra Credit:
1. Implement the following speedup. This is a good extra credit item to try early on, as it will reduce the time taken to do the experiments!
2. Implement verifyFace as described in the list of methods to implement above. Perform the following experiment.
1). Use the cropped, non-smiling students to compute 6 eigenfaces.
2). Use the same set of images to compute a userbase.
3). Have the program verify the cropped, smiling student images in the smiling userbase. Test by verifying each student against his or her smiling face, as well as each student against a smiling face which is of someone else.
4). Experiment with various thresholds to find the one that gives the fewest false positives and fewest false negatives
Q1). What MSE thresholds did you try? Which one worked best? What search method did you use to find it?
I choose 60000 as the threshold. The threshold is found by maxmizing the ratio: (1-false positive rate)/false negtive rate.
Q2).Using the best MSE threshold, what was the false negative rate? What was the false positive rate?
false negtive rate is about 18.75%, and false positive rate is about 25%.
3. Try using kernel PCA, or some non-linear variant of PCA. A good starting point is the following survey paper. Compare the results using standard PCA.
I tried the method Bayesian similarity matching in this survey paper. Please refer to the recognition part for details.