Overview
In this project, we will use Mininet to study the dynamics of TCP and the bufferbloat phenomenon.
- First, you need to complete the TODO fields in the skeleton code of our experiment framework.
- Then, you will generate experiment results using the framework, and answer the questions listed later in this document.
Background
For general background on Bufferbloat, look at the following article: BufferBloat: What's Wrong with the Internet?. View this refresher on how to work with the Mininet environment and the official documentation of Mininet Python API.
Software Defined Networking and Open Flow
Software-Defined Networking (SDN) is a recently proposed networking paradigm in which the data and control planes are decoupled from one another. One can think of the control plane as being the networks "brain", i.e., it is responsible for making all decisions, for example, how to forward data, while the data plane is what actually moves the data. In traditional networks, both the control- and data planes are tightly integrated and implemented in the forwarding devices that comprise a network. The SDN control plane is implemented by the "controller" and the data plane by "switches". The controller acts as the "brain" of the network, and sends commands ("rules") to the switches on how to handle traffic. OpenFlow has emerged as the de facto SDN standard and specifies how the controller and the switches communicate as well as the rules controllers install on switches.
Mininet
Mininet is a software stack that creates a virtual network on your computer/laptop. It accomplishes this task by creating host namespaces (h1, h2, etc) and connecting them through virtual interfaces. So when we run ping between the linux namespaces h1 and h2, the ping will run from h1s namespace through a virtual interface pair created for h1 and h2, before it reaches h2. If h1 and h2 are connected through a switch as shown in the python code in the Mininet walkthrough, the ping will transit multiple virtual interface pairs. The switches that we will be using are running OpenVSwitch (OVS), a software-defined networking stack. Mininet will connect additional virtual interfaces between each virtual port on the switch with each connected host. The host name space allows each host to see the same file system, but operates as its own process that will run separately from each of the other host processes. The OVS version running on the Ubuntu image supports OpenFlow.
Part 1: Mininet Primer
Virtualbox and Mininet Installation
Mininet is a virtual machine image with a number of network emulation tools built into it. The first step of getting mininet set up is to install a Virtualization Platform. We suggest VirtualBox, an open source and freely available stack. The manual is available here. If you wish to use other virtualization platforms that's fine, but the TAs and staff will not support them. There are a well known set of issues in using virtualization. If you encounter issues, reach out online and we'll see how we can help. Some common issues and answers are:
- Did you download the correct version? (32-bit vs 64-bit)
- Is your computer really old? It might not be able to be virtualized -- talk to the TA.
- Make sure that virtualization is enabled in your BIOS.
Mininet Installation
With VirtualBox (or other virtualization platform) installed, we now need to grab the Mininet image from here. It is based off an older Ubuntu 14.04 and includes a default set of mininet binaries and example scripts. Once you've downloaded an image that fits your own VM installation, import and it and boot the VM.
Using mininet
Using mininet is described here. You can run it by typing: sudo mn Inside of the the mininet CLI, try running other commands like help, net, nodes, links and dump. Mininet starts with a default network that you can poke at. Find the mac address of the hosts, the ethernet ports connected, and the hostnames in the system.
eth1 interface as mentioned in the tutorial is visible. If not done correctly you will only see the interfaces lo0 and eth0. This will also ensure that you can establish an ssh connection to the VM instead of using the virtualbox terminal.
Introduction
In this project we will study the dynamics of TCP in home networks. Take a look at the figure below which shows a "typical" home network with a Home Router connected to an end host. The Home Router is connected via Cable or DSL to a Headend router at the Internet access provider’s office. We are going to study what happens when we download data from a remote server to the End Host in this home network.
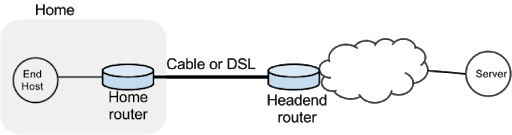
In a real network it’s hard to measure cwnd (because it’s private to the server) and the buffer occupancy (because it’s private to the router). To ease our measurement, we are going to emulate the network in Mininet.
Goals
- Learn first-hand the dynamics of TCP sawtooth and router buffer occupancy in a network.
- Learn why large router buffers can lead to poor performance. This problem is often called "bufferbloat."
- Learn how to use Mininet to create network topologies, run traffic generators, collect statistics and plot them.
- Learn how to package your experiments so it’s easy for others to run your code.
Assignment
Download Instructions
Run the following command to download the necessary skeleton code in compressed format onto the development machine.
wget https://courses.cs.washington.edu/courses/cse550/21au/pa/pset2code.zipExtract the downloaded file using
unzip by running unzip pset2code.zipIn order to test webpage fetch time and make plots, you also need to install
curl and matplotlib onto the machine or in the virtual environment (virtualenv / pipenv) for python being used for the project.
| File | Purpose |
|---|---|
bufferbloat.py |
Creates the topology, measures cwnd, queue sizes and RTTs and spawns a webserver. |
plot_queue.py |
Plots the queue occupancy at the bottleneck router. |
plot_ping.py |
Parses and plots the RTT reported by ping. |
plot_tcpprobe.py |
Plots the cwnd time-series for a flow specified by its destination port. |
run.sh |
Runs the experiment and generates all graphs in one go. |
README |
Where you will write the instructions of the scripts and answers to the questions. |
Tasks
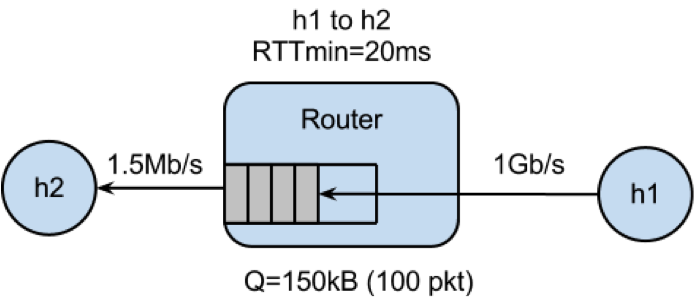
Within Mininet, create the following topology. Here h1 is your home computer that has a fast connection (1Gb/s) to your home router with a slow uplink connection (1.5Mb/s). The round-trip propagation delay, or the minimum RTT between h1 and h2 is 20ms. The router buffer size can hold 100 full sized ethernet frames (about 150kB with an MTU of 1500 bytes).
Then do the following:
- Start a long lived TCP flow sending data from h1 to h2. Use
iperf/iperf3. - Start back-to-back ping train from h1 to h2 10 times a second and record the RTTs.
- Plot the time series of the following:
- The long lived TCP flow’s cwnd
- The RTT reported by ping
- Queue size at the bottleneck
- Spawn a webserver on h1. Periodically download the
index.htmlweb page (three times every five seconds) from h1 and measure how long it takes to fetch it (on average). The starter code has some hints on how to do this. Make sure that the webpage download data is going in the same direction as the long-lived flow. - The long lived flow, ping train, and webserver downloads should all be happening simultaneously.
Repeat the above experiment and replot all three graphs with a smaller router buffer size (Q=20 packets).
Questions
Include your answers to the following questions in your README file. Remember to keep answers brief.
- Why do you see a difference in webpage fetch times with short and large router buffers?
- Bufferbloat can occur in other places such as your network interface card (NIC). Check the output of
ifconfig eth0on your VM. What is the (maximum) transmit queue length on the network interface reported by ifconfig? For this queue size, if you assume the queue drains at 100Mb/s, what is the maximum time a packet might wait in the queue before it leaves the NIC? - How does the RTT reported by ping vary with the queue size? Write a symbolic equation to describe the relation between the two (ignore computation overheads in ping that might affect the final result).
- Identify and describe two ways to mitigate the bufferbloat problem.
Deliverables
- Final Code: Remember one of the goals of this assignment is for you to build a system that is easy to type run to reproduce results. Therefore, your final code MUST be runnable as a single shell command
(sudo ./run.sh). We will test your code in the same setup. - README: A file named README with instructions to reproduce the results as well as the answers to the questions in the previous section. Please identify your answers with the question number, and please keep your answers brief.
- Plots: There should be 6 plots in total, 3 each for router buffer sizes 100 and 20 packets. They MUST have the following names and be present in the top level directory of your submission folder.
buffer-q100.png, cwnd-q100.png, rtt-q100.pngbuffer-q20.png, cwnd-q20.png, rtt-q20.png
Notes
Do not run the starter code unless you fill in code to create a topology in the class BBTopo. Otherwise, it will fail.
When running the curl command to fetch a web page, please fetch {{webserver_ip_address}}/http/index.html by replacing the {{webserver_ip_address}}.
If your Mininet script does not exit cleanly due to an error (or if you pressed Control-C), you may want to issue a clean command sudo mn -c before you start Mininet again.
Submission
Archive the materials (code, README or any other documentation) into a single .zip or .tar file named {{uwnetid}}.(tar|zip) and submit the same on canvas. Each team member has to submit the files individually.