Assignment 3: Creating Interactive Visualizations
In this assignment, you will explore the issues involved in implementing interactive visualization software. You must choose the data domain as well as the techniques you wish to implement. For example, the zipdecode and NameVoyager applications shown in class apply the interactive technique of dynamic queries – first explored in the HomeFinder application – to the problem of uncovering patterns in zip codes and baby names. Similarly, treemaps were originally developed to display hierarchical file structure, and were later adapted to the problem of interactively depicting a map of the stock market. We have seen many other examples of interactive visualization techniques in class and in the readings. The goal with this assignment is not only for you to gain hands-on experience implementing a visualization technique, but also for you to think about the effectiveness of the specific visualization techniques you re-implement in the context of the data domain you work with.
One challenge is to scope the assignment so that you can finish it within two weeks. You should find 1-2 partners for this assignment. Groups of four or more are not allowed. Your group must write code for this assignment. You are free to write the code in any programming language/environment you prefer, including JavaScript, C++, Java, etc. In addition you may use any software toolkit to help you build the code. We have listed a few possible toolkits in the resources page. We would like you to submit either a final executable program that we can execute on either a Mac OS X or Windows machine, or better yet, a link to an online web-enabled visualization. If this is a problem for you, please talk to the course staff right away.
Deliverables
For this assignment you are responsible for the following:
1. Describe the data domain and storyboard the interaction techniques you will use. Start by choosing the data domain and interactive visualization techniques you will implement. Think about why the domain and the techniques are a good match for one another. Then write a description of the data domain and the interactive visualization application you will build. The description should include a storyboard of the interface/displays you will create. Be sure to explain the features of your application. Most importantly you should explain why the interaction techniques you will implement will be effective in the context of your data domain. The goal of this exercise is to think through the various concerns that go into the software implementation. This is why it is important that you perform this task first, before actually building the software. As part of your prototyping, you may find it helpful to use existing tools (e.g., Tableau or R) to explore the data and test multiple visualization strategies.
2. Implement your design. Use the programming language and toolkit of your choice to implement your design. While D3 is the "official" supported framework for the class, you may wish to spend some time looking into the variety of toolkits that are available. We have listed some of them in the resources page. You are free to use any available language and toolkit. If you are not using D3, just be sure to document your choice of tools and explain your decision.
Note: while you are free to use non-programming tools (e.g., Tableau or ggplot) to explore your data set and try out design ideas, you must program the final application yourself and submit your code. If you have any questions about the status of a given tool, please ask the course staff.
3. Produce a final writeup. Your final submission should include:
- The description with storyboards from part 1.
- A brief description of your final interactive visualization application.
- Your storyboard
- An explanation of changes between the storyboard and the final implementation.
- The development process. Include a breakdown of how the work was split among the group members. Include a commentary on the development process, including answers to the following questions: Roughly how much time did you spend developing your application (in man-hour)? What aspects took the most time?
- The source code for your application. Please ensure that the software submitted is in working order. If any special instructions are needed for building or running your software, please include them in the writeup too.
Data Sets
We placed a list of data sets in the resources page. However, your best bet is to pick a data set or domain that you are particularly interested in. Make sure to document where you get your data in your writeup of this assignment.
Grading Criteria
Projects that squarely meet the requirements for the assignment will receive a score of 9 (A). Going beyond the call of duty can net additional points, for example:
- extended data collection, or data streaming
- advanced interaction techniques
- novel visualization elements
- multi-view coordination
- thoughtful graphic design
Point deductions will be made when projects suffer from:
- errors or broken features
- questionable visual encodings
- confusing interface design or unhelpful interactions
- lack of exploratory interaction techniques
- incomplete write-up
Submission Details
You should work in groups of 2 or 3 for this assignment. You may not work in groups larger than 3 people. Your completed assignment is due on Monday May 4, by 5pm. If you are looking for a project partner, please post to the relevant Canvas discussion.
Submit your assignment on GitHub by following these instructions:
- Once you form a team, please complete this form by Friday 4/24. We will add you to our CSE512-15S organization on GitHub and create a team and a repository for you--both named using the patten a3-uwnetid1-uwnetid2 Please contact us as soon as possible if you can't access the GitHub organization.
- The repository is public by default so people can see your work. If you have any restriction such as data privacy, you can make it private. You are also free to make it private while you develop the assignment and make it public once you finish.
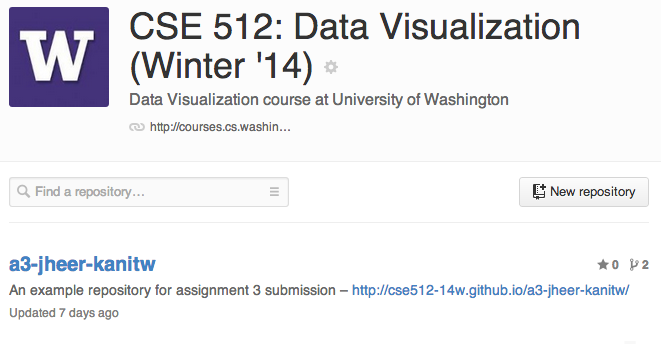
- Use our a3-jheer-domoritz-jsnydes repository as a template for submission. Basically, your repository should contain your writeup (readme.md) and your code. You can download the repo as a zip file and unzip it on your local repository or clone it and use it as a starting point for your project.
- For your write-up (readme.md), please include a description of the visualization, running instructions, storyboard, changes between the storyboard and the final visualization and the development process.
- Put your final source code in the master branch. If your application is web-based, it would be great if people can see it online. Github Pages is an easy way to show your work online so people can easily access it. Basically, put your main page in index.html and create a branch named gh-pages. If nothing goes wrong, your code in gh-pages should become available online at http://cse512-15s.github.io/your-repo-name within 10 minutes. Note that GitHub Pages only supports vanilla HTML/CSS/JS; it does not support server-side logic (e.g., PHP, Ruby, Python).
- To facilitate navigation in the CSE512-15S page, write one-line describing your work and put a link to your final work for your visualization (if available).
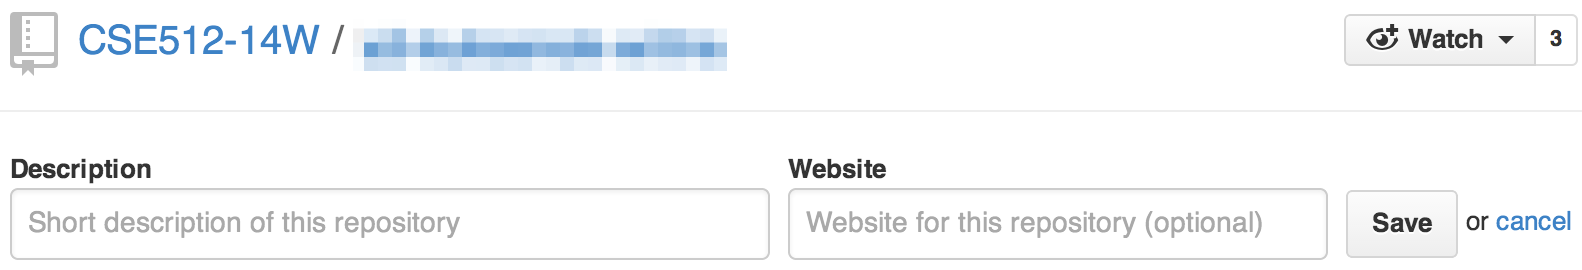
To display url in the repos list page, append the url to description (NOT in the website box).
Right after the deadline, we will pull your work from the master branch for grading. Thus, please put your final code in the master branch. If you submit late, please email us (cse512@cs) after you submit so we can re-pull your repository.
Resources
Git
If you are not familiar with Git and Github, see the resources page.
Markdown
Learn about Markdown Basics and Github Flavored Markdown. Sublime Text has some nice markdown plugin as well.