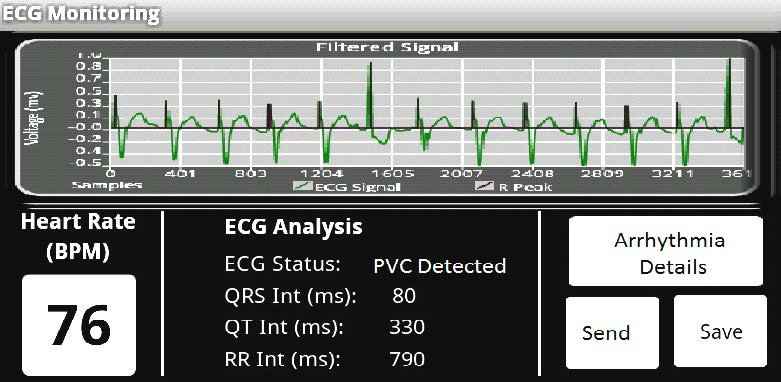
An display example which you can modify is shown in Figure 13 of the above paper:

Tailor your display to fit the information you detect.
In this lab you'll use the basic recorder you built in Lab 8. Don't proceed until that lab is finished and working correctly..
In this lab, you will add performance improvements and new features:
...in other words, ...surprise me...!!!
Copy your code from Lab 8 to a new sketch called HeartMonitor.ino. Add some digital filtering to your code to smooth and clean your signal. See the lecture notes on Digital Filtering for notes on filter characteristics and bandwidths.
Note: This processing should be added before the data is written to the display or to the file on the SD card.
A lowpass Butterworth 4-pole IIR filter, an FIR lowpass filter or a moving-average filter are possible choices. Experiment with filter orders, lengths and frequencies to find the optimum compromise between useful information and noise elimination.
A good tool is the Interactive Filter Design Tool- IIR and FIR with C code shown above.
Implement a QRS detection algorithm of your choice, derive the Heart Rate and and display it, in Beat-per-Minute (BPM). In your code comments, include a brief explanation of how your algorithm works. See the references above, particularly the paper Real Time ECG Feature Extraction, and the lecture slides on QRS detection. Accurate detection of the R-peak of the QRS complex is crucial to the success of additional detection algorithms.
Notes:
Implement as many detectors as you can to identify several types of heart Arrhythmia:
For information about these see the lecture notes and the paper Real Time ECG Feature Extraction.
You should display your results on screen, and write your results to the file on the SD card.
An display example which you can modify is shown in Figure 13 of the above paper:

Tailor your display to fit the information you detect.
50 points is a 4.0; you can get up to 63 points possible
Demo: 1 pt each
- _____Successful Demo of basic ECG display, smooth and appropriately filtered
- _____Heart Rate measurement, correctly detected
- _____file-writing
- _____Bradycardia
- _____Tachycardia
- _____Premature Ventricular Contraction (PVC) (algorithm explained in Theory of Operation)
- _____Premature Atrial Contraction (PAC) (algorithm explained in Theory of Operation)
- _____File browser capability and recall from SD card
- _____Ability to scroll through a recalled file
- _____Arrhythmia detection information written to file and displayed
- _____Neat wiring
- _____2X-Bluetooth connection for HR as in IV.3 above
Code: 1 pt each
- _____Clear comments
- _____Short interrupt service routines (ISR), no screen, card, or debug writing
- _____3X-PDB triggering ADC conversion, no AnalogRead() used.
Theory-of-operation document:
- _____Understandable.
- _____Additional points for an outstanding implementation (up to 3)
Total:_________x3 = ______________Final Projects demo and turn-in: Friday, December 11, 2015, 12:30-2:30, in CSE003