In this lab, you will use the built-in 16 bit Analog to Digital converter and the Programmable Delay Block. Then we will do some signal analysis.
A. Write a sketch that outputs a sine wave to the 12-bit built-in DAC on the Teensy ARM processor.
Set the resolution to 12 bits in setup. Refer to this page for information on the DAC and an example:
https://www.pjrc.com/teensy/teensy31.html
Connect channel 1 of your scope to pin A14 as shown. Hook your scope probe in the empty hole.
Set up your scope to trigger on channel 1, and obtain a stable display.
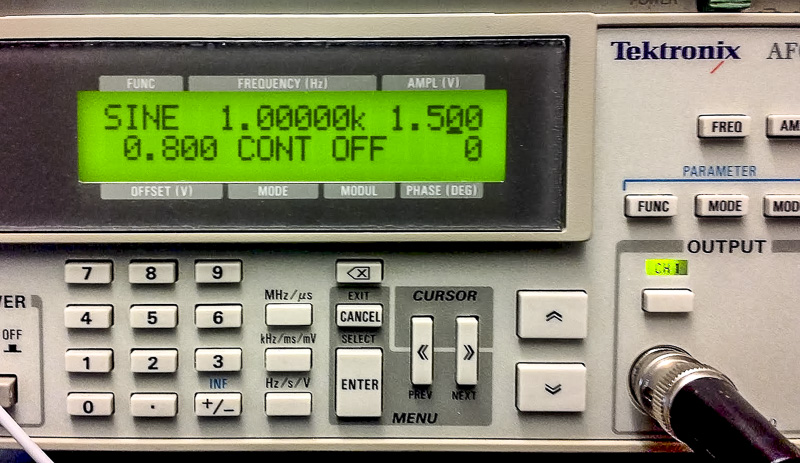
B. Now, set up your function generator like this:

Sine wave output, 1.5 volts amplitude, 0.8 volts offset, and continuous mode, no modulation.
The function generator will output a bipolar signal as default, and it is important to set the amplitude and offset to make the signal unipolar and within the min-max voltage range of the ADC.
Connect channel 2 of your scope to the function generator output and check that the signal range is correct.
Now, connect the function generator to an Analog input on the Teensy, and construct a sketch that reads the analog input and writes the data to the output.
Remember to set both input and output resolution to 12 bits.
	analogWrite(A14, analogRead(A0));

You should see something like this: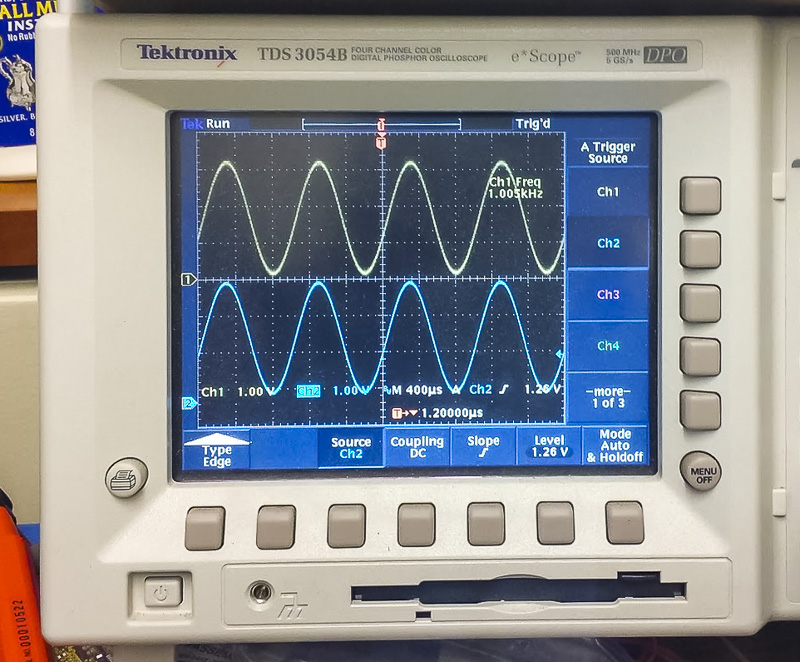
Trigger on channel 2, the input.
Now, using
delayMicroseconds(50);
experiment with changing the sampling frequency. Calculate the sample rate from the period, and then the Nyquist frequency.
C. Change the function generators frequency to a number near the Nyquist frequency. As you increase the sine wave frequency toward and higher than the Nyquist frequency, notice what happens to the output of your DAC on channel 1 of the scope.
Purpose: direct programming of Arm Cortex hardware registers
References: Chapter 35, Programmable Delay Block (PDB) in the MK20DX256 Manual
kinetis.h and main.cpp located in C:\Program Files (x86)\Arduino\hardware\teensy\cores\teensy3
These files define the hardware locations of registers and their control bits for the Arm Cortex M4 processor on the Teensy board.
Find the section on the Programmable Delay Block (PDB) for the relevant register addresses.
Construct a sketch called PDBblink.ino that does the following:
In setup, initialize the Programmable Delay Block as follows:
Enable the PDB clock
   SIM_SCGC6 |= SIM_SCGC6_PDB;
Modulus Register, 1/(48 MHz / 128 / 10) * 37500 = 1 s
 PDB0_MOD = 37500;  //1 = 9.36khz
Interrupt delay = 0
Set PDB status and control bits to 1:
 PDB_SC_TRGSEL(15)        Select software trigger
 PDB_SC_PDBEN             PDB enable
 PDB_SC_PDBIE             Interrupt enable
 PDB_SC_CONT              Continuous mode
 PDB_SC_PRESCALER(7)      Prescaler = 128
 PDB_SC_MULT(1)           Prescaler multiplication factor = 10
PDB0_SC = (or of the above bits)
Hint: double check the order of the bits in the definition of PDB0_SC in the manual.
Software trigger (reset and restart counter)
 PDB0_SC |= PDB_SC_SWTRIG;
Load OK
 PDB0_SC |= PDB_SC_LDOK;
Enable interrupt request
 NVIC_ENABLE_IRQ(IRQ_PDB);
Your loop should be empty. There is nothing to do, unless you want to draw something on the LCD.
void loop() {}
Finally write the PDB interrupt routine:
void pdb_isr() {
   digitalWrite(13, (ledOn = !ledOn));// invert the value of the LED each interrupt
   PDB0_SC = PDB_CONFIG | PDB_SC_LDOK; // (also clears interrupt flag)
}
Your LED should blink one second on, one second off.
Now, modify the sketch to blink at a frequency of 120 Hz.
Purpose: automate conversion to minimize jitter, and create larger blocks for foreground processing
References: Chapter 31, Analog-to-Digital Converter (ADC) in the MK20DX256 Manual
Chapter 20, Direct Memory Access Multiplexer (DMAMUX) in the MK20DX256 Manual
Download and run ADCpdbDMA.ino. In this sketch, the PDB triggers the ADC every second. Once a conversion is finished the ADC requests a data transfer from the DMA and it stores the value in a buffer. The interrupts are enabled just to see some progress in the serial monitor.
Study the sketch, referring to the relevant chapters in the manual. Note the printout sequences and timings for the various interrupts.
Modify the sketch to turn off the ADC and PDB interrupt enables, leaving only the DMA interrupt. Run it, and ensure that the DMA interrupt is still printing.
Now set up the system to sample the input at 10kHz. Modify the sketch to print the elapsed time between DMA interrupts.
Purpose: perform a Fast Fourier Transform on the ADC input data, and display it.
References: Teensy Audio library and the Audio System Design Tool
http://www.pjrc.com/teensy/td_libs_Audio.html
If the Audio library is not installed (symptom: there are no examples showing called Audio), download and install the library:
http://www.pjrc.com/teensy/arduino_libraries/Audio.zip
How to install libraries: Unzip and place the Audio library folder in your arduinosketchfolder/libraries/ folder. You may need to create the libraries subfolder if it's your first library. Restart the IDE.
A. Explore the Audio Design Tool, which allows you to drag-and-drop sound modules and interconnect them.It exports header code. Note the rules for Audio Connections & Memory.
The first example below uses the following connections:
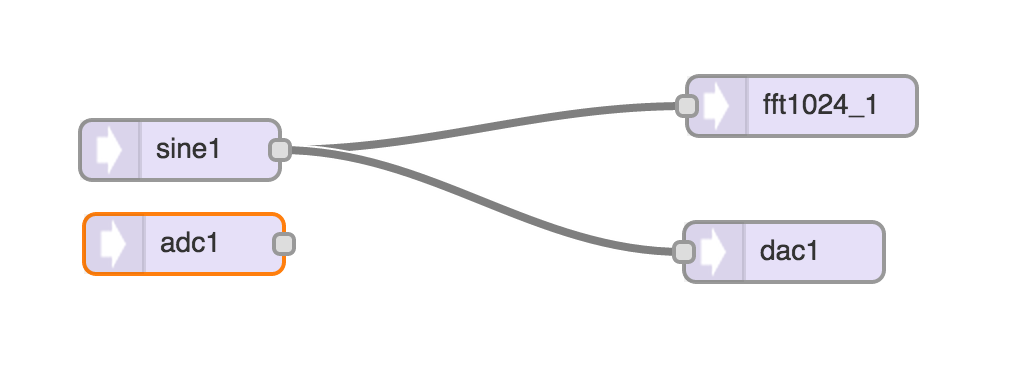
Download and run sineFFT.ino. This sketch uses the Audio Library functions to generate a sine wave and sends it to the DAC output. It also performs a 1024 point Fast Fourier analysis (FFT) of the data and prints the first 40 bins in the serial monitor window. Note that you can change the frequency and amplitude of the sine wave, and view the results in the debug window.
The FFT data is linear, so for audio and many other applications, a log approximation is needed. The read(firstBin, lastBin); function is able to sum several bins together.
Modify a copy of the sketch, called sineFFTlog.ino, and read the first 512 bins into 16 bins in a logarithmic approximation.
B. Re compile your sketch using the ADC input and a 100 Hz square wave from your function generator. Note the difference in printed output.
C. Make a new sketch called sineFFTsweep.ino, that sweeps the sine wave through the audio range.
D. Finally, you will plot your frequency data on the LCD.
A Spectrum analyser panel might look like these, with Frequency on the X axis and Amplitude on the Y axis:
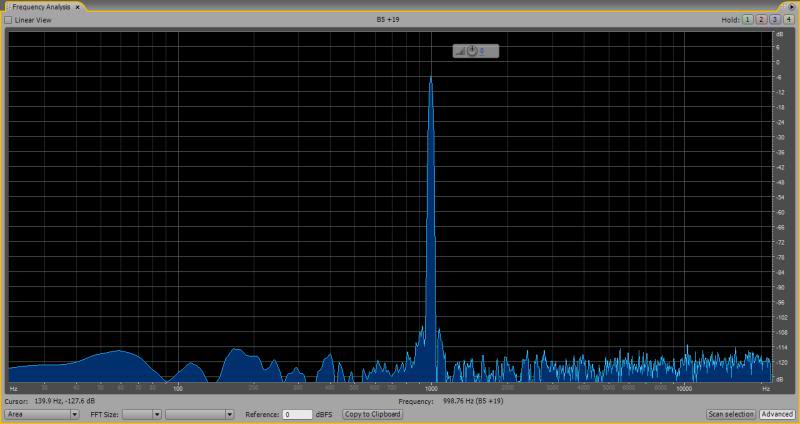
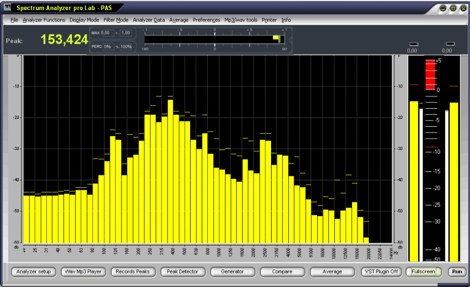
Make a sketch called spectrum.ino that plots the frequency data, either as a series of bar-graphs, or as a point-to-point plot. Calibrate the axes appropriately.
Question 5: How many FFTs per second can you display?