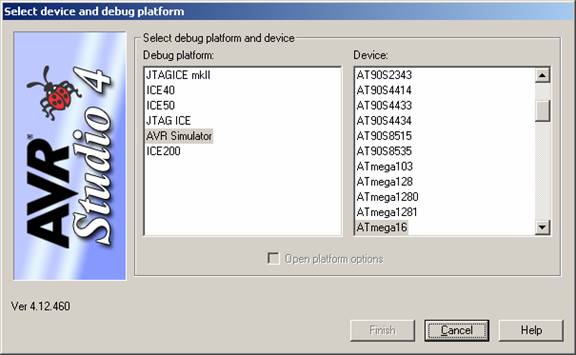
AVR Studio 4 has many interactive debugging features. For the purposes of this class the two basic methods you will use to debug are the AVR Simulator and the JTAG. At the bottom of your screen AVR Studio displays what device/chip it will interact with when debugging and which debugger it will use. Below is a picture of the Status Bar showing that the device is an “ATMega16” and the debug platform is the “AVR Simulator”.

To change the target device for debugging and/or the debug platform go to
the “Debug” menu and select the menu
option “Select device and debug platform.
” In this window you can select AVR simulator if you want to debug in
simulation or if you want to debug directly on your hardware choose either
JTAGICE or JTAGICE mkII (depending on which JTAG you
have at your station).

The debugger in
![]()
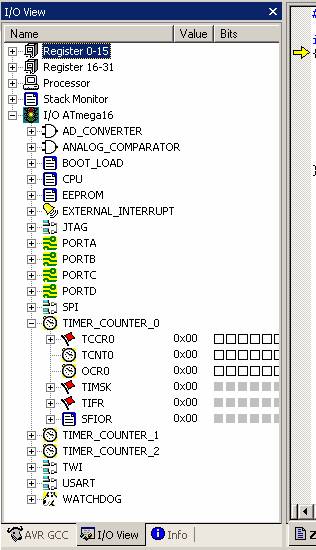
One of the most powerful features of the debugger is the ability to view the current states of any of the registers. You can view the current value of any register in the “I/O view” tab.

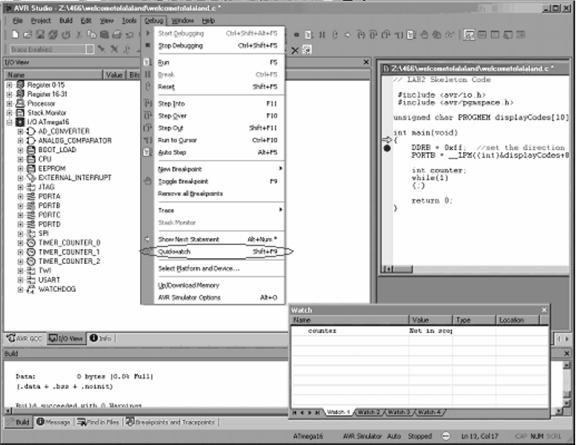
Another useful feature of the AVR Studio 4 debug system is the watch window which allows you to see what the value any variable is in the RAM. To view the current value of a variable use, add the variable to the watch window.
