Sequence with Kaiden panorama head
The panorama head worked pretty well for us, we took the pictures when there was pretty much no one else around so we didn't have very many problems with people or cars moving around.
There weren't any problems with the Kaiden head, but we did have some strange technical problems with the camera where it said there were no pictures but still complained that the memory card was full. However, after we fixed it the rest of the process went pretty smoothly.
We did not do anything out of the ordinary for this.

Sequence taken by hand
Similar to the sequence taken with the Kaiden head, we picked a fairly secluded area to take the pictures so we didn't have to worry about people moving around. The camera's stitch mode helped a lot in aligning the images and making sure they all overlapped enough.
We did not encounter any problems when taking the sequence by hand.
Same as before, we did not do anything out of the ordinary.

Test sequence
For the most part, getting the test sequence blended together went pretty well. There were some bugs during development but they were fixed pretty easily.
One thing that made it difficult was that some of the functions and variables weren't documented as well as they could have been.
We did not do anything out of the ordinary for this portion.
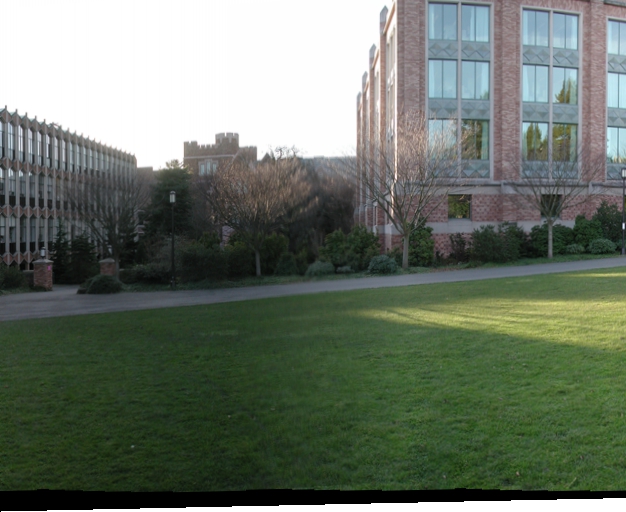
ROC comparison of our code vs. SIFT
Yosemite:
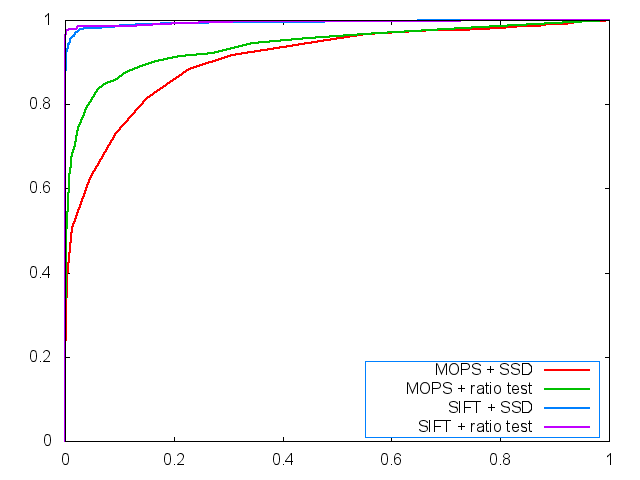
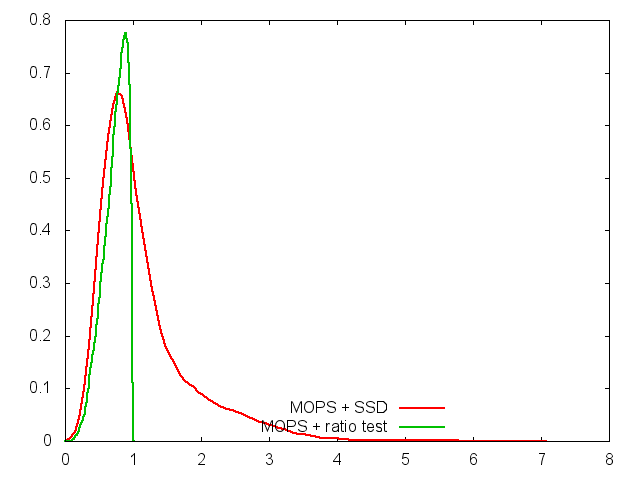
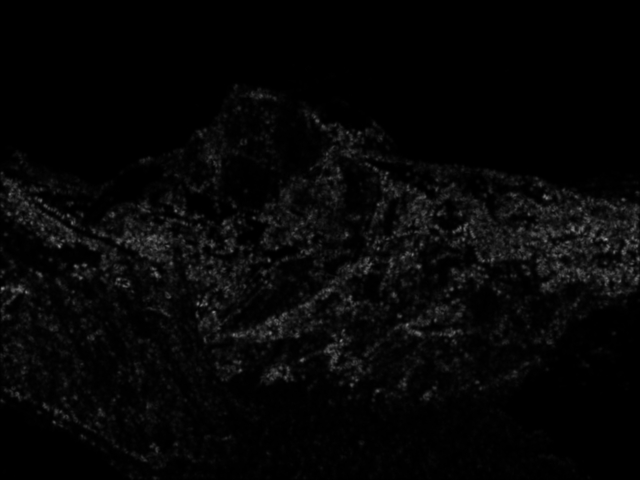
This set of graphs, generated based on the features detected in the Yosemite sample images show the performance characteristics of our feature detector, using both the SSD matching test and the ratio test.
The image on the left shows a ROC (receiver operating characteristic) plot, comparing our detector with SIFT, using both SSD and ratio matching functions. SIFT clearly outperforms our MOPS-based implementation (the SIFT curves are steeper and closer to the corner, so the true positive rate can reach fairly large ratios without the false positive rate increasing a lot). We also noted that for both detectors, the ratio test matching function resulted in better performance.
The graph in the center shows a plot of threshold on the x axis and the true positive - false positive rates on the y. This gives an estimate of the best threshold to use for our detector (for this particular pair of images at least).
The image on the far right shows the harris values computed for the second Yosemite image.
Graf:
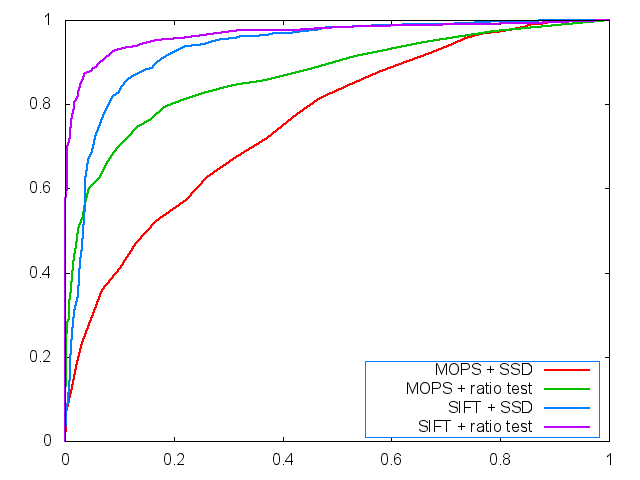
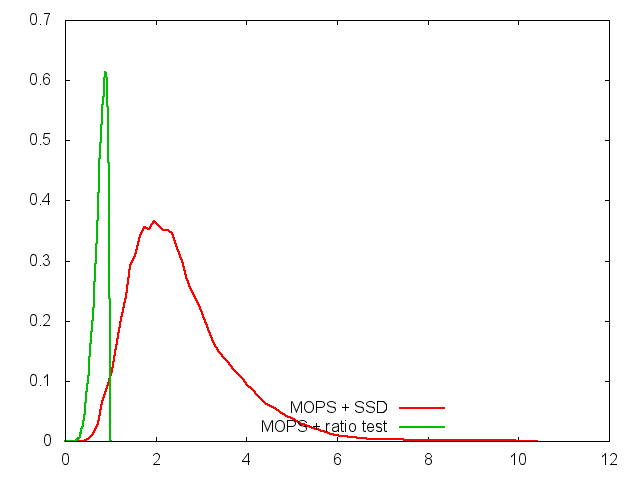
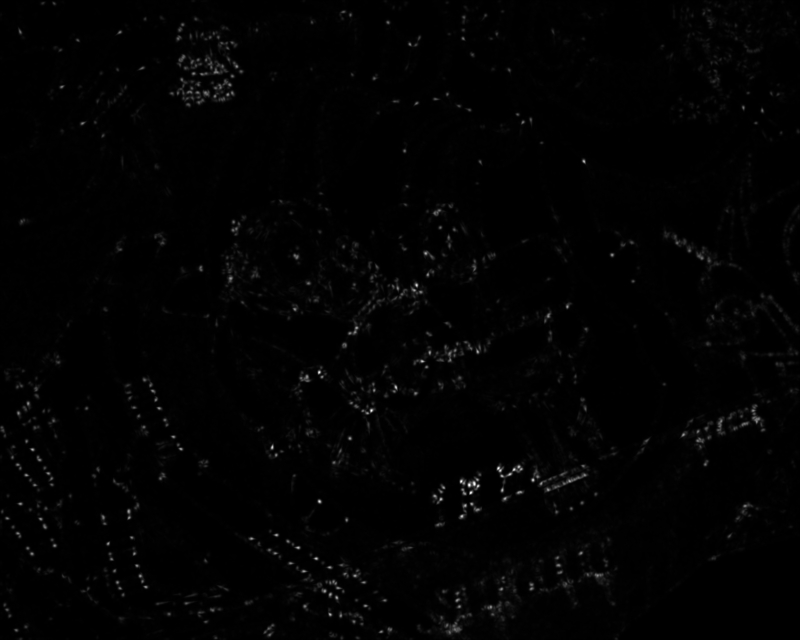
This set of graphs, generated based on the features detected in the 'graf' sample images show the performance characteristics of our feature detector, using both the SSD matching test and the ratio test.
The image on the left shows a ROC (receiver operating characteristic) plot, comparing our detector with SIFT, using both SSD and ratio matching functions. Once again, SIFT outperforms our implementation, and there is an even more notable gap between the SSD and ratio tests this time around, and overall performance was lower than the Yosemite images (it seems there are a lot of very similar features in the graffiti images).
The graph in the center shows a plot of threshold on the x axis and the true positive - false positive rates on the y. This gives an estimate of the best threshold to use for our detector (for this particular pair of images at least).
The image on the far right shows the harris values computed for the second graf image.