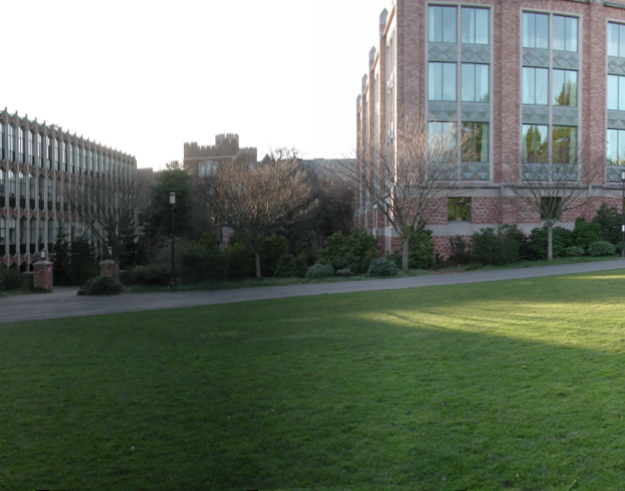
Sequence with Kaiden panorama head
The images combined very nicely into a panorama. The panorama was a little dark so it was lightened up in Photoshop. We also cropped the panorama
to get rid of any extra black space and jagged edges at the top and the bottom of the panorama. Looking closely at the image it is difficult to
detect edges between the images. Only the ghosting effect of people, who are on boundries of blended images, show where blending of edges is occuring.
When taking the images in the CSE atrium we found that the Kaiden Panorama Head was a little wobbly and there for it was somewhat difficult to keep it level.
Because the images were taken in an order that made the bricks the center and the main atrium the ends, we changed the image order.
The wobbly head and the reorder may have affected how the ends line up because.
Switching to handheld really emphasized how awesome the Kaiden panorama head is.The built in image aligning feature
in camera was very helpful.
Even with the built in image aligning taking photos that ligned up was was difficult. The program did do a good job of
combinging the images and making up for our unsteady hands.

"Hand-Held Panorama" by Brian Jensen and Matthew Barrie, CSE 455 Winter 2012 (
full size,
360° viewer)
ROC comparison of our code vs. SIFT
Yosemite Image Set
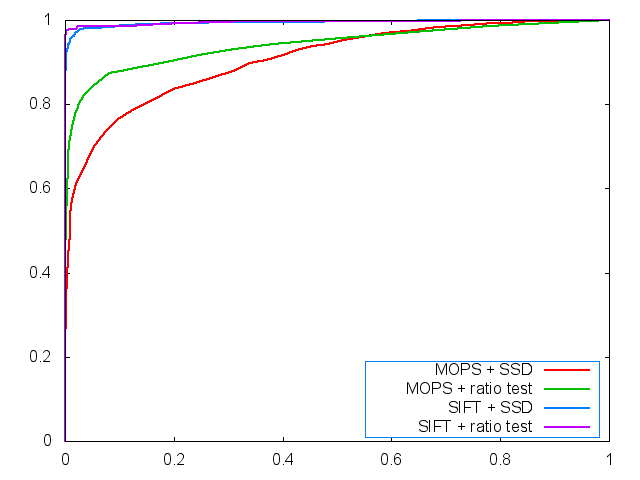
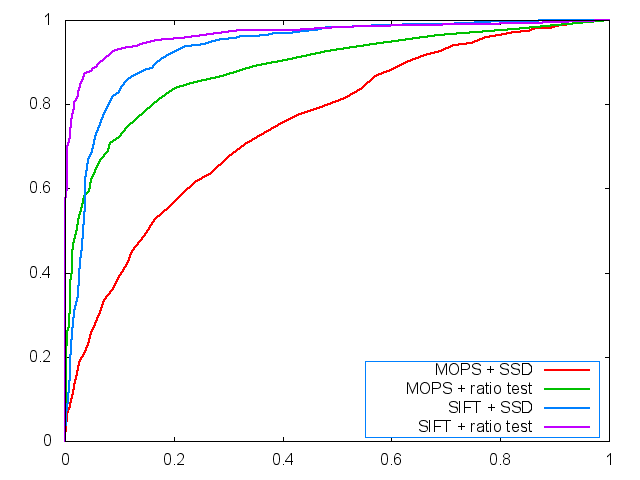
ROC comparison for Yosemite - MOPS+SSD (RED), MOPS+Ratio Test (GREEN), SIFT+SSD (BLUE), SIFT+Ratio Test (Purple)
This graph shows how the threshold affects the number of true and false positives. As the threshold grows the number of true positives increases
at a faster rate until the number of false positives grows rapidly. The goal is to maximize the area under the curve. This basically means that sift
has is a little better because it has the largest area under the curve. Also you can see from this graph the ratio test improves the output of
true positives and lowers the output of false positives. For this image there is a sharp turn between .1 and .2 on the x axis for Mops with SSD
and Mops with ratio test.
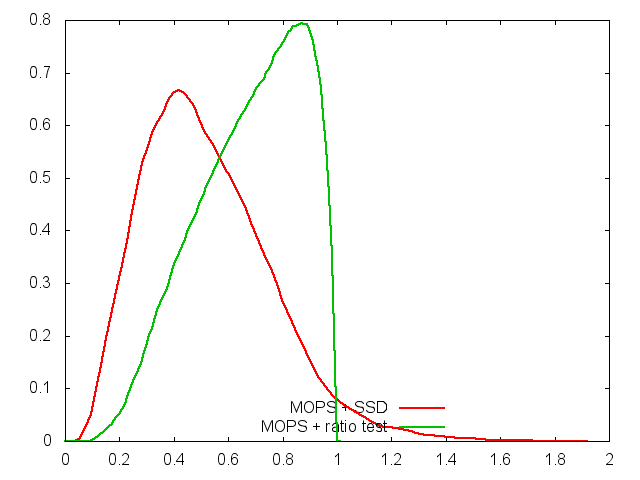
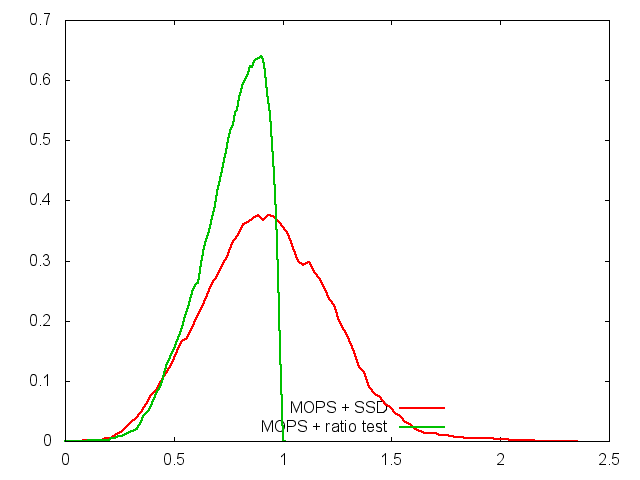
Threshold comparison for Yosemite - MOPS+SSD (RED), MOPS+Ratio Test (GREEN)
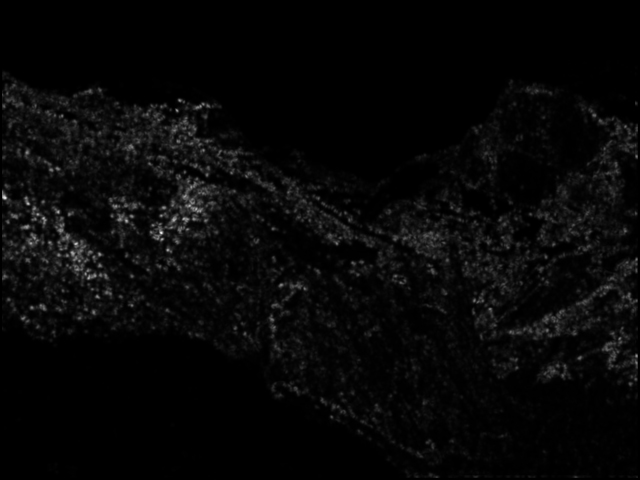
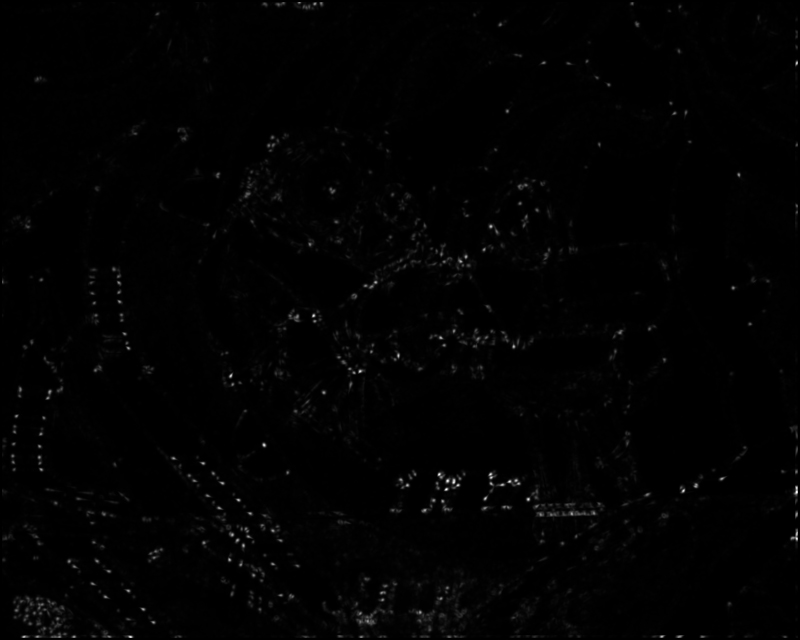
Harris image for Yosemite
Graf Image Set
ROC comparison for graf - MOPS+SSD (RED), MOPS+Ratio Test (GREEN), SIFT+SSD (BLUE), SIFT+Ratio Test (Purple)
This graph shows how the threshold affects the number of true and false positives. As the threshold grows the number of true positives increases
at a faster rate until the number of false positives grows rapidly. The goal is to maximize the area under the curve. This graph has more gradual
slopes for the curves. Still in this image SIFT out performs MOPS and the ratio test out performs SSD. The graph image is a little more complicated
with many similar areas so when the threshold gets larger not only do we get more true positives but we get more false positives a little faster than
with the yosemite images.
Threshold comparison for Graf - MOPS+SSD (RED), MOPS+Ratio Test (GREEN)
Harris image for Graf


