ROC curves
This section shows ROC curves and threshold plots for our feature dector and for the SIFT feature detector using both the SSD and ratio test distance metrics.
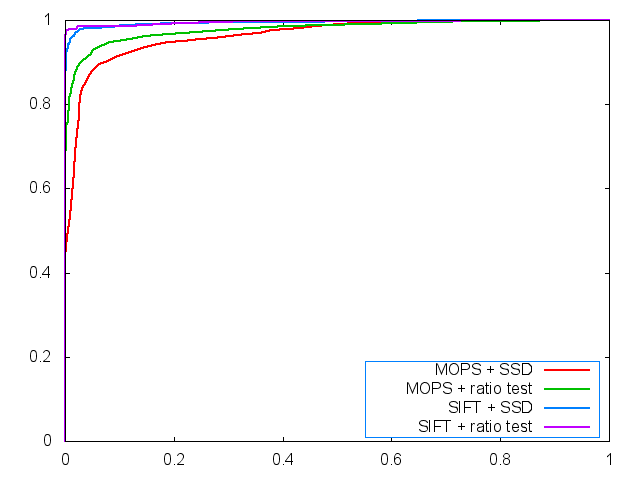
ROC curve plot for the Yosemite image set
|
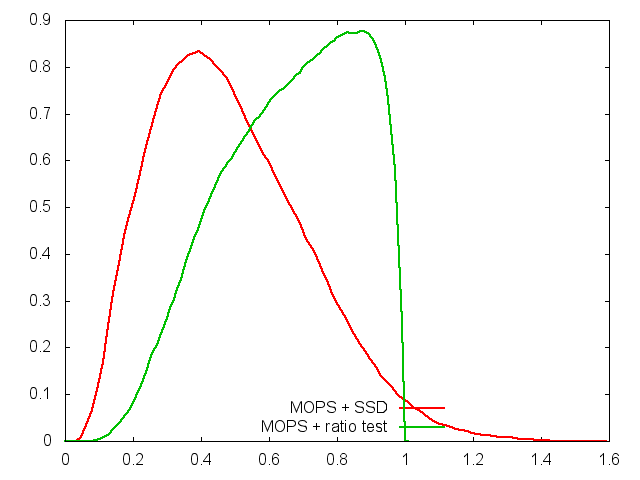
Threshold plot for the Yosemite image set
|
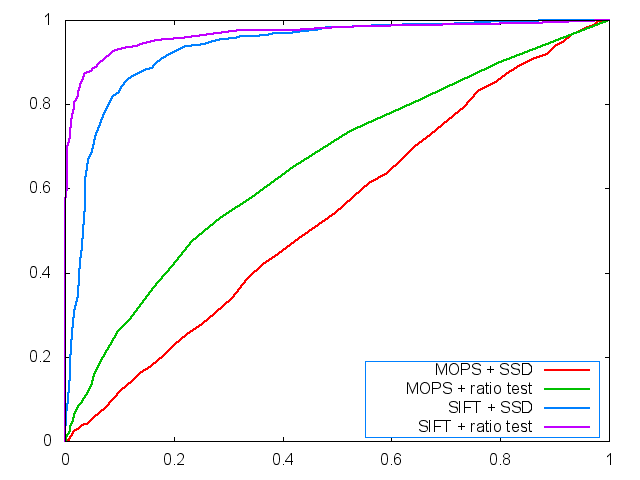
ROC curve plot for the graf image set
|
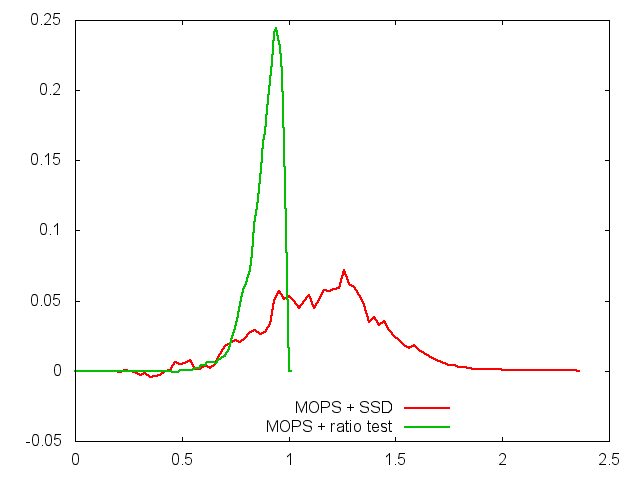
Threshold plot for the graf image set
|
In looking at ROC curves, more area under the curve generally equates to better performance. We can see that on the Yosemite image set our feature detectors are working almost as well as SIFT. We can also see that the ratio test tends to do better than plain SSD for both feature detectors. On the graf image set we see that SIFT dramatically out performs our feature detector and the difference between SSD and ratio test matching is much more pronounced. This might indicate the image is "harder" in some sense. Some further experimentation might reveal what properties of the image are causing the difficulty. The threshold plots show ideal tuning parameters for our feature detector using SSD and ratio test on both images.
Harris images
This section show the value of the harris operator for the graf1 and yosemite1 images. The images have been contrast and gamma adjusted to make the results of the Harris operator more visible.
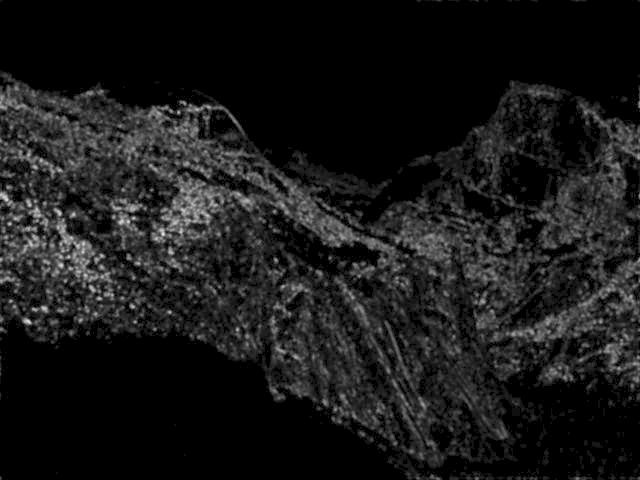
Harris operator for Yoesmite1.tga
|
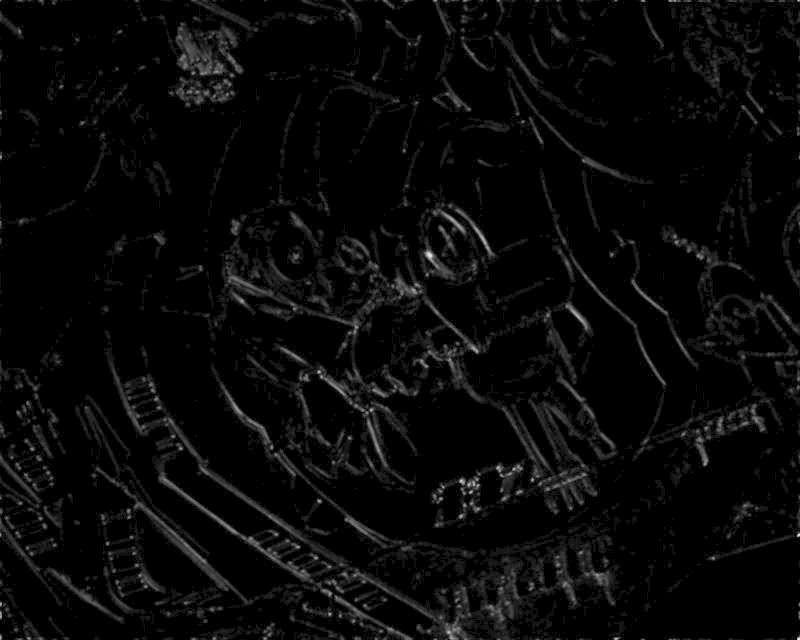
Harris operator for graf1.ppm
|
Extra credit
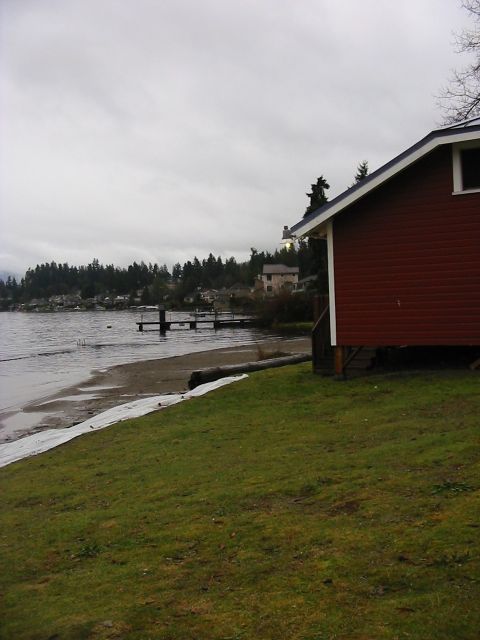
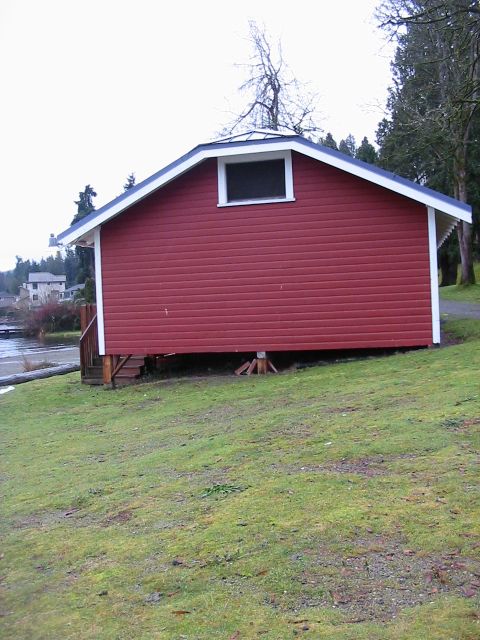
We implemented a refinement of our detector that is more invariant to contrast than the basic one. The implementation is simple, we simply normalize the values in the feature by diving by the maximum value. By doing this we reduce the expected distance between two features which have a similar distribution of values up to a scaling factor. The implementation of this feature detector was crucial to the creation of our panorama because of a stark change in contrast that occured when facing toward the lake.
|
|


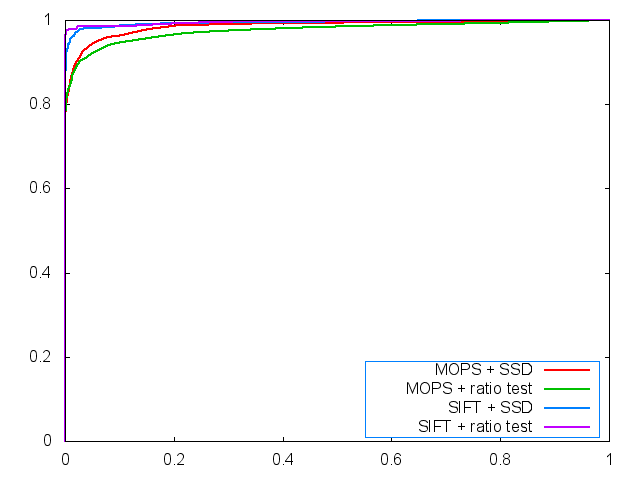
ROC curve plot for the Yosemite image set using contrast invariant detector.
|
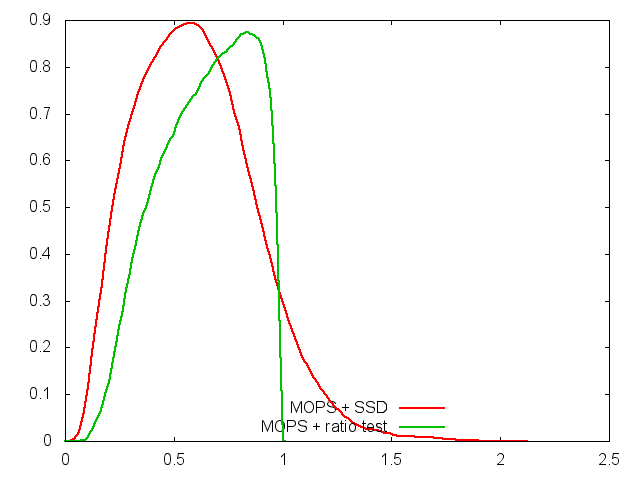
Threshold plot for the Yosemite image set using contrast invariant detector.
|
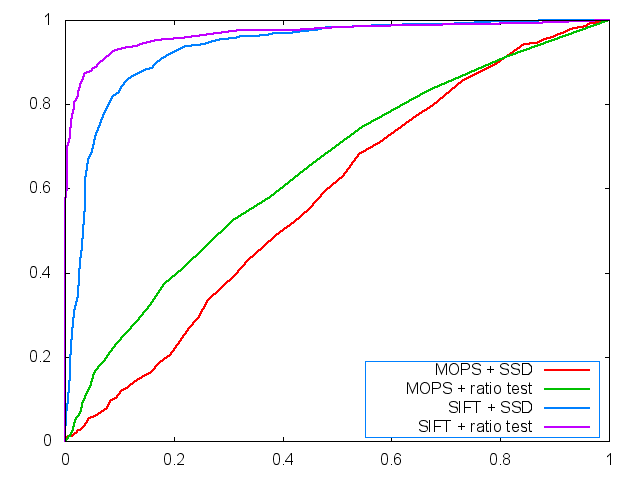
ROC curve plot for the graf image set using contrast invariant detector.
|
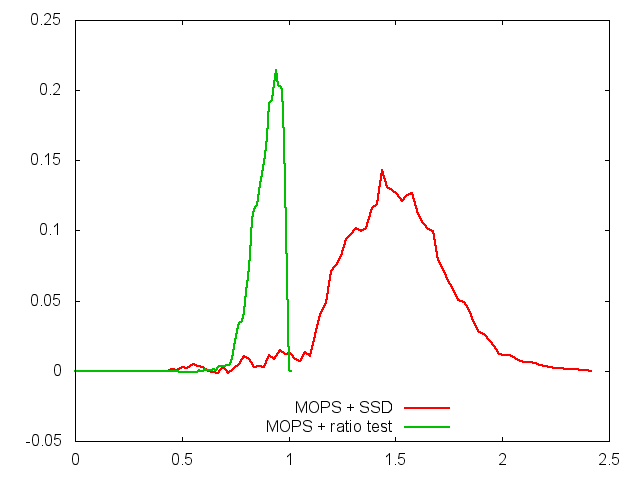
Threshold plot for the graf image set using contrast invariant detector.
|
Looking the ROC curves we can see that our improved feature detector is significantly better than the original on the Yosemite images but we do not see such an obvious improvement in the graf images. It is likely that some property other than contrast is causing the difficulty in the graf image set.
Test sequence
Our panorama results from the test images were very good and very similar to the provided sample solution. Since this panorama does not form a 360° image and is composed of only 4 images, the resulting 360° viewer is not very good.
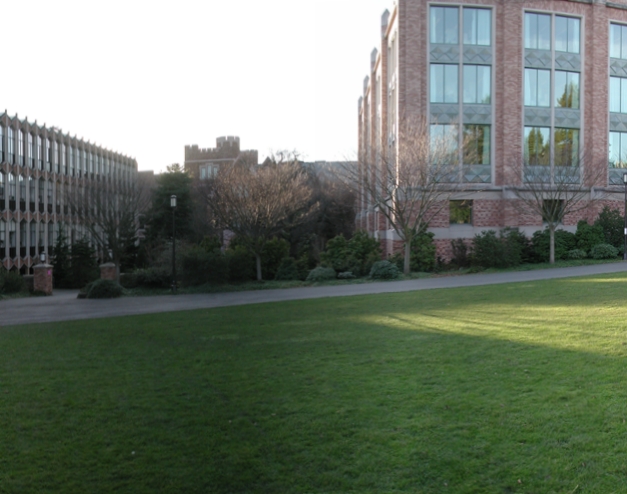
Sequence with Kaiden panorama head
This is a panorama of Vasa Park taken with the Kaiden panorama head. Image contrast was a large problem for panorama generation. Since the lake images were much darker than the land images, our intial results contained a lot of ghosting. We were able to fix this problem using our extra feature detector which normalized the values of each feature.

Sequence taken by hand
This panorama was of a much lower quality than the panorama produced from the Kaiden head images. For this panorama, image contrast was not as much of a problem. A lot of ghosting exists within the image, which can be largely attributed to camera rotation and motion within the scene.
