OptimizeMe
Get more out of your data to boost your productivity
Team


Problem and Design Overview
Many would agree that feeling unproductive, slow, and inefficient leaves people regretful of their day or even a week. Hoping to improve this in a sustainable manner while balancing work, physical and mental health is difficult. There is a huge availability of tracked health data. According to a survey by Gallup, roughly half of American adults have tracked at least one health related metric using an application or smartwatch. However, it is challenging to exactly identify the categories of wellness contributing to or detracting from productivity levels. What are ways to make health data more actionable and meaningful to users?
To address this issue, OptimizeMe is a mobile application focused on using the intersection of a range of tracked metrics, such as sleep, exercise, diet, and stress levels to optimize an individual's productivity. OptimizeMe aims to surface correlations/trends between empirical data and subjective participant feedback, based on a personalized definition of productivity. Our design focuses on making data more actionable through the chat feature which provides personalized advice on how to improve individual metrics based on the participant’s goals and trends. OptimizeMe is looking to do more with commonly collected data, making it more actionable and meaningful to participants.
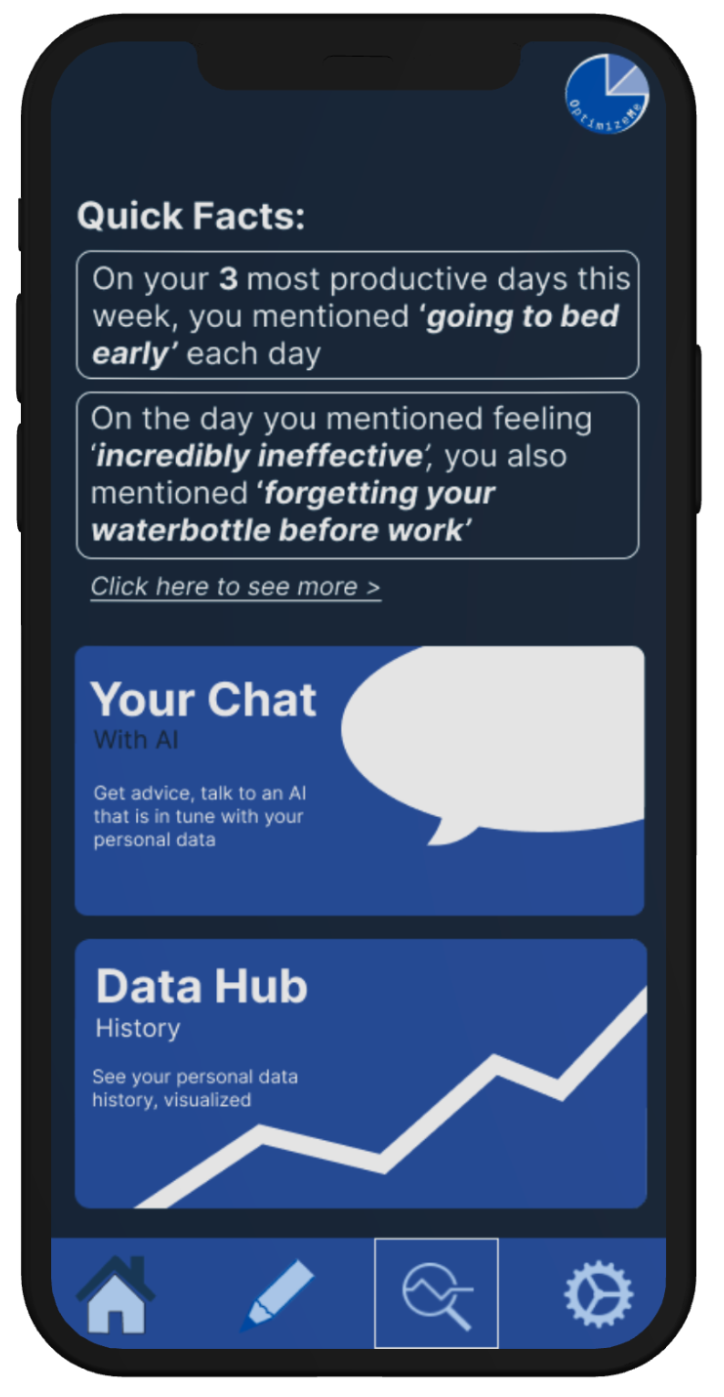
The Analytics tab showcases the AI chat feature and data history along with quick facts based on the noticed trends
Design Research Process and Key Insights
The motivation and goal behind our design research process was to gain a deeper understanding of participants’ current system and relationship with optimizing personal productivity. The goal was to dive into the schedule of participant’s daily routines and habits which affect their productivity. This would later help us create tasks which fit the needs of participants so that they are hopefully able to set themselves up to increase productivity. Our participants in our design research process were a mix of college students and new college graduates which provided a diverse sample size that included strenuous schedules and juggling many aspects of their lives. In total we had three participants – a third-year full-time computer science and mathematics student who works hard and is moderately active, a fourth-year undergrad student at the University of Washington studying communications extremely passionate about staying physically fit, and lastly a product manager at Google living in New York City. We chose a diverse range of participants to understand how daily productivity levels are influenced by various factors related to an individual’s physical and mental well-being. The method we decided which would be most effective was conducting semi-structured interviews with our participants so that they felt comfortable and opened up about their daily routines and habits. Also the semi-structured interview type would create space to gain a holistic view on how a participant interacts with and thinks about balancing and tracking their health-related metrics. In our semi-structured interview we asked questions around the topics of personal experiences with other applications/wearables to track data, their current productivity system and what they like and dislike, and how they identify trends and map data to actionable insights.
Tracking Important Health Metrics
Initially our idea and design was focused on tracking sleep data to improve a participant’s productivity the next day since it is one of the most vital human factors to an energized day. Yet the design research process uncovered a more complex system of factors that affected an individual’s productivity. A common theme that each participant conveyed is that they all found a combination of sleep, exercise, diet, and stress levels to be important in sustaining a productive day and whenever one or a combination of these fell apart, they decreased in efficiency. One participant summed it up best, “just eating healthy did not boost my energy but I had to incorporate exercise as well which became a domino effect to getting better sleep”. From this important feedback we iterated around increasing our metrics from just sleep to designing around sleep, exercise, diet, and stress levels that covers a larger area in helping participants increase their productivity. The alternatives to our design included many more factors, greater than 7, but decided this would be too much to track and not optimally helpful.
Defining Productivity
The most difficult part of our project was being able to define productivity. Productivity is very closely connected to an individual’s beliefs and values. At first we thought of leaving it out, so that just the data itself can be interpreted by itself. But during our ideation process and design research process we found that increasing productivity in a sustainable and engaging manner requires us to define productivity. After our semi-structured interviews we found an interesting revelation that the only common theme about defining productivity was that there was nothing in common between each participant, thus defining productivity as self defined which became one of our core tasks. The underlying relationship between increasing productivity and self definition was energy levels and so if the health metrics were strong then a higher energy level would result in a productive day. This is mapped into our product through a subject participant input task via a personalized AI chat and self tracking a new metric which is overall productivity.
Converting Data to Action
Displaying data alone does not increase productivity. Initially we had a simple vision in mind to present data for important health metrics so that participants could identify hidden trends in a longer time frame. But there was a disconnect between this initial framework and our goal to increase productivity. It went halfway as through our design research process, participants in interviews voiced their frustration with not being able to actually see improvement in using existing applications/wearables in this space since it just presented data. There was nothing actionable about the data. Participants described using these applications for a short amount of time in a burst, leaving them confused with a lot of data to understand. They cite that sleep data alone did not change their sleep habits. This crucial feedback led our team to try to cross the other half and connect health metrics data with actionable tasks in which the participant can genuinely improve their productivity and reach their goals. It led to the creation of subjective data input and output so that it kept participants engaged and helped guide them to actionable tasks to improve their metrics and productivity. The personalized AI chat feature allowed an interactive way to understand data and interpret the data to suggest actionable improvement based on the correlations within the individual metrics.
Iterative Design Process and Key Insights
Our main focus during the iterative design process was on conducting usability testing and heuristic evaluations, which allowed us to detect any usability issues that participants encountered while interacting with our paper prototypes. By obtaining valuable insights into their preferences and requirements, and collecting feedback on the overall participant experience, we proposed improvements that aimed to enhance their experience with OptimizeMe. We conducted usability testing with three participants, with particular emphasis on observing how they inputted their goals for metrics, qualitative and subjective data, and how they received analytics for each metric. We continued to iterate on the paper prototypes, incorporating adjustments, until we had developed a solid prototype that we transformed into our digital mockup. With this foundation, we were able to expand on certain features in the digital mockup to better understand the overall functionality of OptimizeMe.

Overview of our final paper prototype
Improving the Analytics
During our usability testing, we identified an area that required improvement, specifically the analytics functionality for each metric. In our initial testing, we noticed that participants were inputting subjective data that wasn't being utilized, which limited their ability to analyze trends in-depth. At this stage, participants could only view a weekly visual graphics presentation of the scores they inputted for different metrics. However, based on feedback from participants, it was apparent that they struggled to comprehend their data. To enhance the analytics component of the application, we added the option to interact with an AI chat and see the weekly visual presentation of the graphs within the analytics tab. We integrated these changes into our paper prototypes, but during the mockup phase, we conducted a more thorough examination of the chatbot feature to comprehend its operational process. We aimed to create an intuitive feature that would allow participants to converse with the chatbot and gain insights into their personal data and trends.

Before and after changes in the Analytics tab
Guiding Participant Through the Application
During our third usability test, we observed that participants were still getting confused about where to start in the application. Some of them asked questions like "how will the data be used to provide feedback?" This confusion stemmed from the fact that our initial paper prototype did not provide sufficient guidance on the different features and how they worked together. After receiving this feedback, we made a quick change to our final paper prototype to improve the participant experience. However, during the digital mockup phase, we delved deeper into the breakdown of the tutorial feature to ensure that it provided a clear and concise explanation of the application's features and how they operated. We aimed to create an intuitive tutorial that would enable participants to have a better understanding of the application's features and how they relate to each other.

Digital mockup of the tutorial screens
Implementing Guided Prompts
During our heuristic evaluations, we identified an issue with the absence of guide questions for participants when they clicked on a metric to enter subjective data in the text box on the home page. The evaluators questioned, "how does the participant know what to input in these text boxes?" We recognized that the lack of guidance could lead to open-ended responses and potential errors. To remedy this, we incorporated a question prompt at the top of the text box, asking participants questions like "How was your sleep?" This prompt aimed to guide participants and keep them focused on the main purpose of the app. We included this change in our paper prototype before conducting usability testing and observed that the prompt questions helped participants stay focused on the specific metric data they were inputting.

Guided prompts for sleep metric (Inputting subjective data)
Resulting Design
The application’s final design included the following key features:
- Participants’ can input individual subjective and quantitative data
- Participants' can set personally defined goals through the chat feature
- Participants’ can view data and receive personalized advice and analytics
- Participants’ can interact with a AI chat that is in tune with their personalized data and goals
Our two primary tasks are as follows:
Task 1: Inputting Data And Goals
After completing the initial tutorial, the user will be introduced to the OptimizeMe proprietary AI. This is where the app begins to understand the personal goals and intentions of individual participants. These screens (right) show how an introductory interaction with the AI would look:

After interacting with the AI to establish some goals for the participant, they will be redirected to the home page of the app:

From here, the user can quickly input some feedback on any of the tracked data categories on the home screen:

Or, the participant can select the “Input” tab (the pencil icon) on the bottom navigation bar:
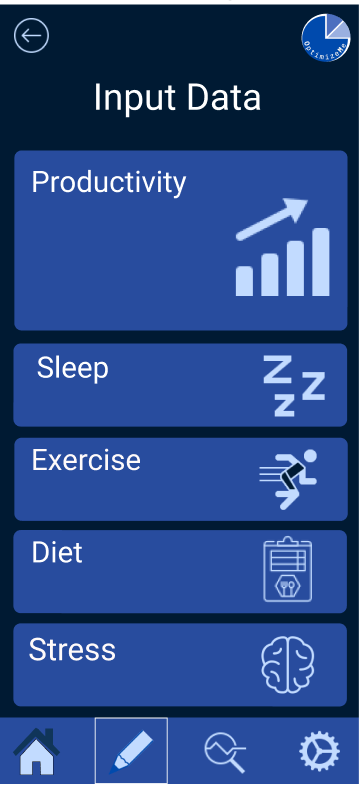
After selecting a category to input data for, the participant is prompted to input both text based data and a relative numerical score:

Task 2: View Data and Receive Advice/Analytics
To view personal data, receive analytics, and interface with the OptimizeMe AI, the participant can navigate to the Analytics tab by clicking the magnifying glass icon on the navigation bar. This brings them to the Analytics page:

From the Analytics tab, participants can also view their data history, partitioned by time period. By selecting a specific week of data, users can view their data, visualized, with more granularity:

From here, participants can select “Your Chat” in order to converse with the OptimizeMe AI. You can see an example conversation which demonstrates some of the abilities of the AI in giving advice, asking questions, and displaying data:
