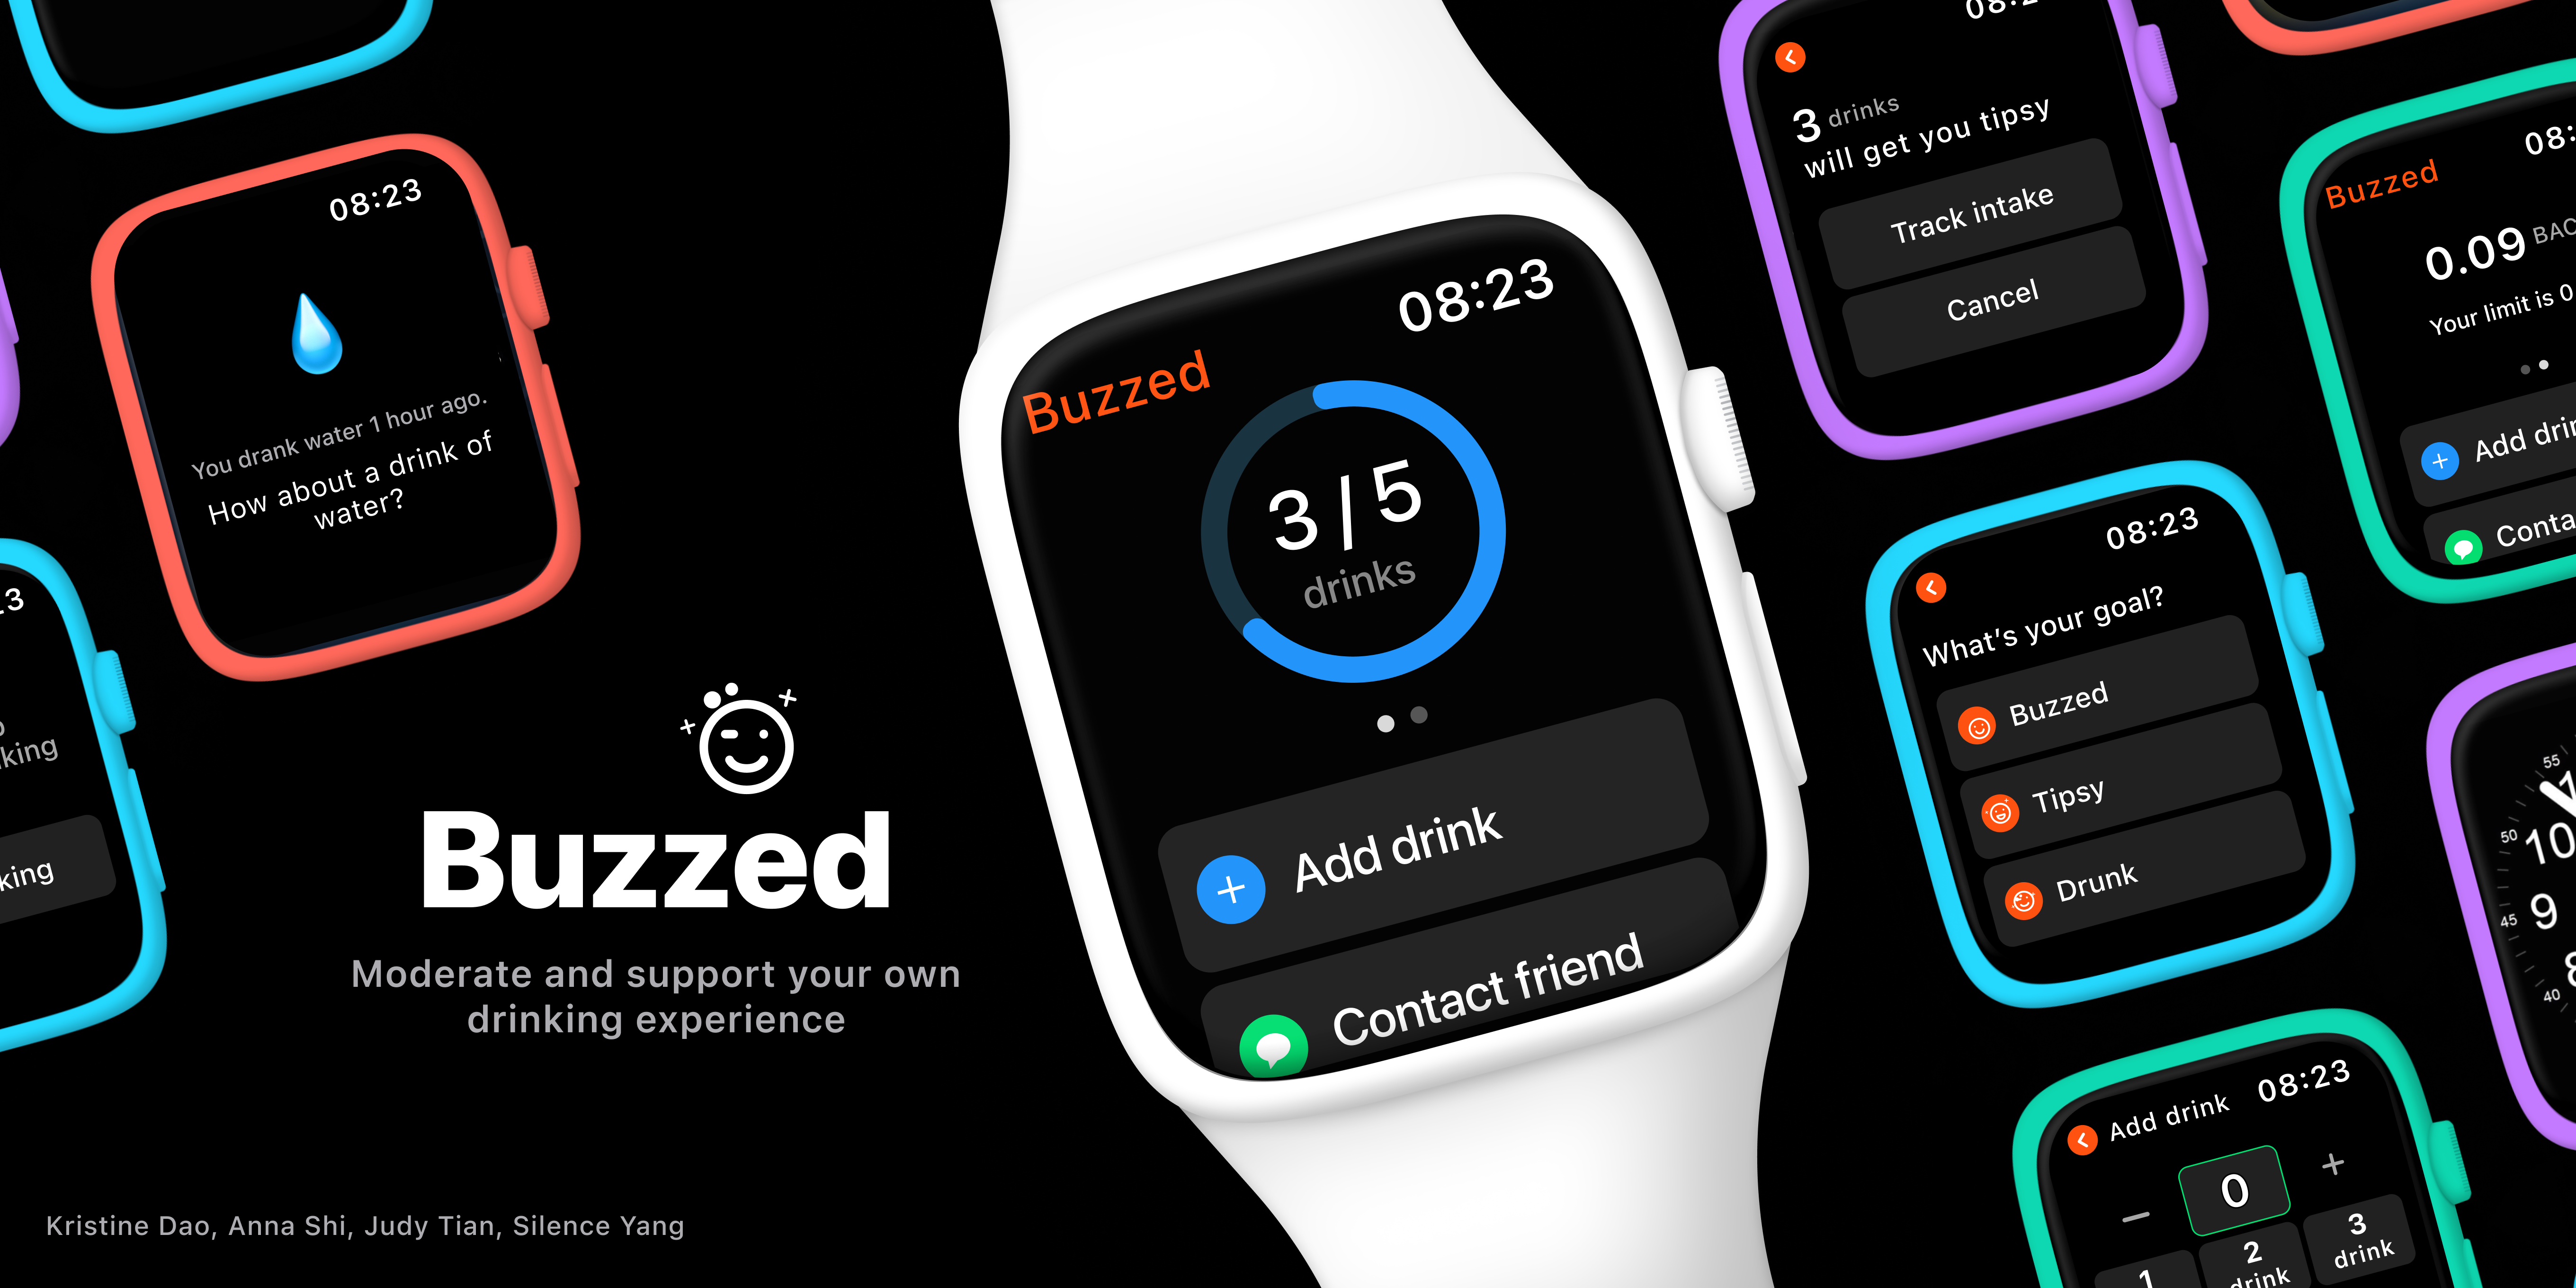
Buzzed
Moderate and support your own drinking experience
Team Members


Problem and Design Overview
Consuming alcohol at college has become a ritual that students often view as an essential part of their higher education experience in their early 20s. Roughly more than 80% of college students have drunk alcohol. However, the risk of college students drinking is a serious health problem that is often overlooked in public schools. Consistent overdrinking can lead to consequences such as alcohol poisoning, potential accidental injuries, and higher blood pressure, among others. In fact, about 1,519 college students ages 18 to 24 have been involved in alcohol-related unintentional injuries such as vehicle crashes every year. A possible cause of overdrinking that can be controlled involves regulating one’s alcohol consumption and alcohol tolerance. Therefore, our group wants to help college students who want to be responsible and more healthy for alcohol intake to moderate and regulate their consumption.
Our design uses a smartwatch to track people’s alcohol consumption. Paired with the Health App on a modern smartphone, the data from the watch along with goal reflection can be viewed in detail to help college students achieve their consumption goals.
Design Research Process and Key Insights:
Since our research goal is to understand college students’ past drinking experiences and how they currently moderate their alcohol consumption to help them drink more mindfully, we relied on User Interviews as the main method in our research. To narrow down our project scope, we interviewed UW students who drink in casual social settings such as at a friend’s place or their own place so we can create the biggest impact in a place where people are already responsibly drinking with friends instead of at parties where it might not be their interest to drink moderately.
We conducted one pair interview with two friends D & R who drink together to investigate how friends hold each other accountable when they’re drinking (in addition to our research goal), and we conducted single interviews for the remaining two participants T and J.
After conducting our interviews, we found that the overall problem of alcohol consumption involved four main pain points:
- Existing methods don't always work when tracking consumption
- Alcohol intake and willingness to moderate it is influenced by environment
- There is typically not much friend accountability
- People don't drink water consistently enough when they're drinking
Since our target audience is college students who want to drink more responsibly, we wanted to focus on problems that would have a low barrier of entry. “Existing methods don't always work when tracking consumption” and “People don't drink water consistently enough when they're drinking” were both problems that, when solved, would benefit individuals’ health while also being more feasible to investigate.
Three Key Insights
Help and ease the tracking methods
Based on the interview, although responsible college students who drink alcohol want to track their consumption, they either don’t know how to record the progress because it’s inconvenient, hard to memorize and easy to forget when they are having fun or their methods to record just usually fail. To be more specific, our participant “D” said he would slow down if he felt a headache as he couldn’t remember how much he had drunk. Another participant used his own method which is waiting for 10-20 mins between shots to make sure he was not drinking too much and too fast, but it’s also difficult for him to always look at time. Therefore, to help our target audience to have a low barrier of tracking their alcohol intake, we initially considered to use a smartphone, a smartwatch or a ring which has alcohol and dehydration sensing to track the data, such as how many drinks people had consumed, how much is their Blood Alcohol Concentration (BAC) which is a measure of alcohol in the blood as a percentage), etc.
Creating friend accountability
As our design is focused on the casual social settings, especially for students who usually drink with friends, our paired interview showed that when students started to drink, they won’t take care or be responsible to their friends that drinking together. When we asked D & R how do they keep each other accountable, they answered “we did not, we had frank ocean playing and we were vibing on the floor.” It’s understandable as our target audience are just in their early twenties and having an enjoyable time with best friends, so it’s even harder for them to be watchful of others while drinking. Nevertheless, at the same time, after consuming too much alcohol that has passed their limit, they will be in an uncomfortable situation including headache or even alcohol poisoning. To create the awareness between friends while they are drinking, we wanted to add the feature that could check in on your friend.
Moderate drinking through gentle reminders
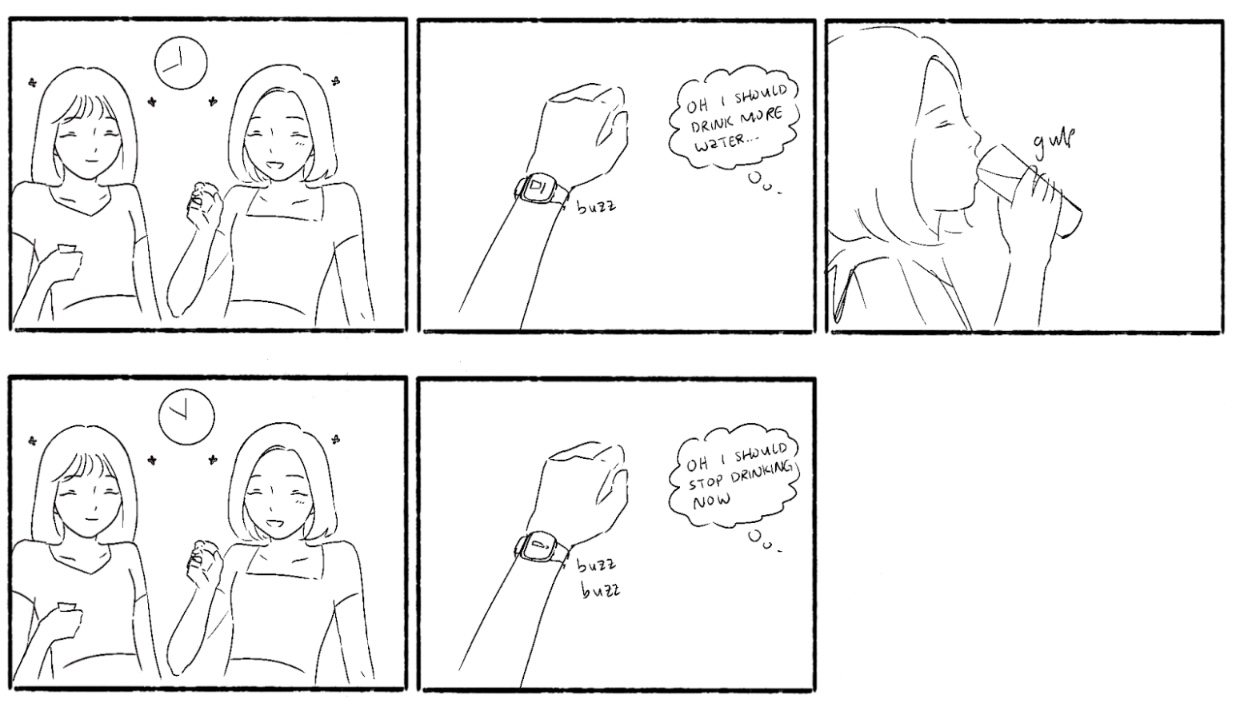
When people are consuming alcohol, it’s easy for them to get hungover and dehydrated as alcohol is diuretic, which causes the body to produce an increased amount of urine and thus lose the amount of fluid needed, so drinking enough water while drinking alcohol is vital. But during our design research, we found that participants often don’t drink water when they intake alcohol. To help college students to moderate and feel better after drinking, we designed to give people a reminder to slow down and stop drinking or just drink some water, which helps to promote personal responsibility in the moment when they are currently drinking.
Iterative Design Process and Key Insights
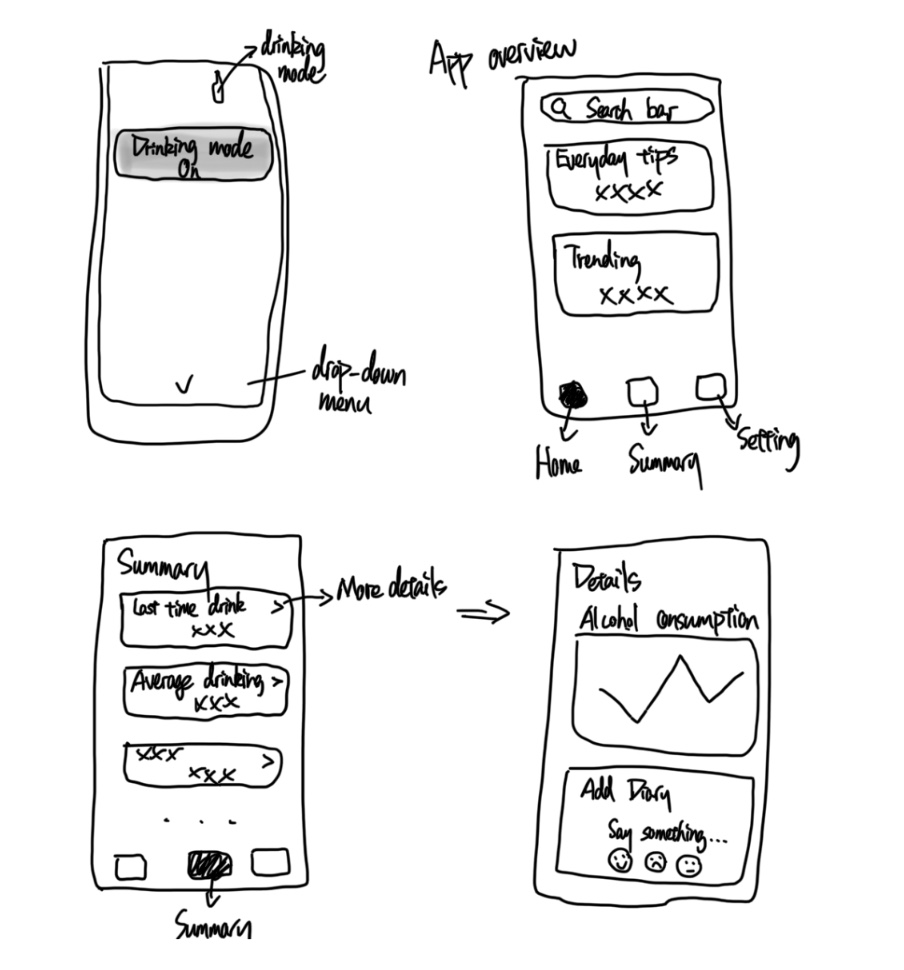
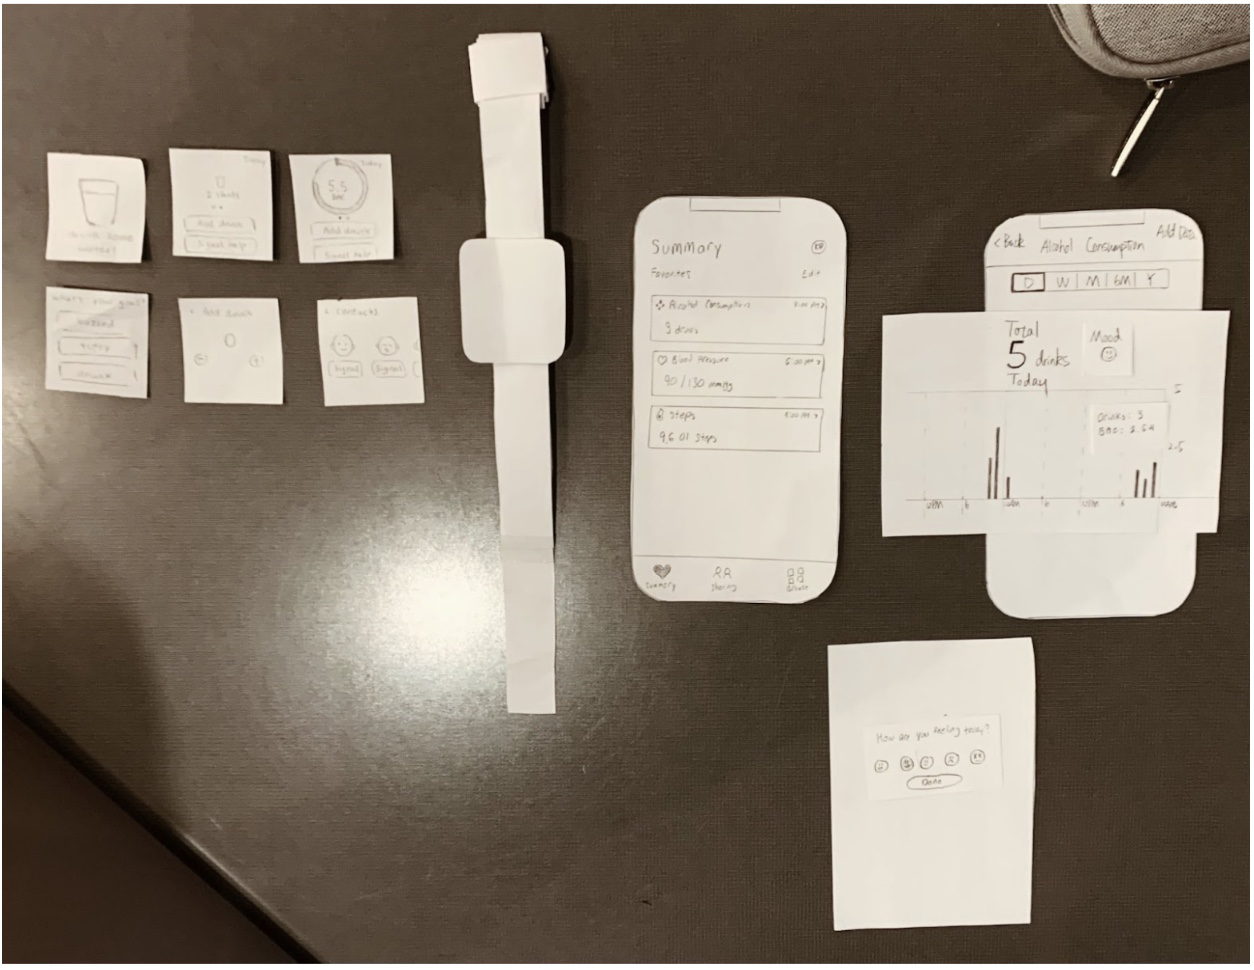
In terms of our iterative design process, we first started off by constructing our initial paper prototype. We decided to focus on designing for two of the tasks we had come up with, reminding people to moderate their alcohol consumption and allowing people to view the data they collect regarding their alcohol consumption. After creating our initial paper prototype, we conducted heuristic evaluations with other groups in the class in order to identify more obvious issues with our design. After this, we then conducted usability testing sessions with 3 undergraduate students at UW. During these usability testing sessions, we were able to identify some major issues with our design and made adjustments to address them. After integrating these changes into our final paper prototype, we got some more feedback from other groups in our class before finally translating our paper prototype into digital mockups.
Three Key Insights
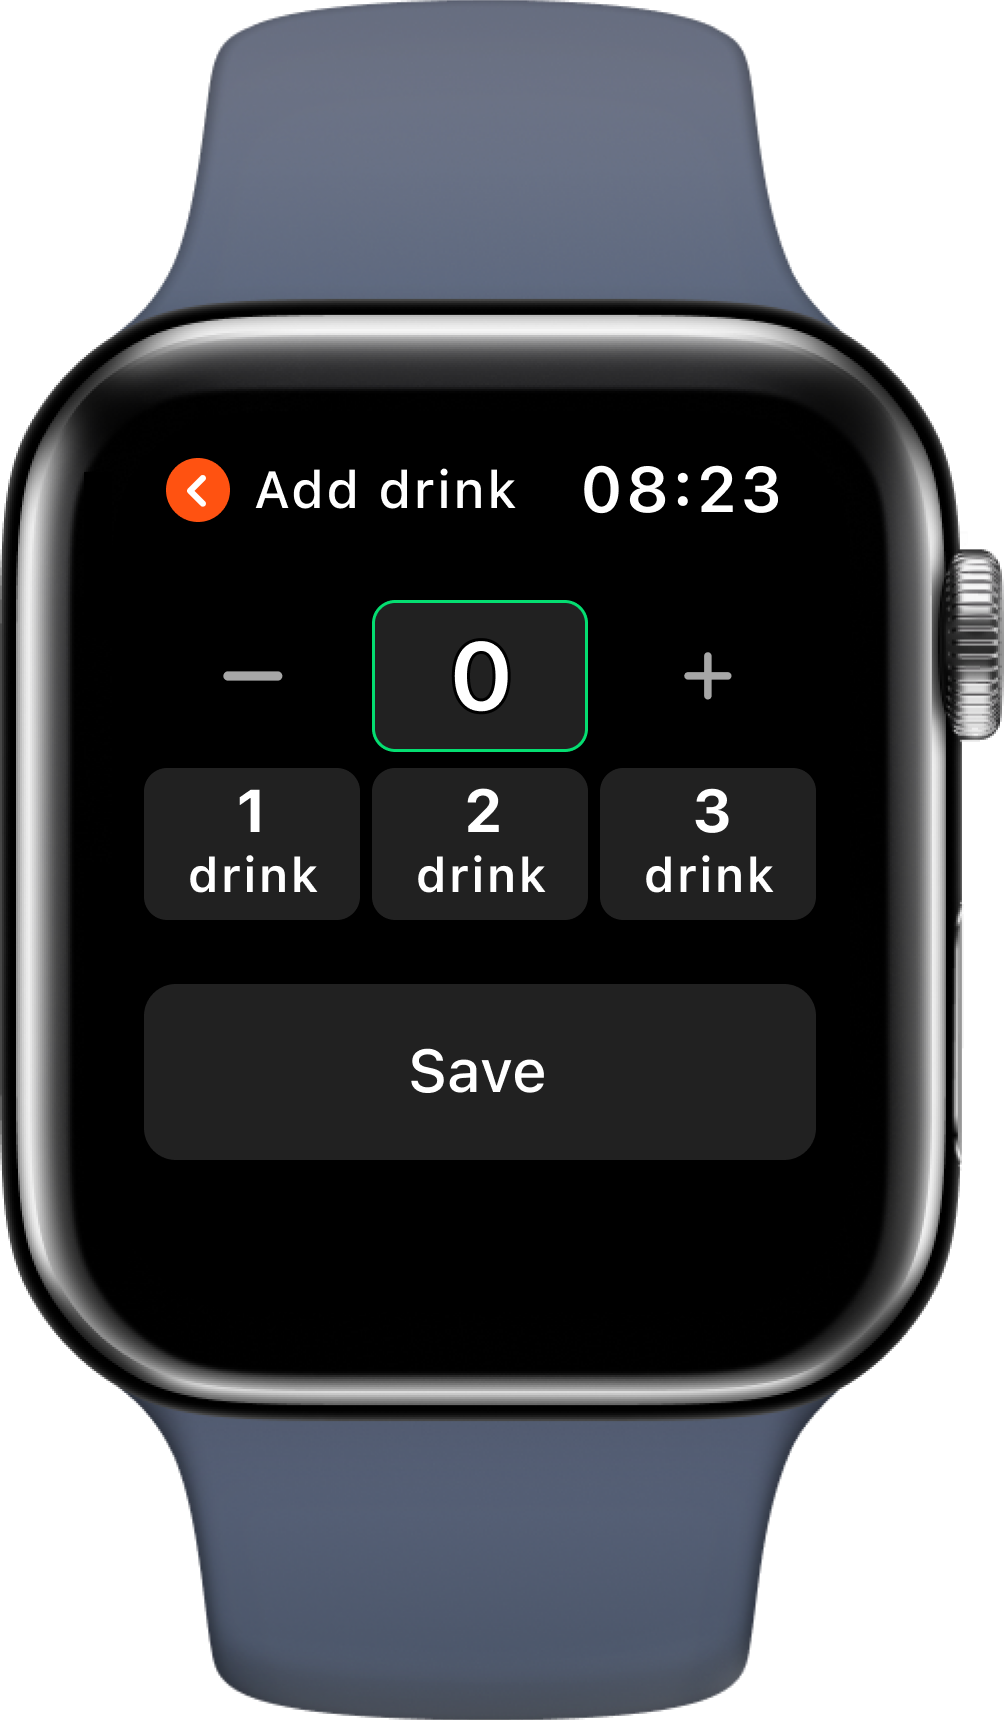
Making it easier for participants to add and log drinks so that they’re able to accurately track their drinking. One of our most important insights was that we needed to add another input interaction to assist people in logging their drinks. During our first round of usability testing, the participant was a bit confused on how to add and log their drinks other than tapping on the presets. It wasn’t obvious that they would be able to use the dial on their wearable watch to add to/decrease the number of drinks they were logging, so we added tap buttons for people to log their drinks alongside dialing/swiping. We chose to present this as one of our most important interactions because logging the number of drinks you’ve had was a key task that we wanted to focus on; it’s important that we correct and optimize this feature because helping our participants log their drinks quickly and easily is a core feature of our design
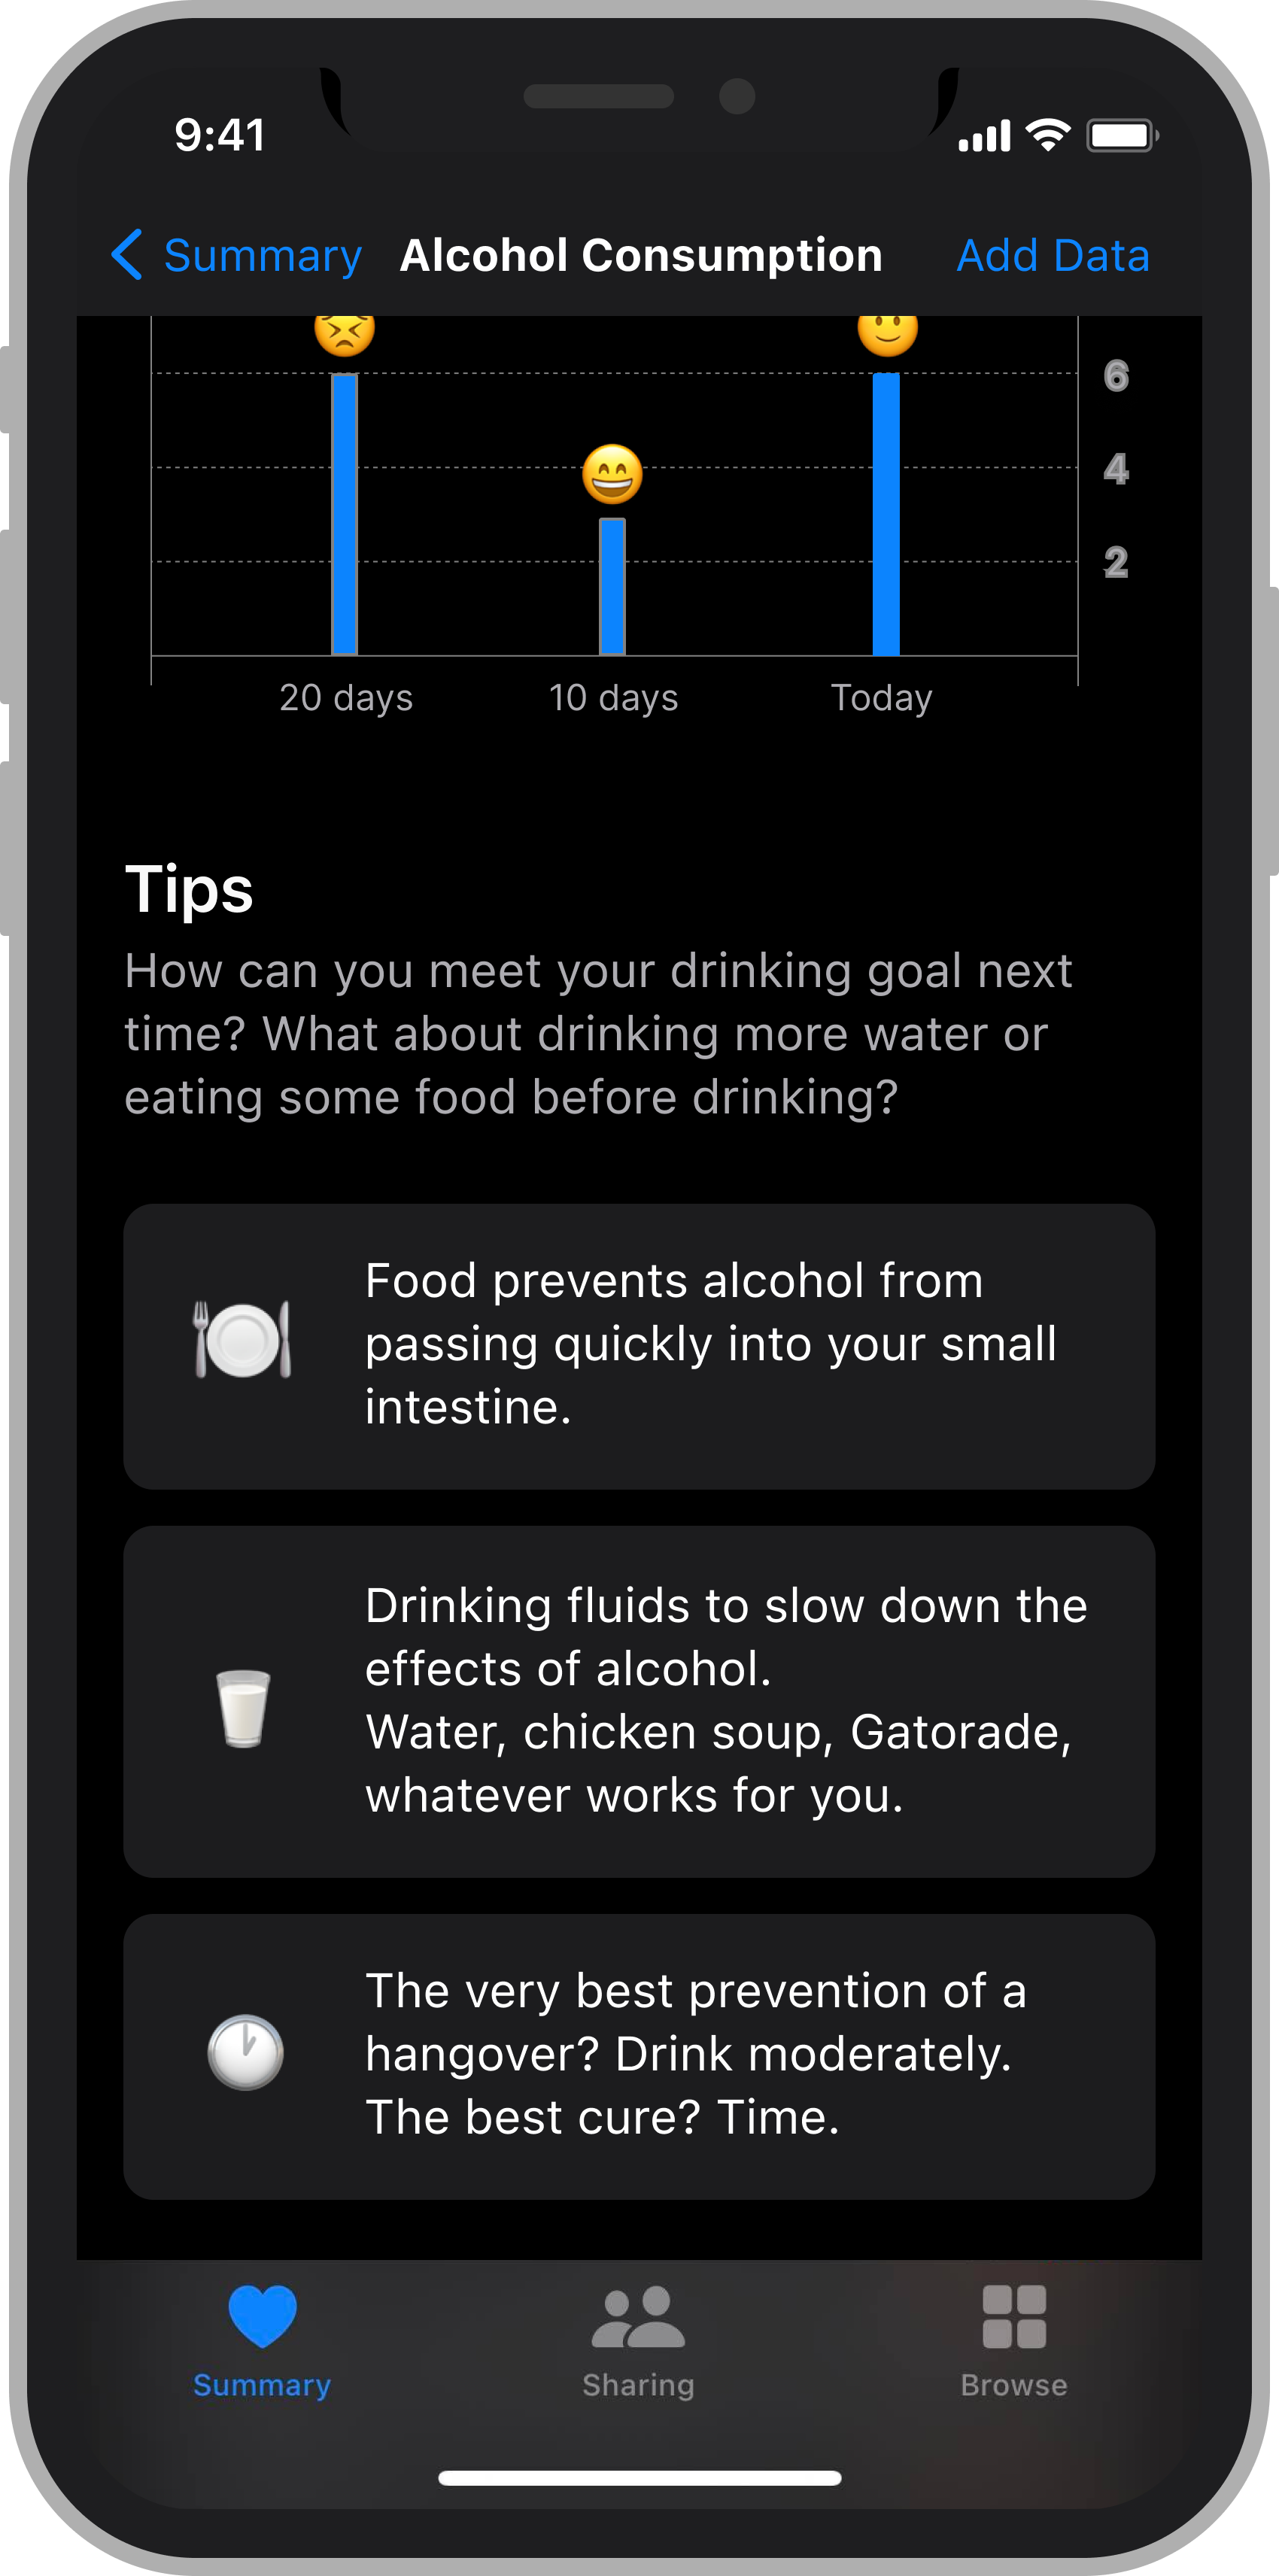
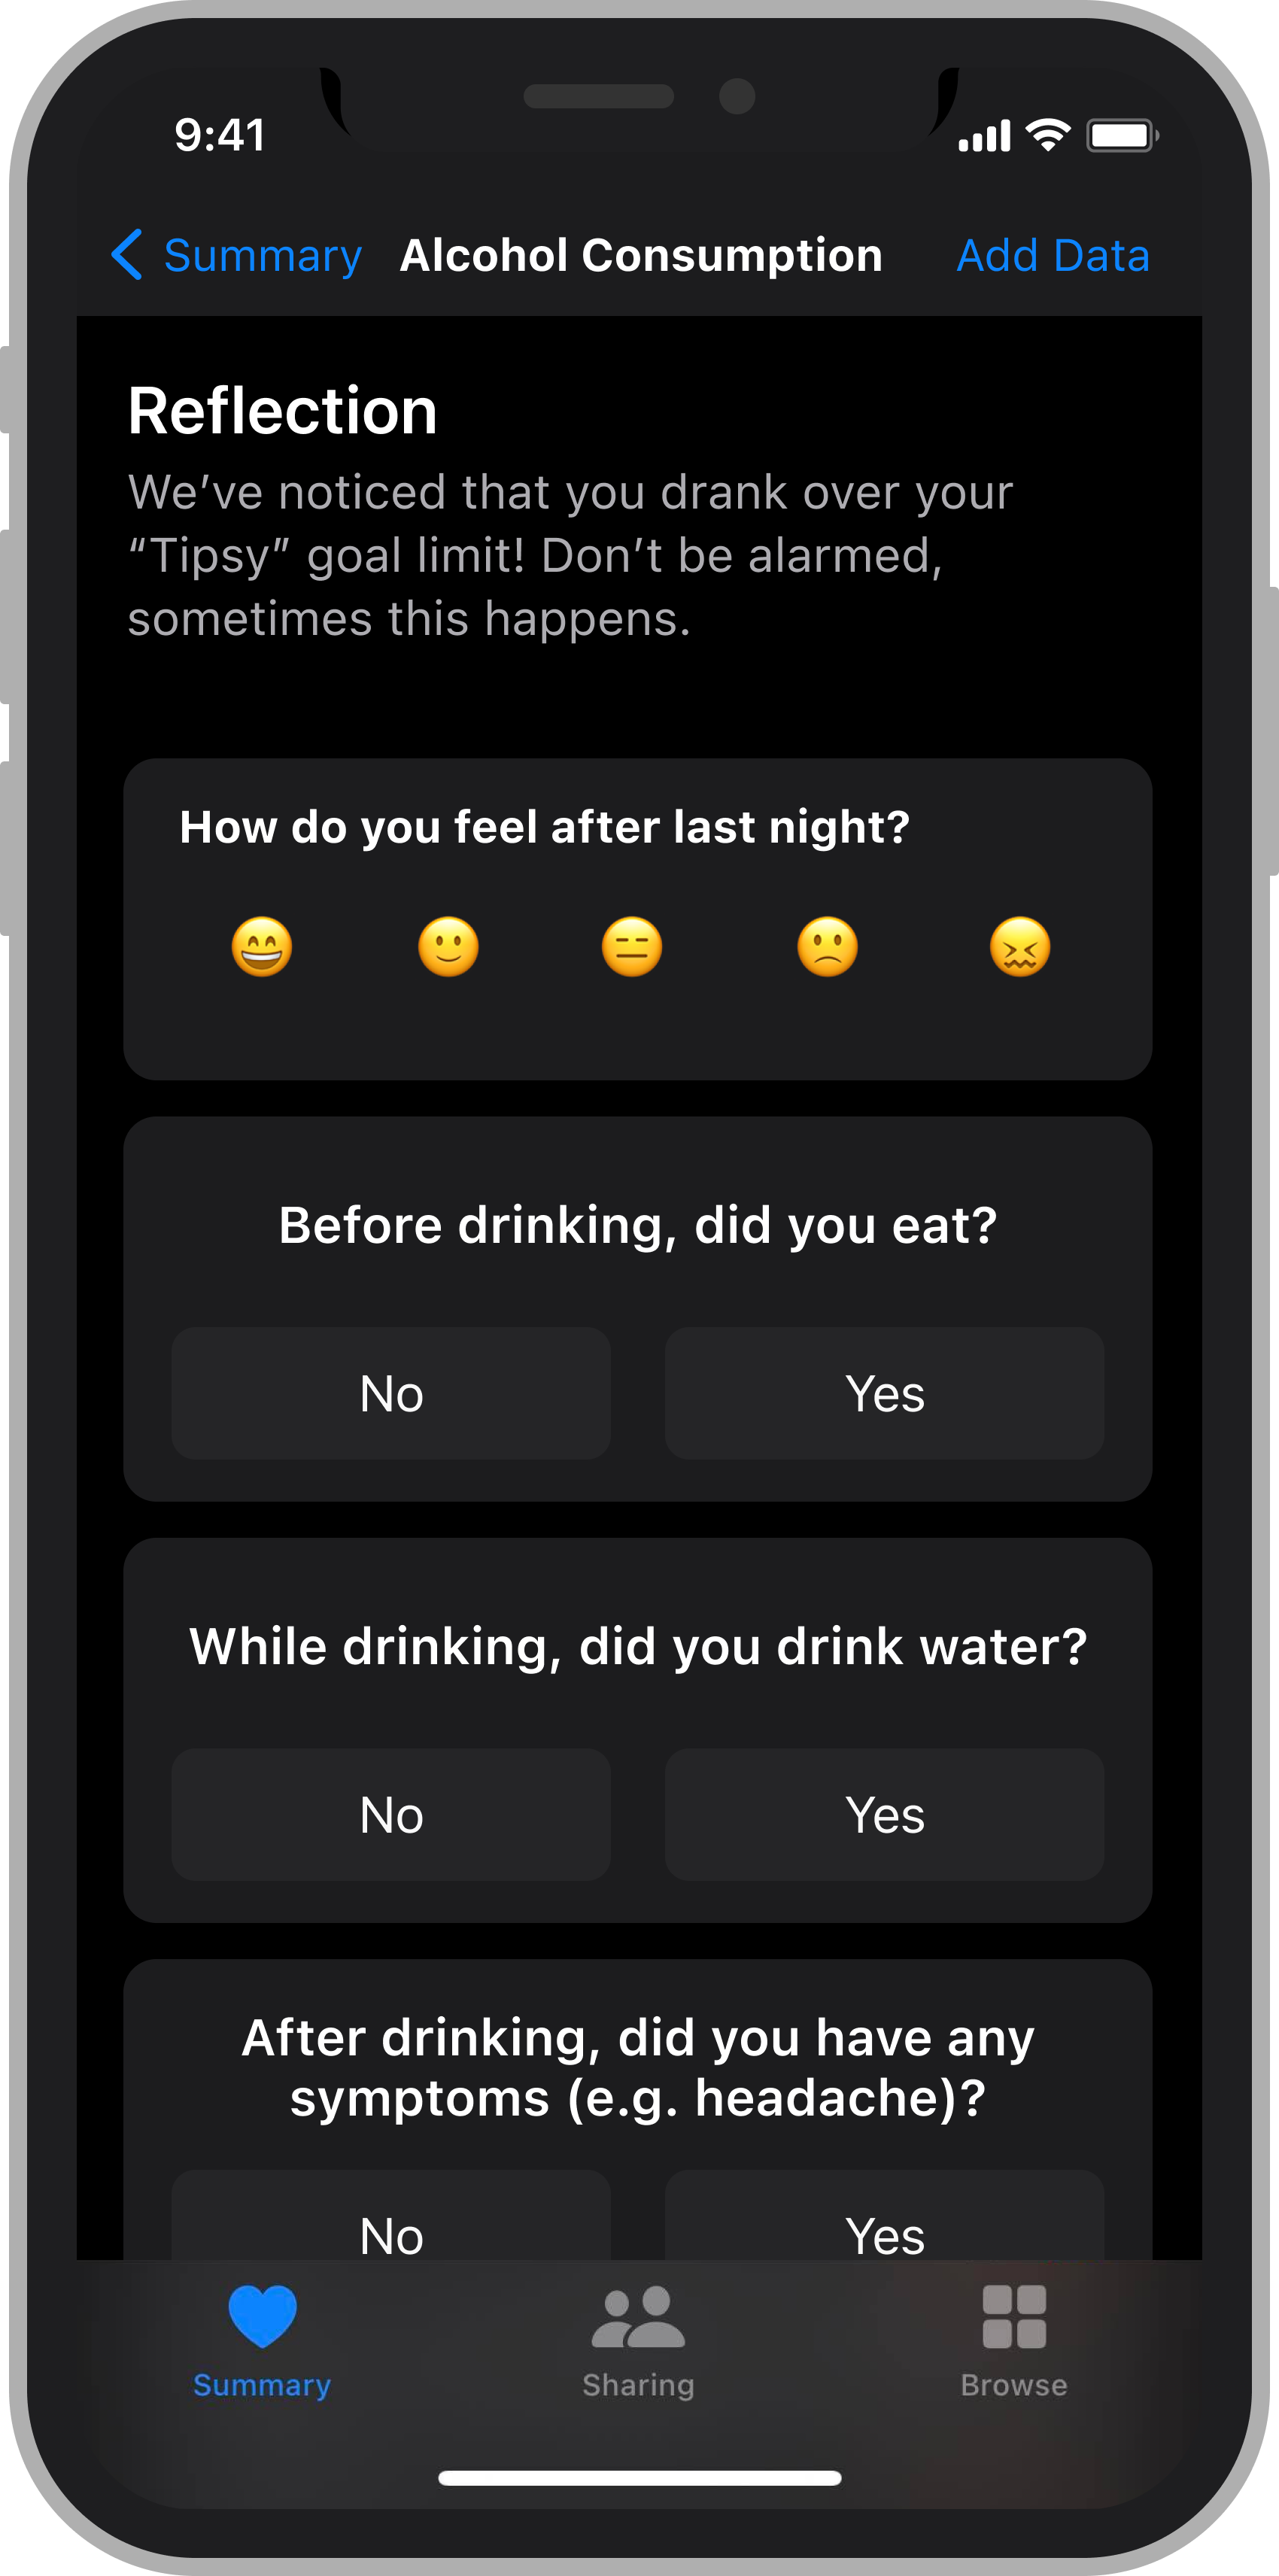
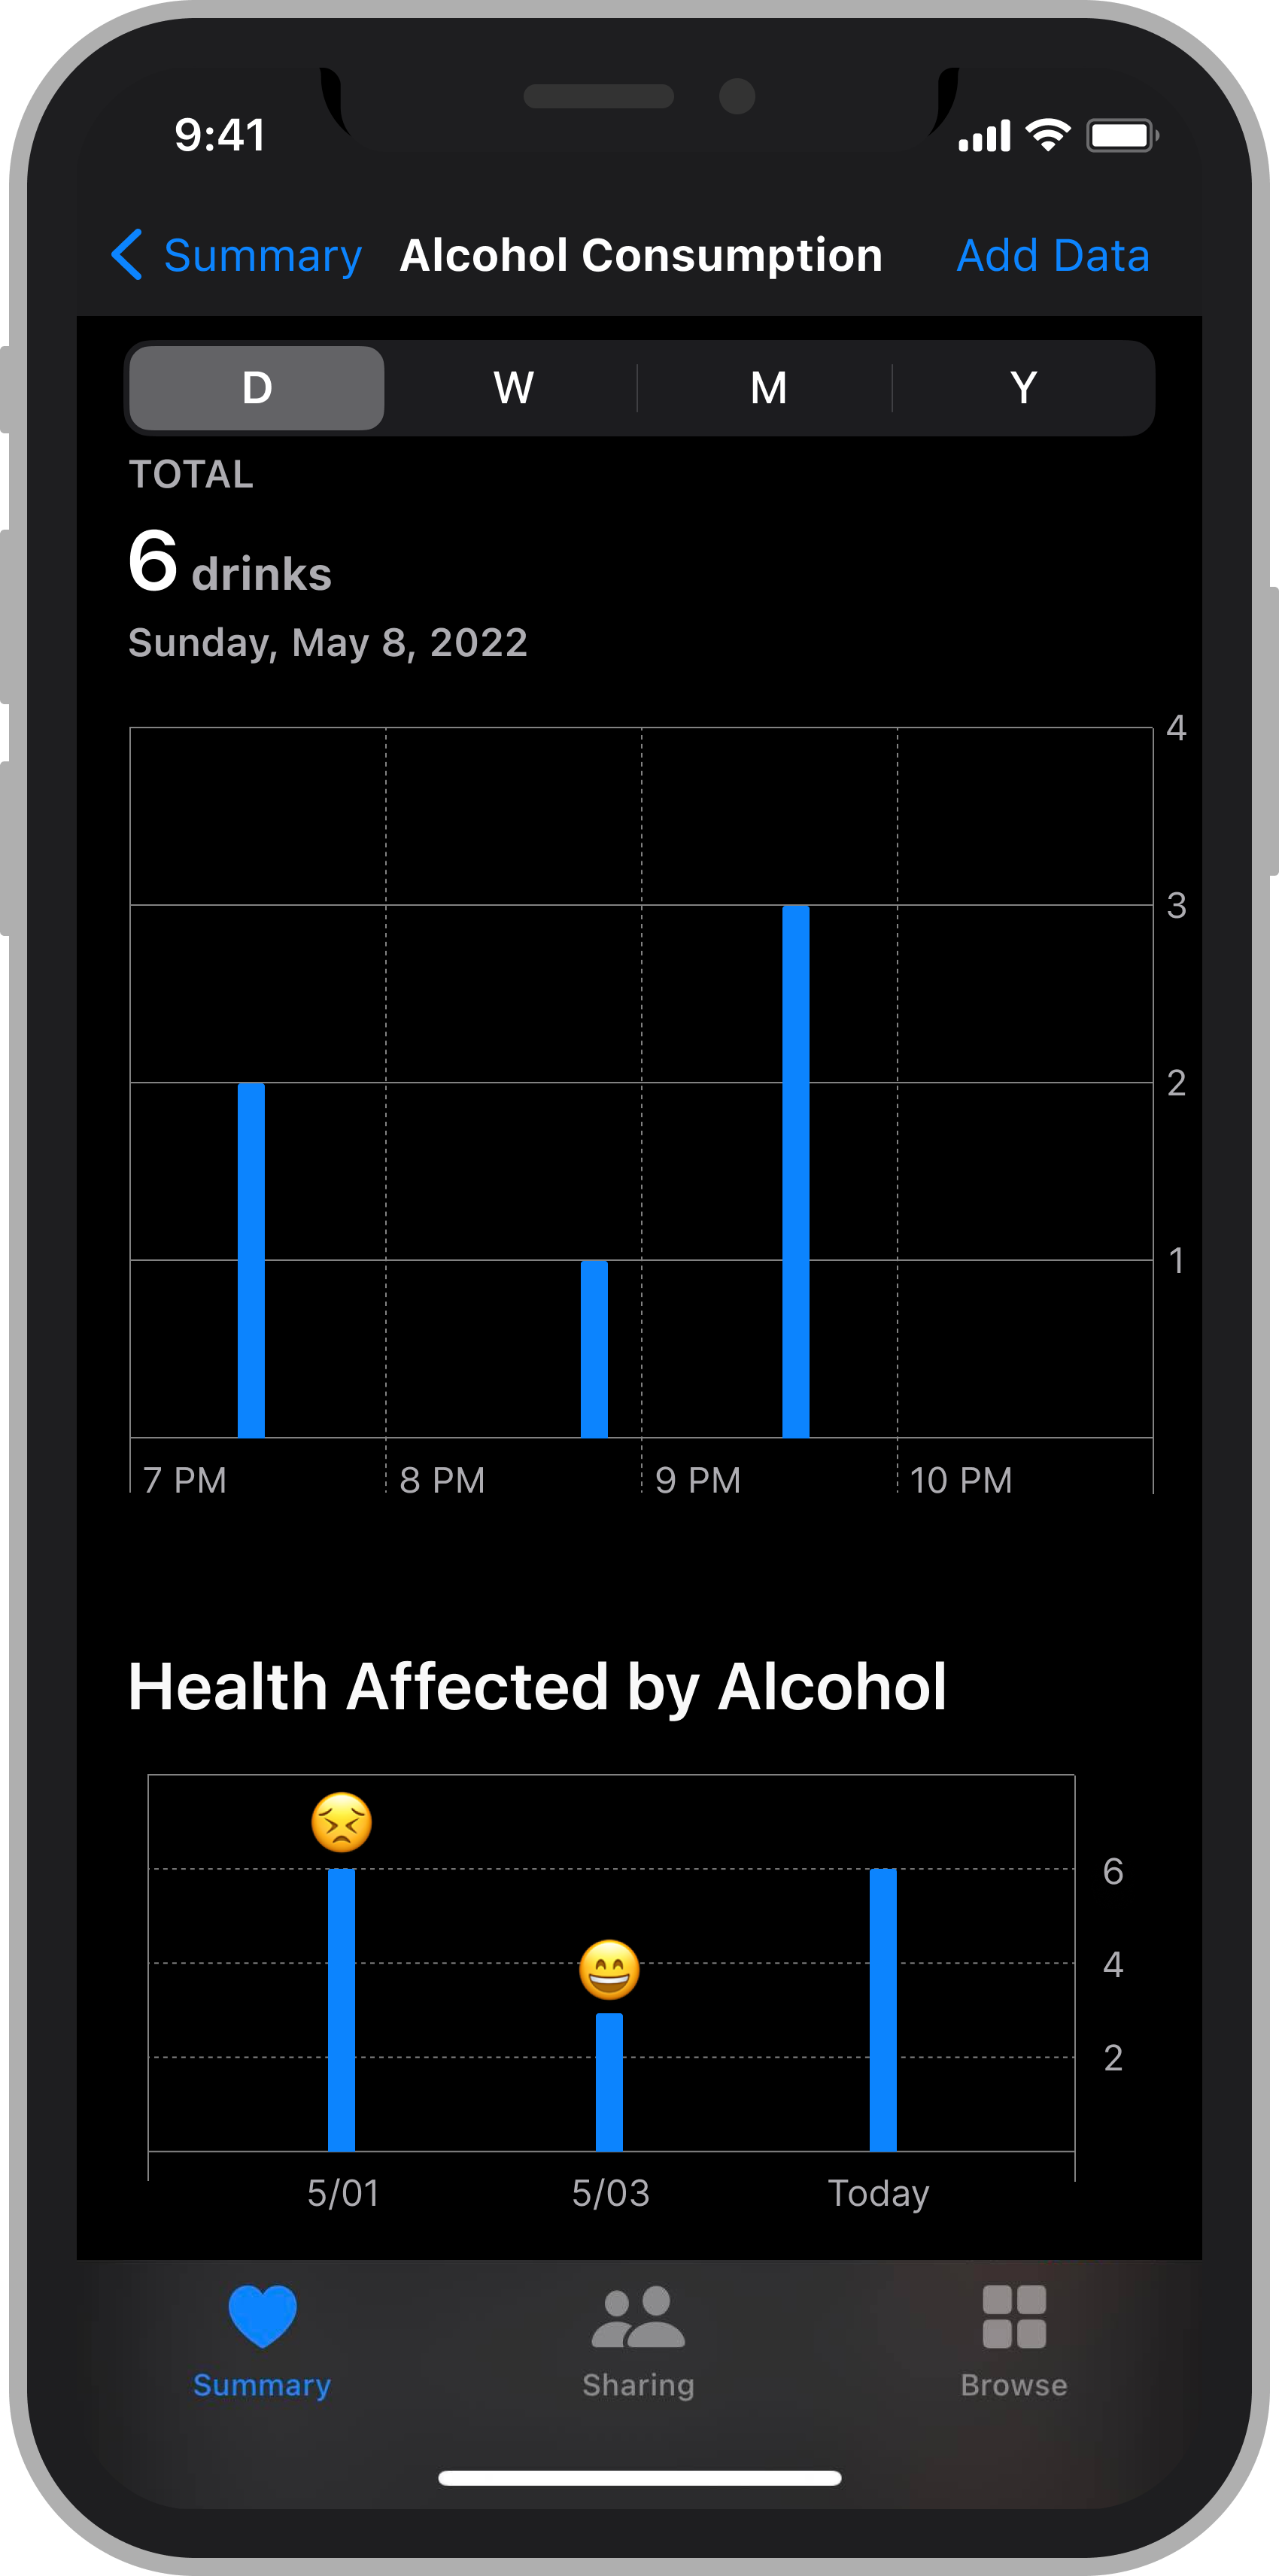
Improving participants’ understanding of how alcohol affects their mood and health. Another important insight that we had was that we needed to make the data people collected easier for them to view and interpret. We initially designed our “Alcohol Consumption” page on the health app as a graph that showed alcohol consumption throughout a day/week/month/year with an indication of people’s mood that day at the very top of the screen. During our usability testing, we found that participants didn’t really expect to see the mood on the alcohol tracking page, so we moved the mood data below the alcohol consumption data. We then decided to label this data “Health affected by alcohol” instead of mood data where people can tap on a column to view their symptoms like “nausea” that day that was associated with the mood and number of drinks they had. We chose to do this so that people are able to more easily understand and visualize how their alcohol consumption impacts other factors in their life such as their mood and physical symptoms.
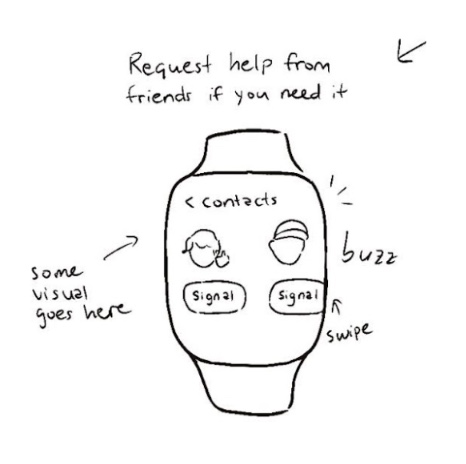
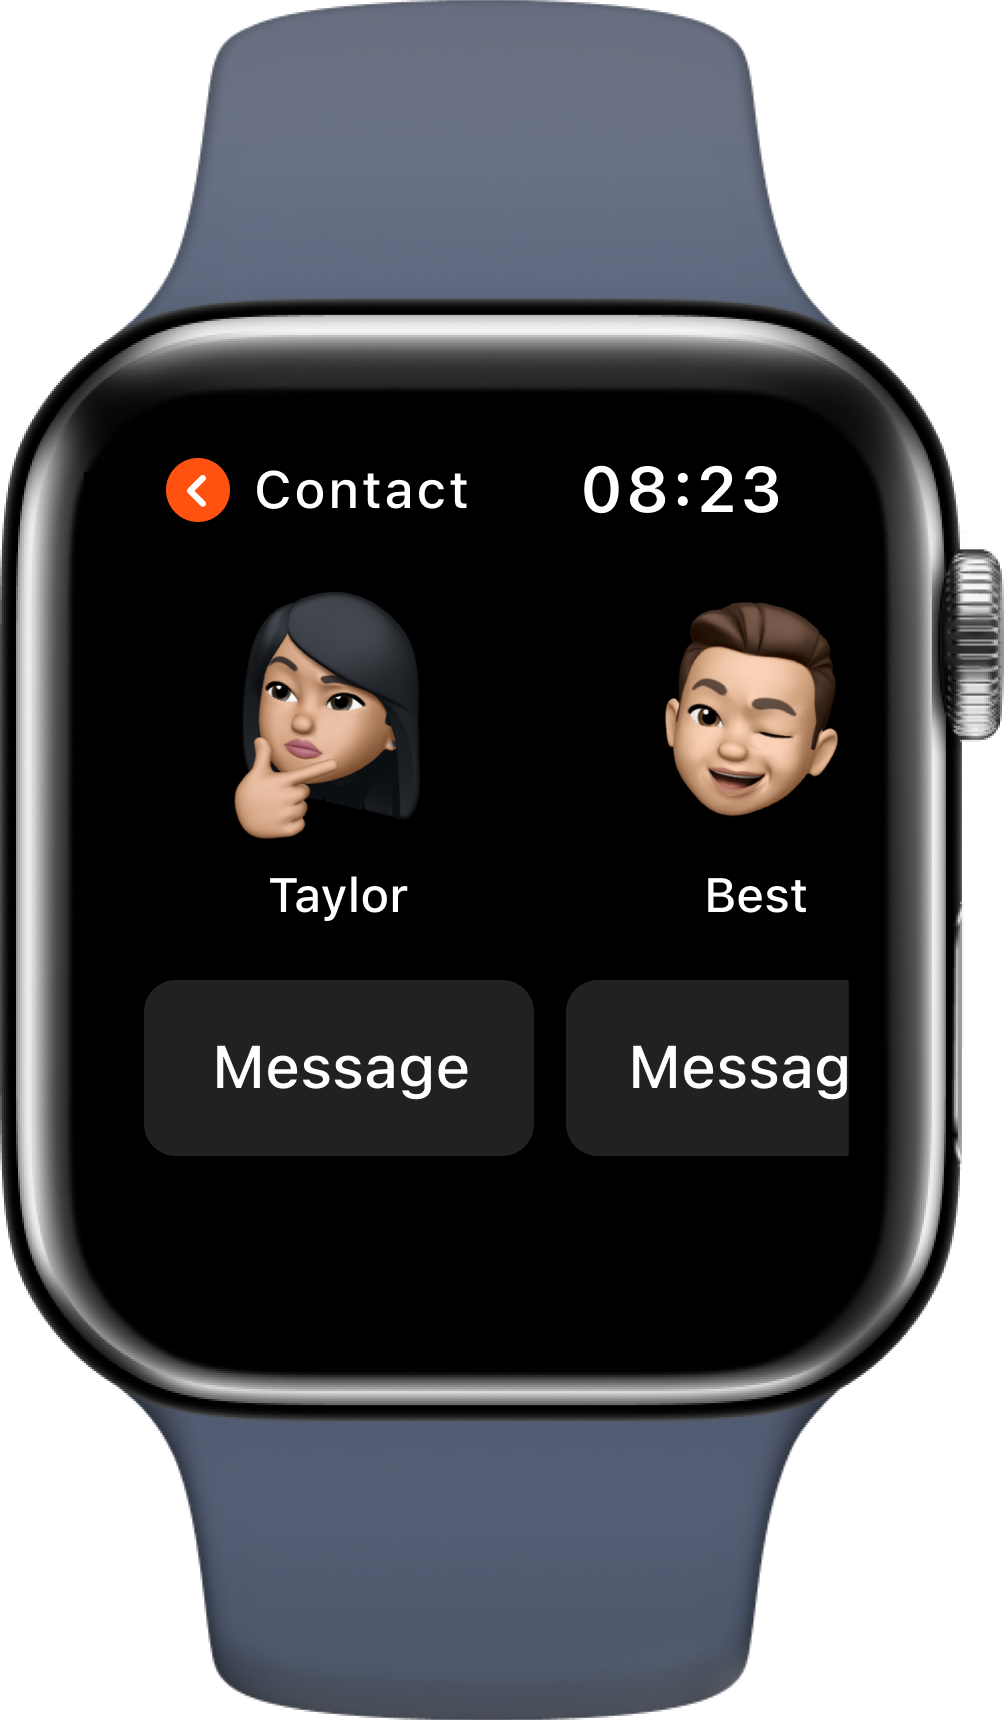
Helping users stay safe while drinking by making it simpler for them to contact a friend while drunk. Another important insight we made was that we had to expand upon the “social aspect” we had added to our design. In our initial paper prototype, we included a “signal for help” button, but didn’t fully flesh out what would happen if people pressed that button. However, as we began receiving critique and feedback from our peers and during usability testing, this feature eventually evolved into a “contact friend” button where people are able to quickly text a trusted friend if they need any help while drinking. Although we initially hadn’t planned on including a “social aspect” to our design, receiving this feedback was really important as it allowed us to make adjustments to better serve people’s needs. Additionally, looking back on our research, fleshing out this feature also addressed a concern we saw in our survey results - that people would accidentally send texts that they didn’t mean to send while drunk. Incorporating a “contact friend” button into our design - which would allow people to send a message just to a trusted friend that they’ve added on their app, would alleviate this pain point.
Resulting Designs
Task 1: Reminders to moderate alcohol consumption
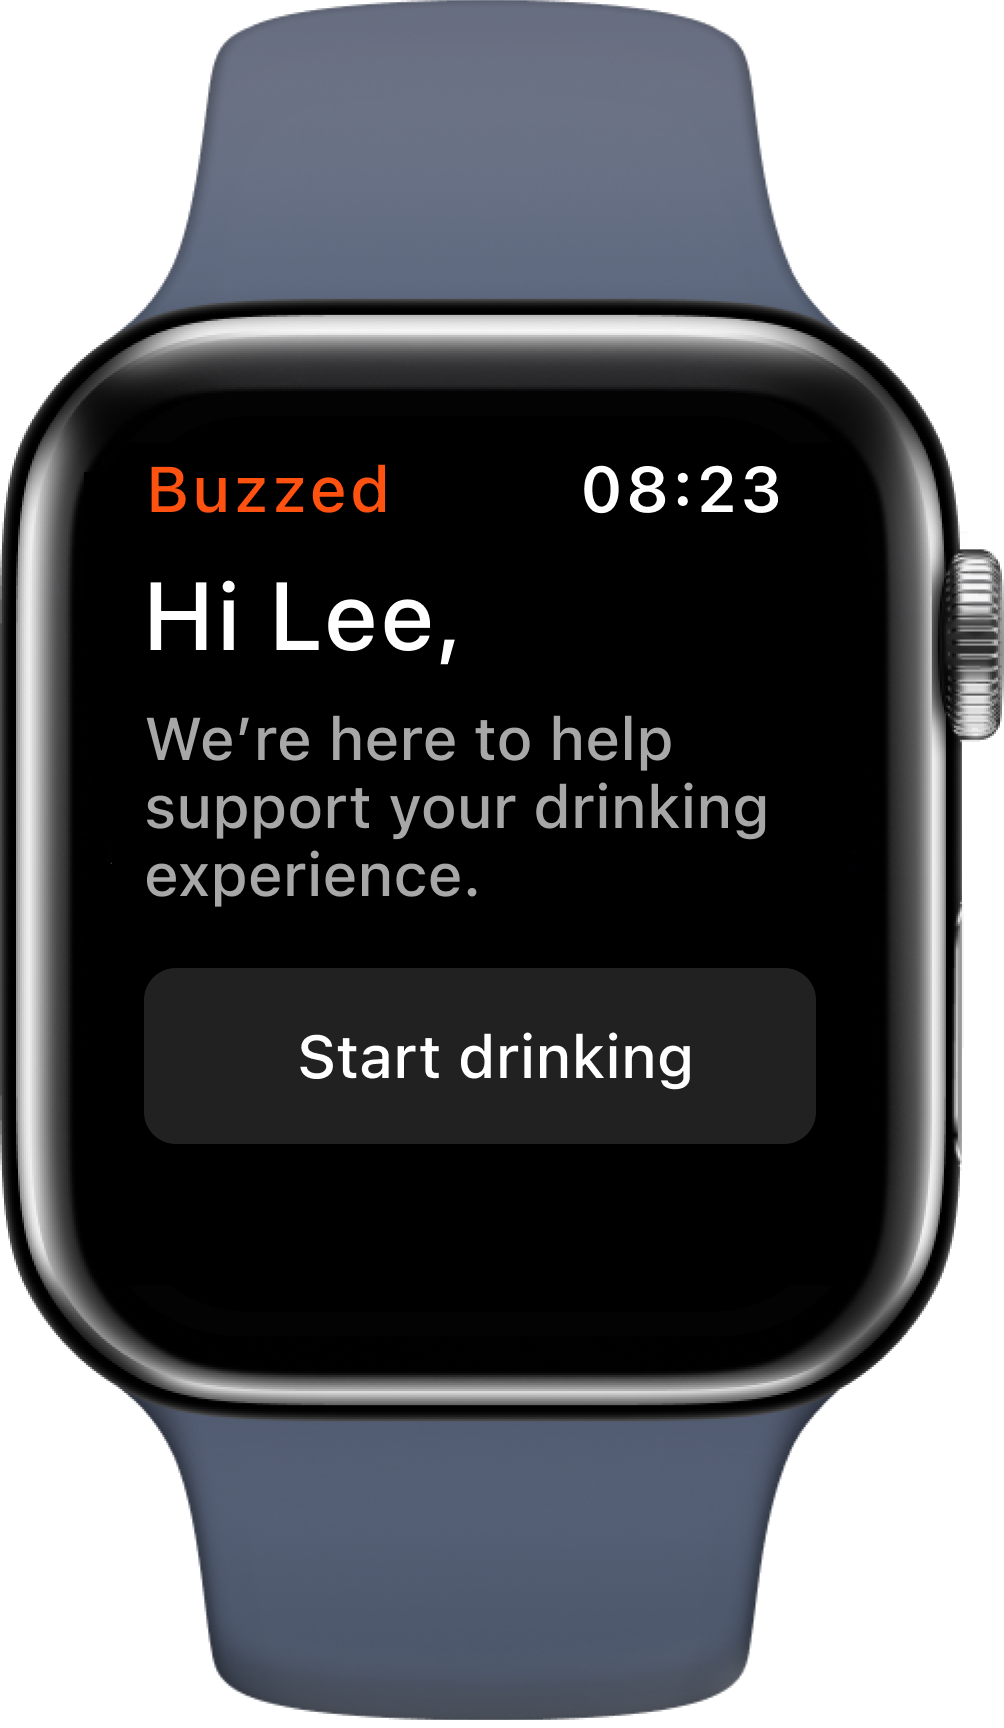
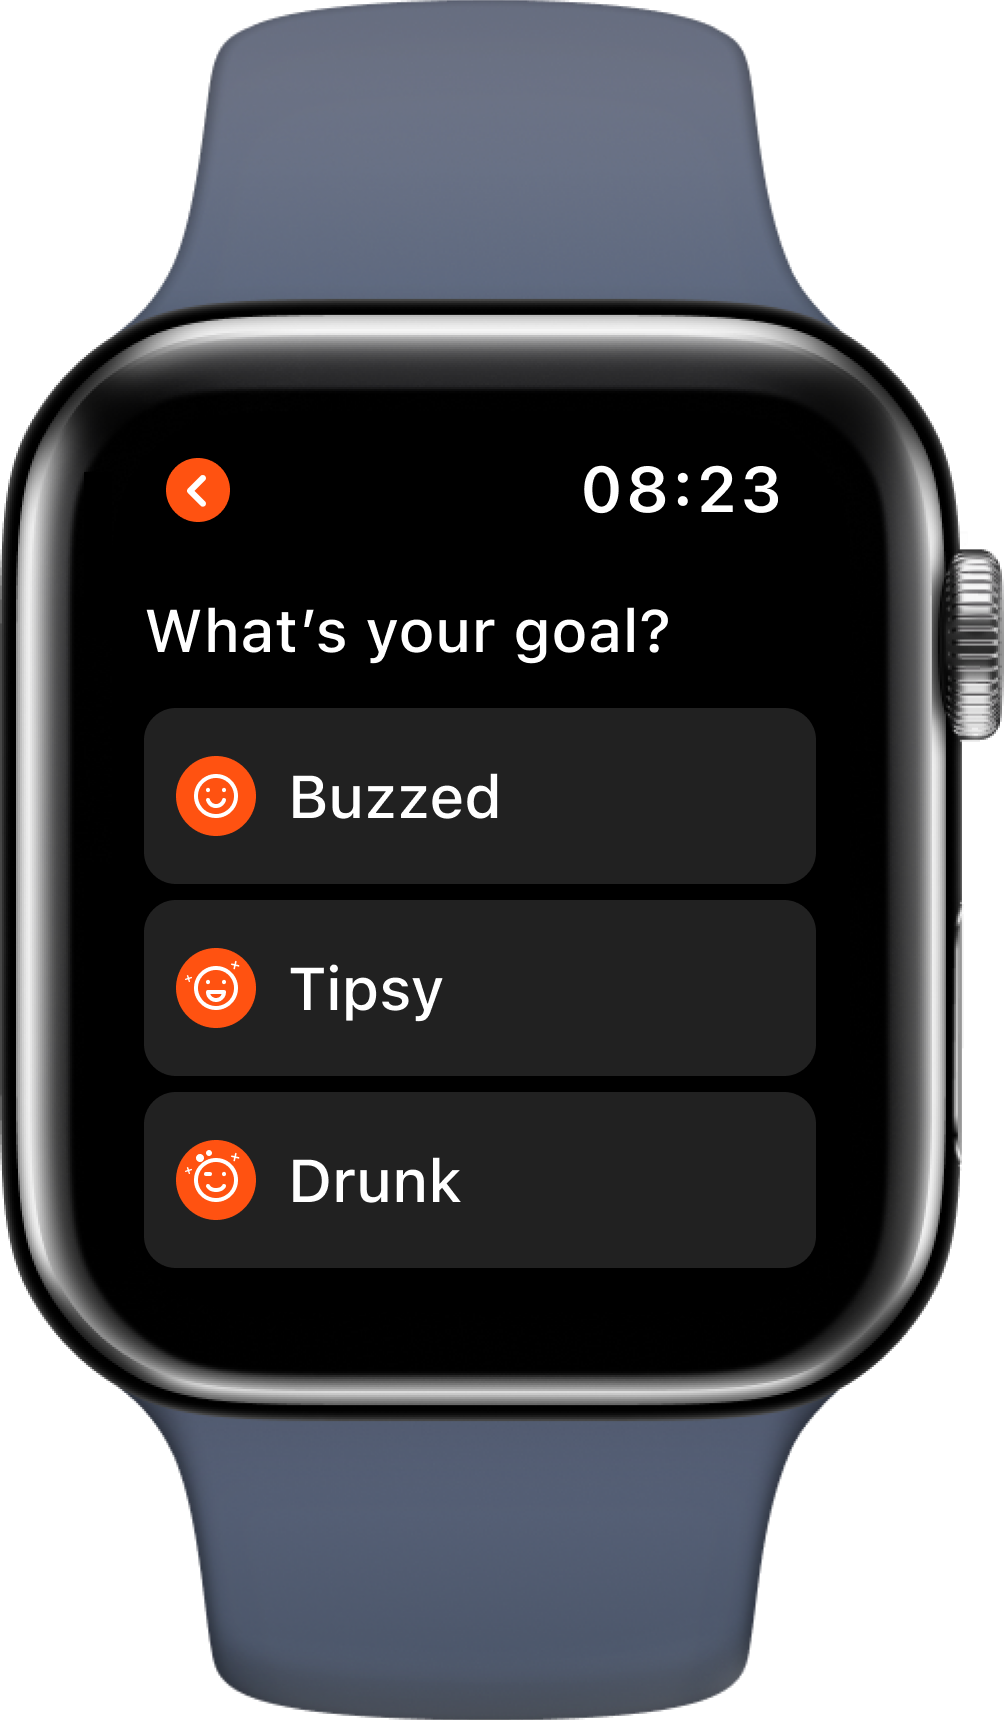
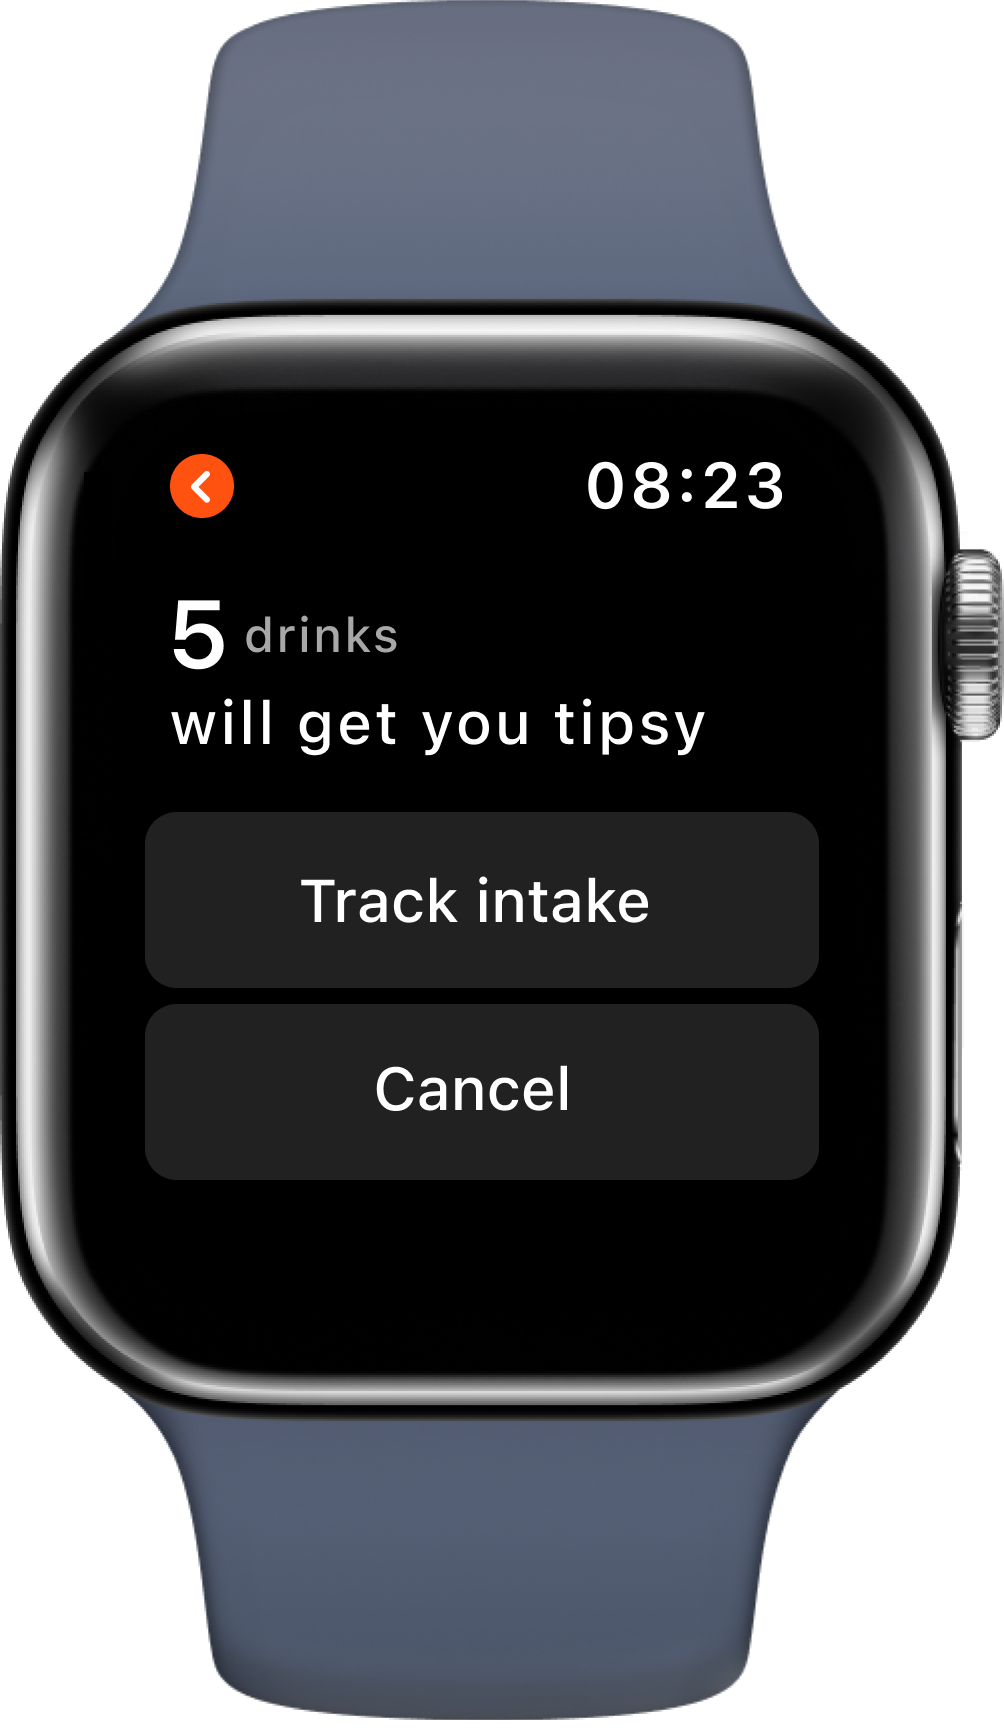
Starting Page
People are able to interact the Buzzed app on their smartwatch. They will need to begin by choosing their goal, then the watch will start by tracking their intake using alcohol and dehydration sensing.
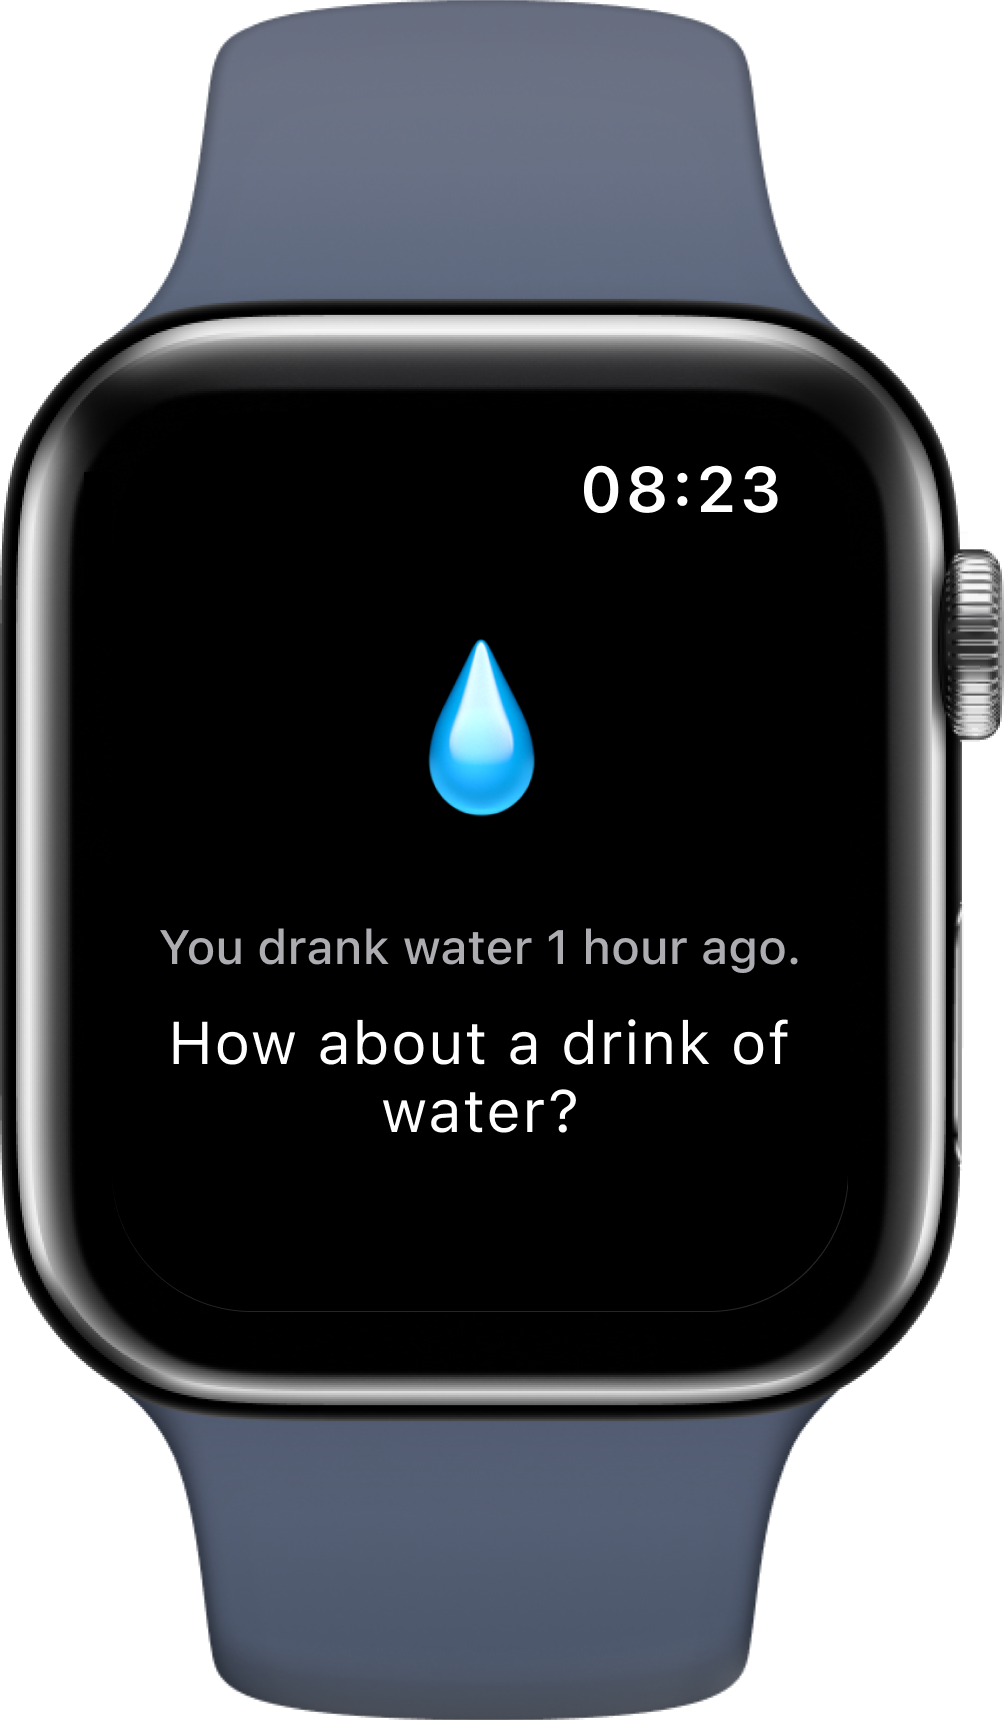
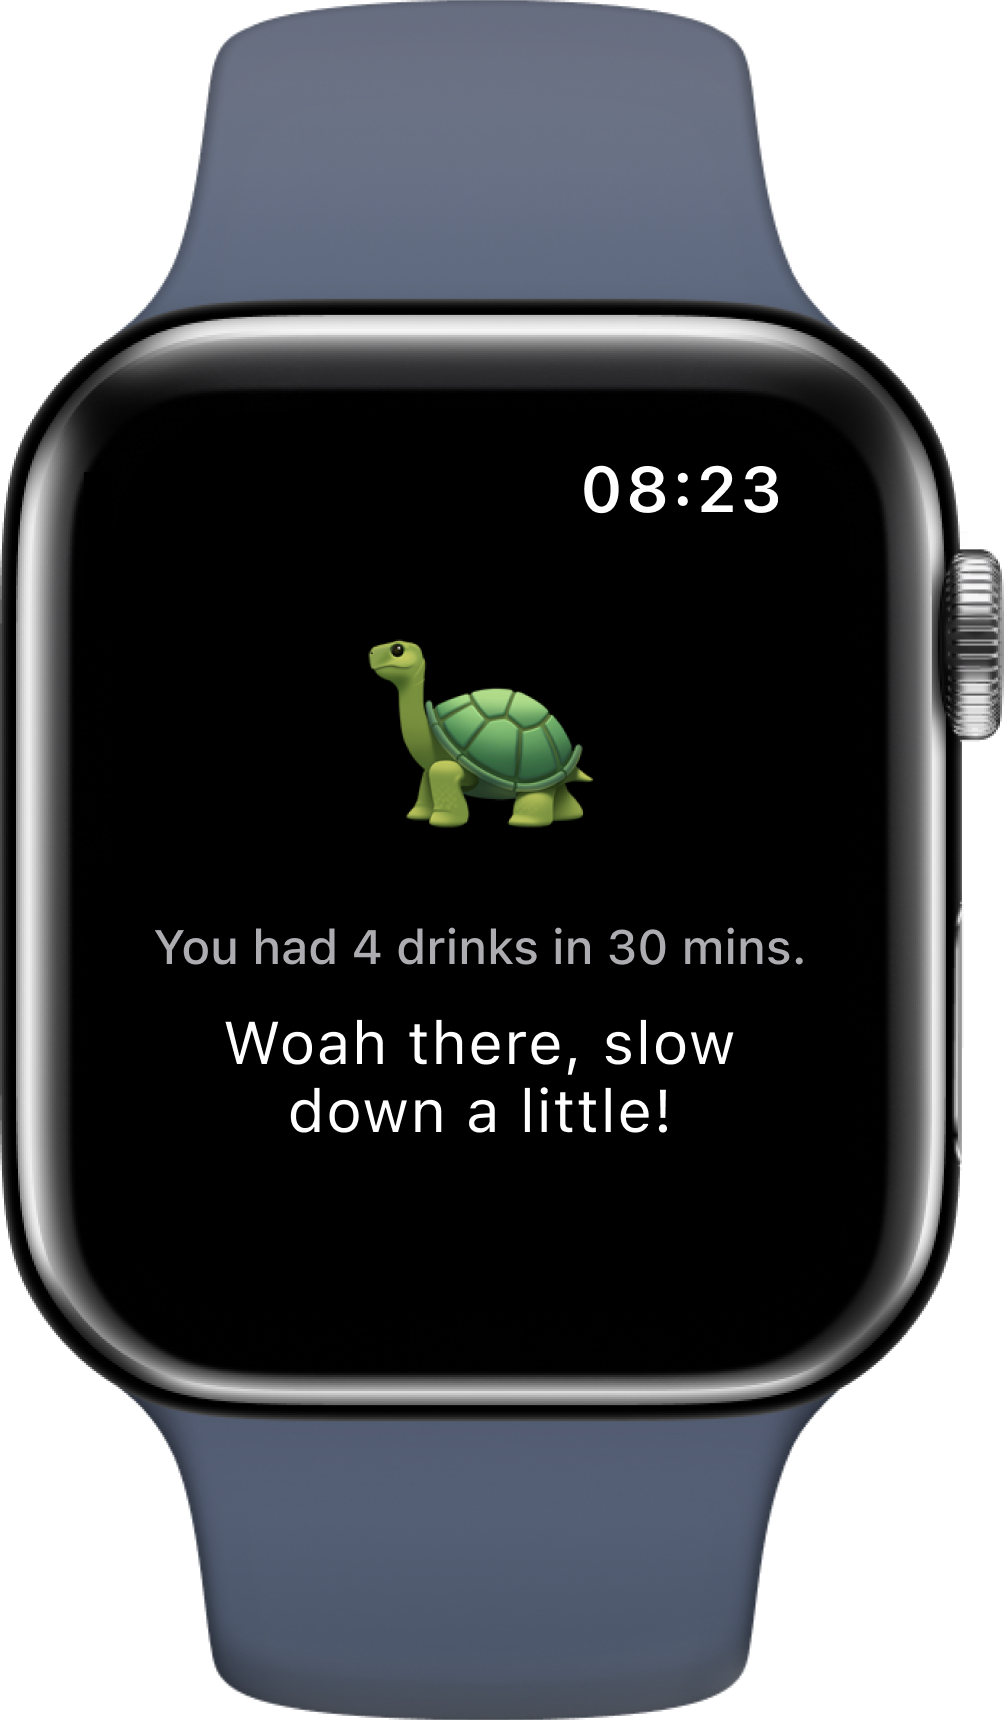
Healthy Recommendations
The watch will buzz and offer healthy recommendations for people to do based on the concurrent tracking data.
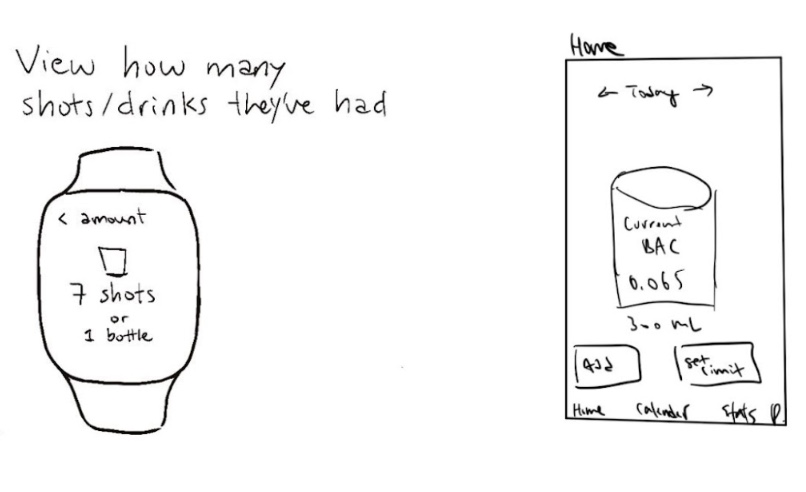
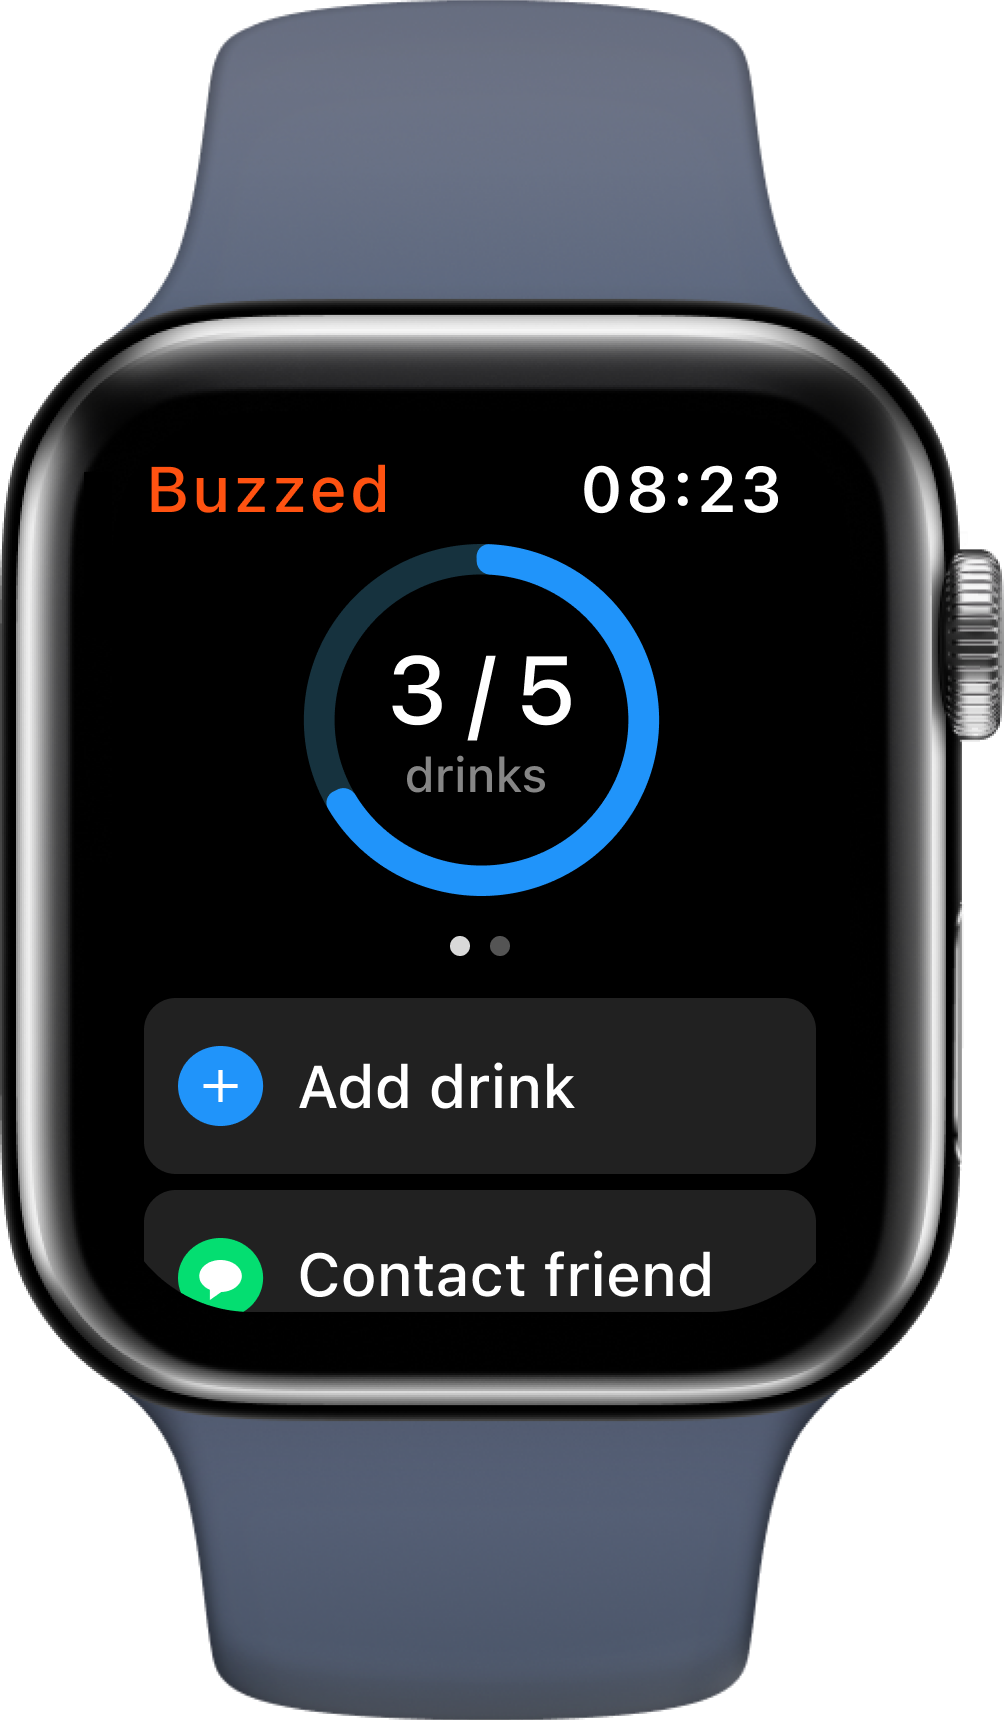
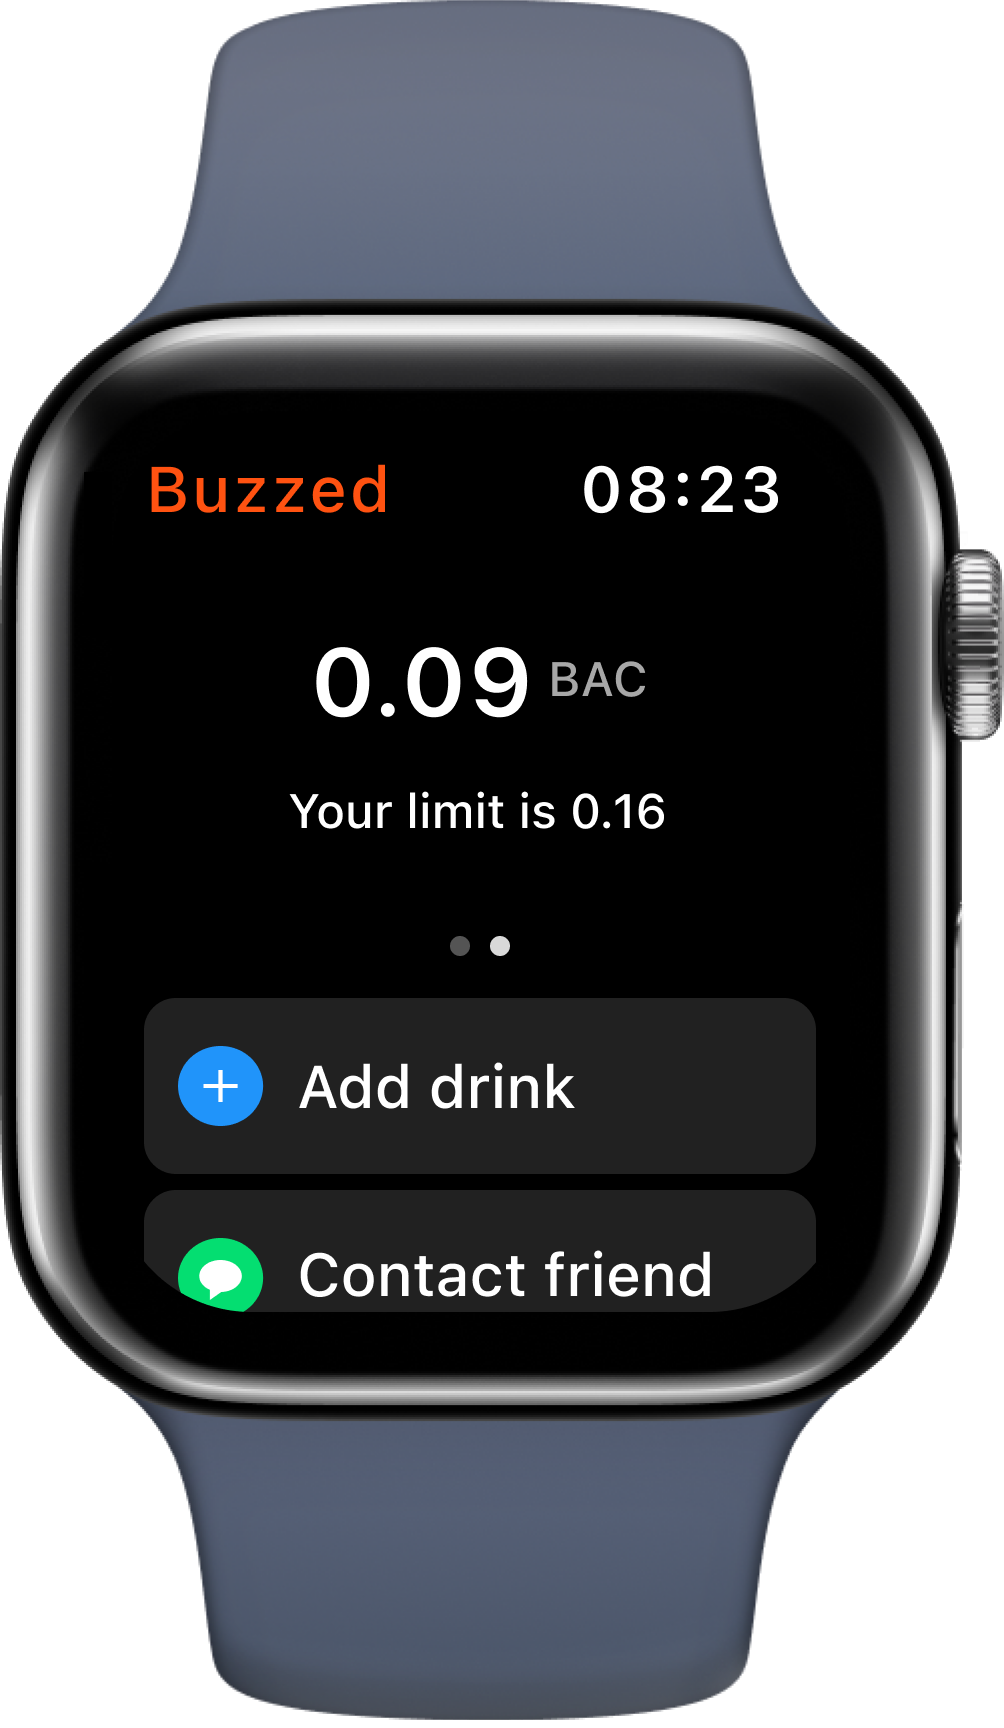
Tracking Data
The home page of the watch app will display tracking data such as the number of drinks the perosn consumed, their current BAC (blood alcohol content), and their limit next to it.
Add drinks
People have the option to add the number of drinks and the app will track their total drinks and display them on the home page.
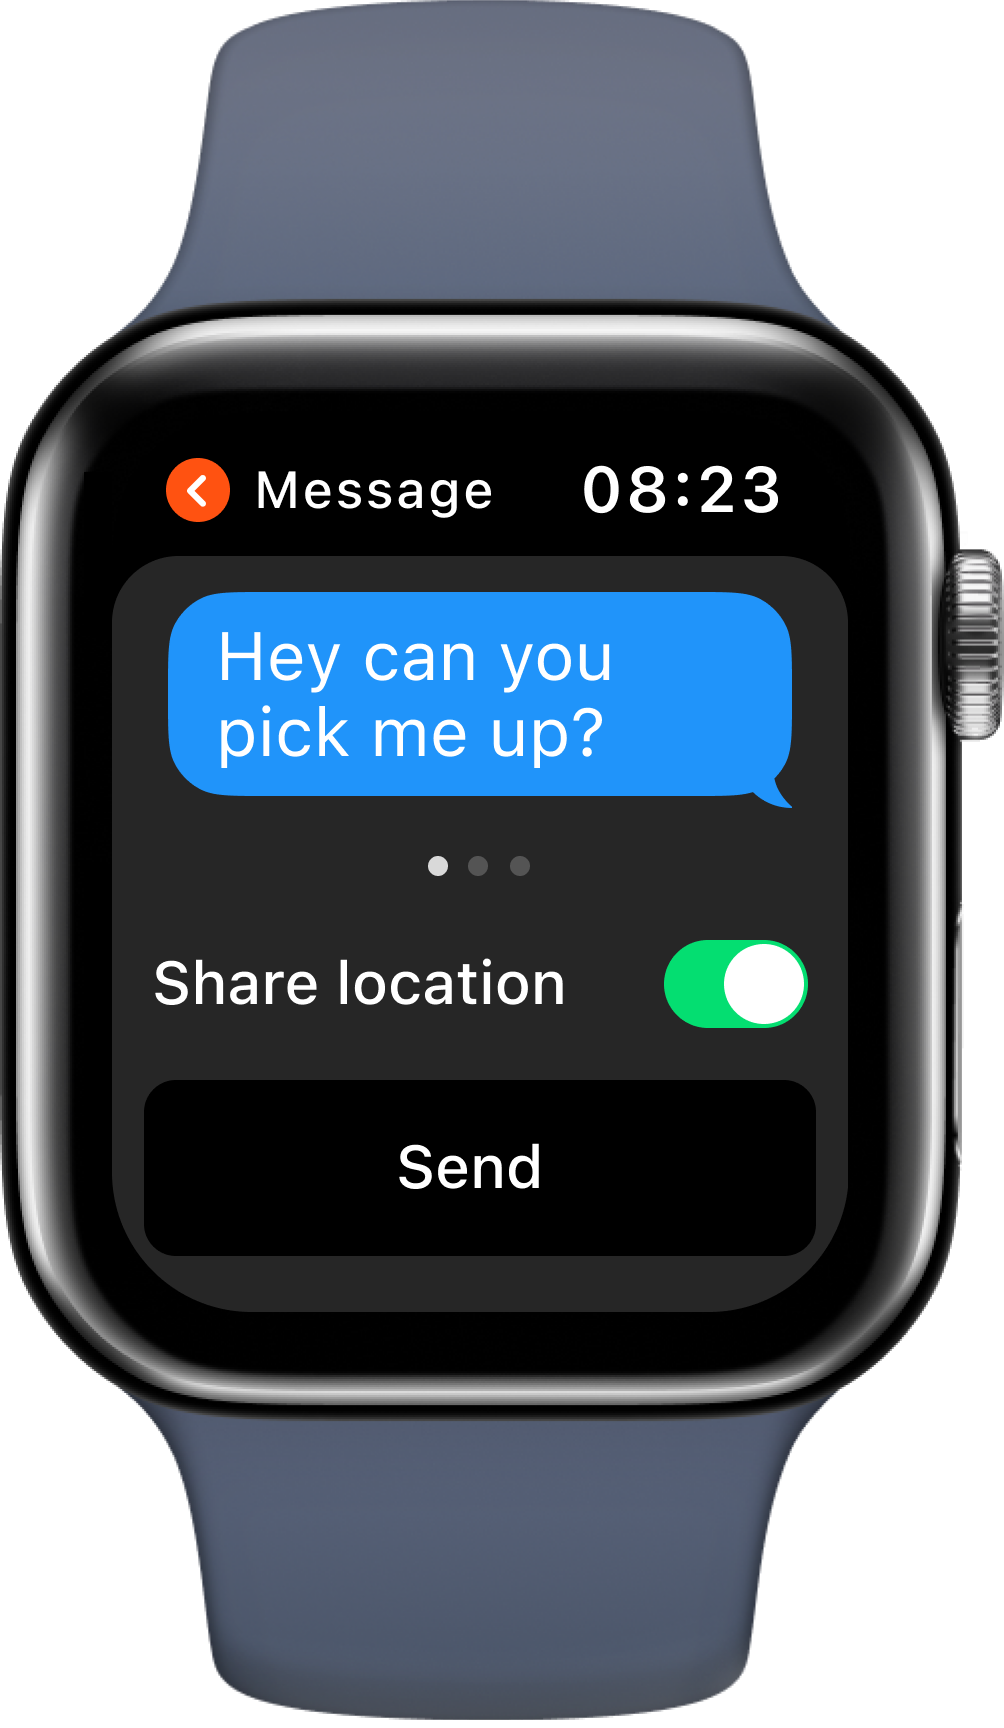
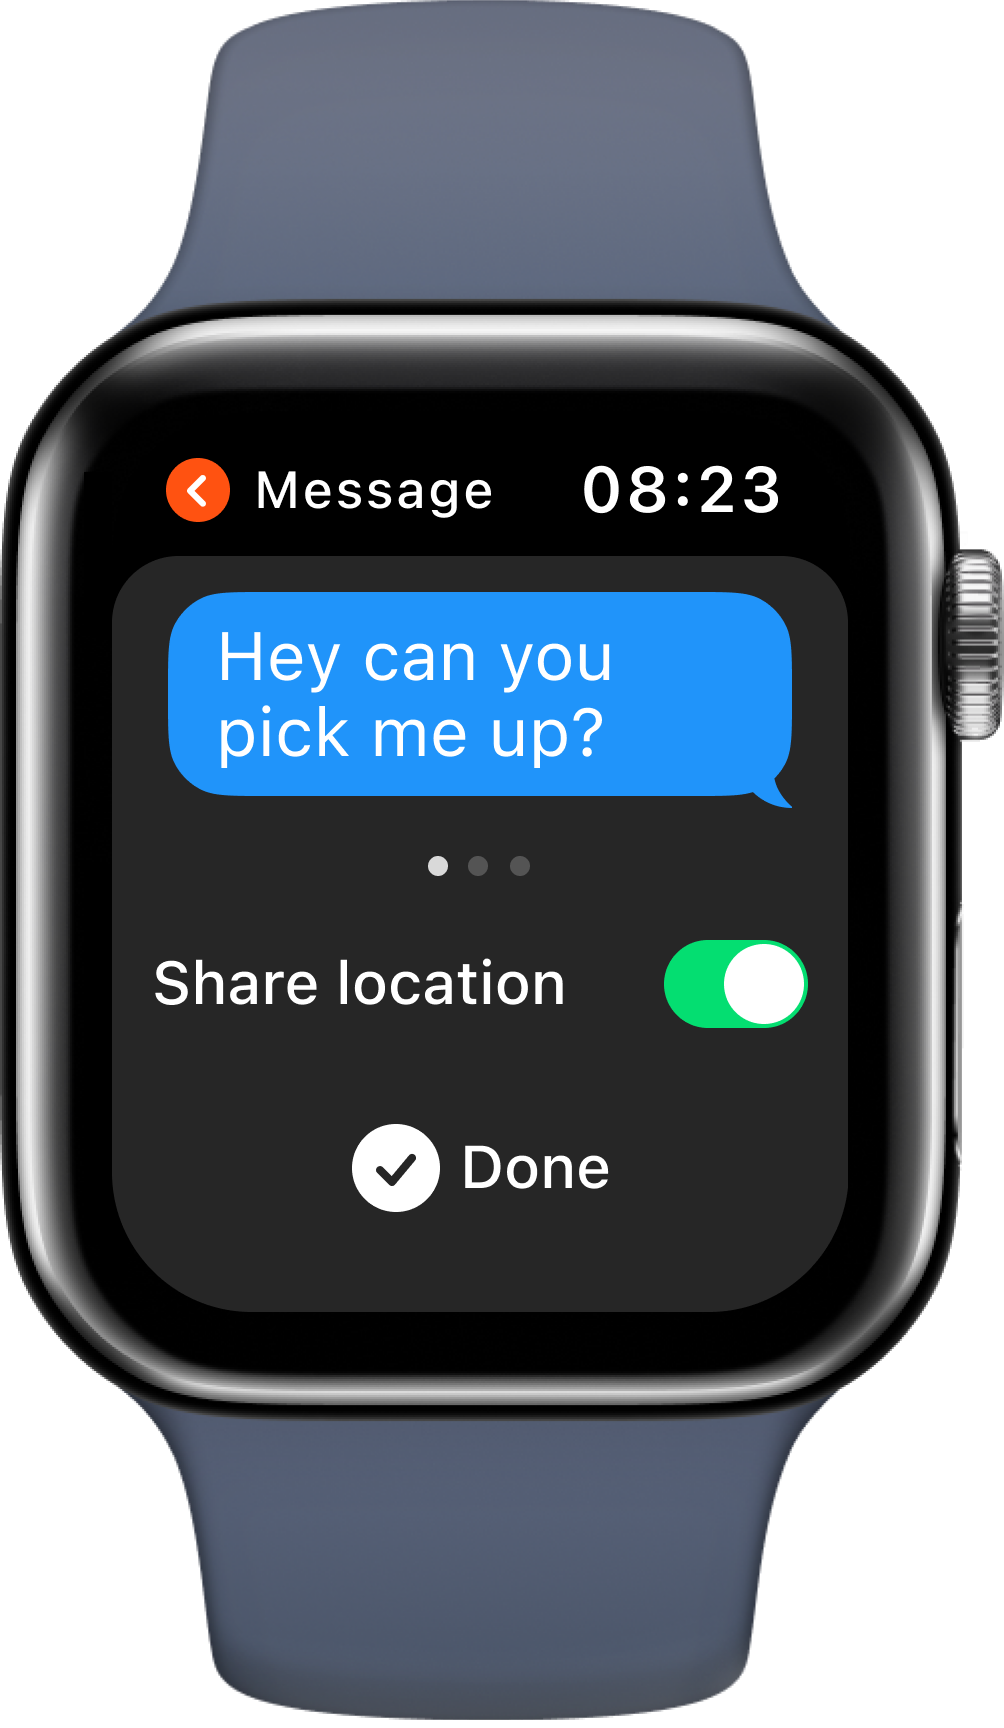
Contact Friends
People are able to contact their friends for help and send their current location.
Task 2: Viewing when they last drank/how much they last drank
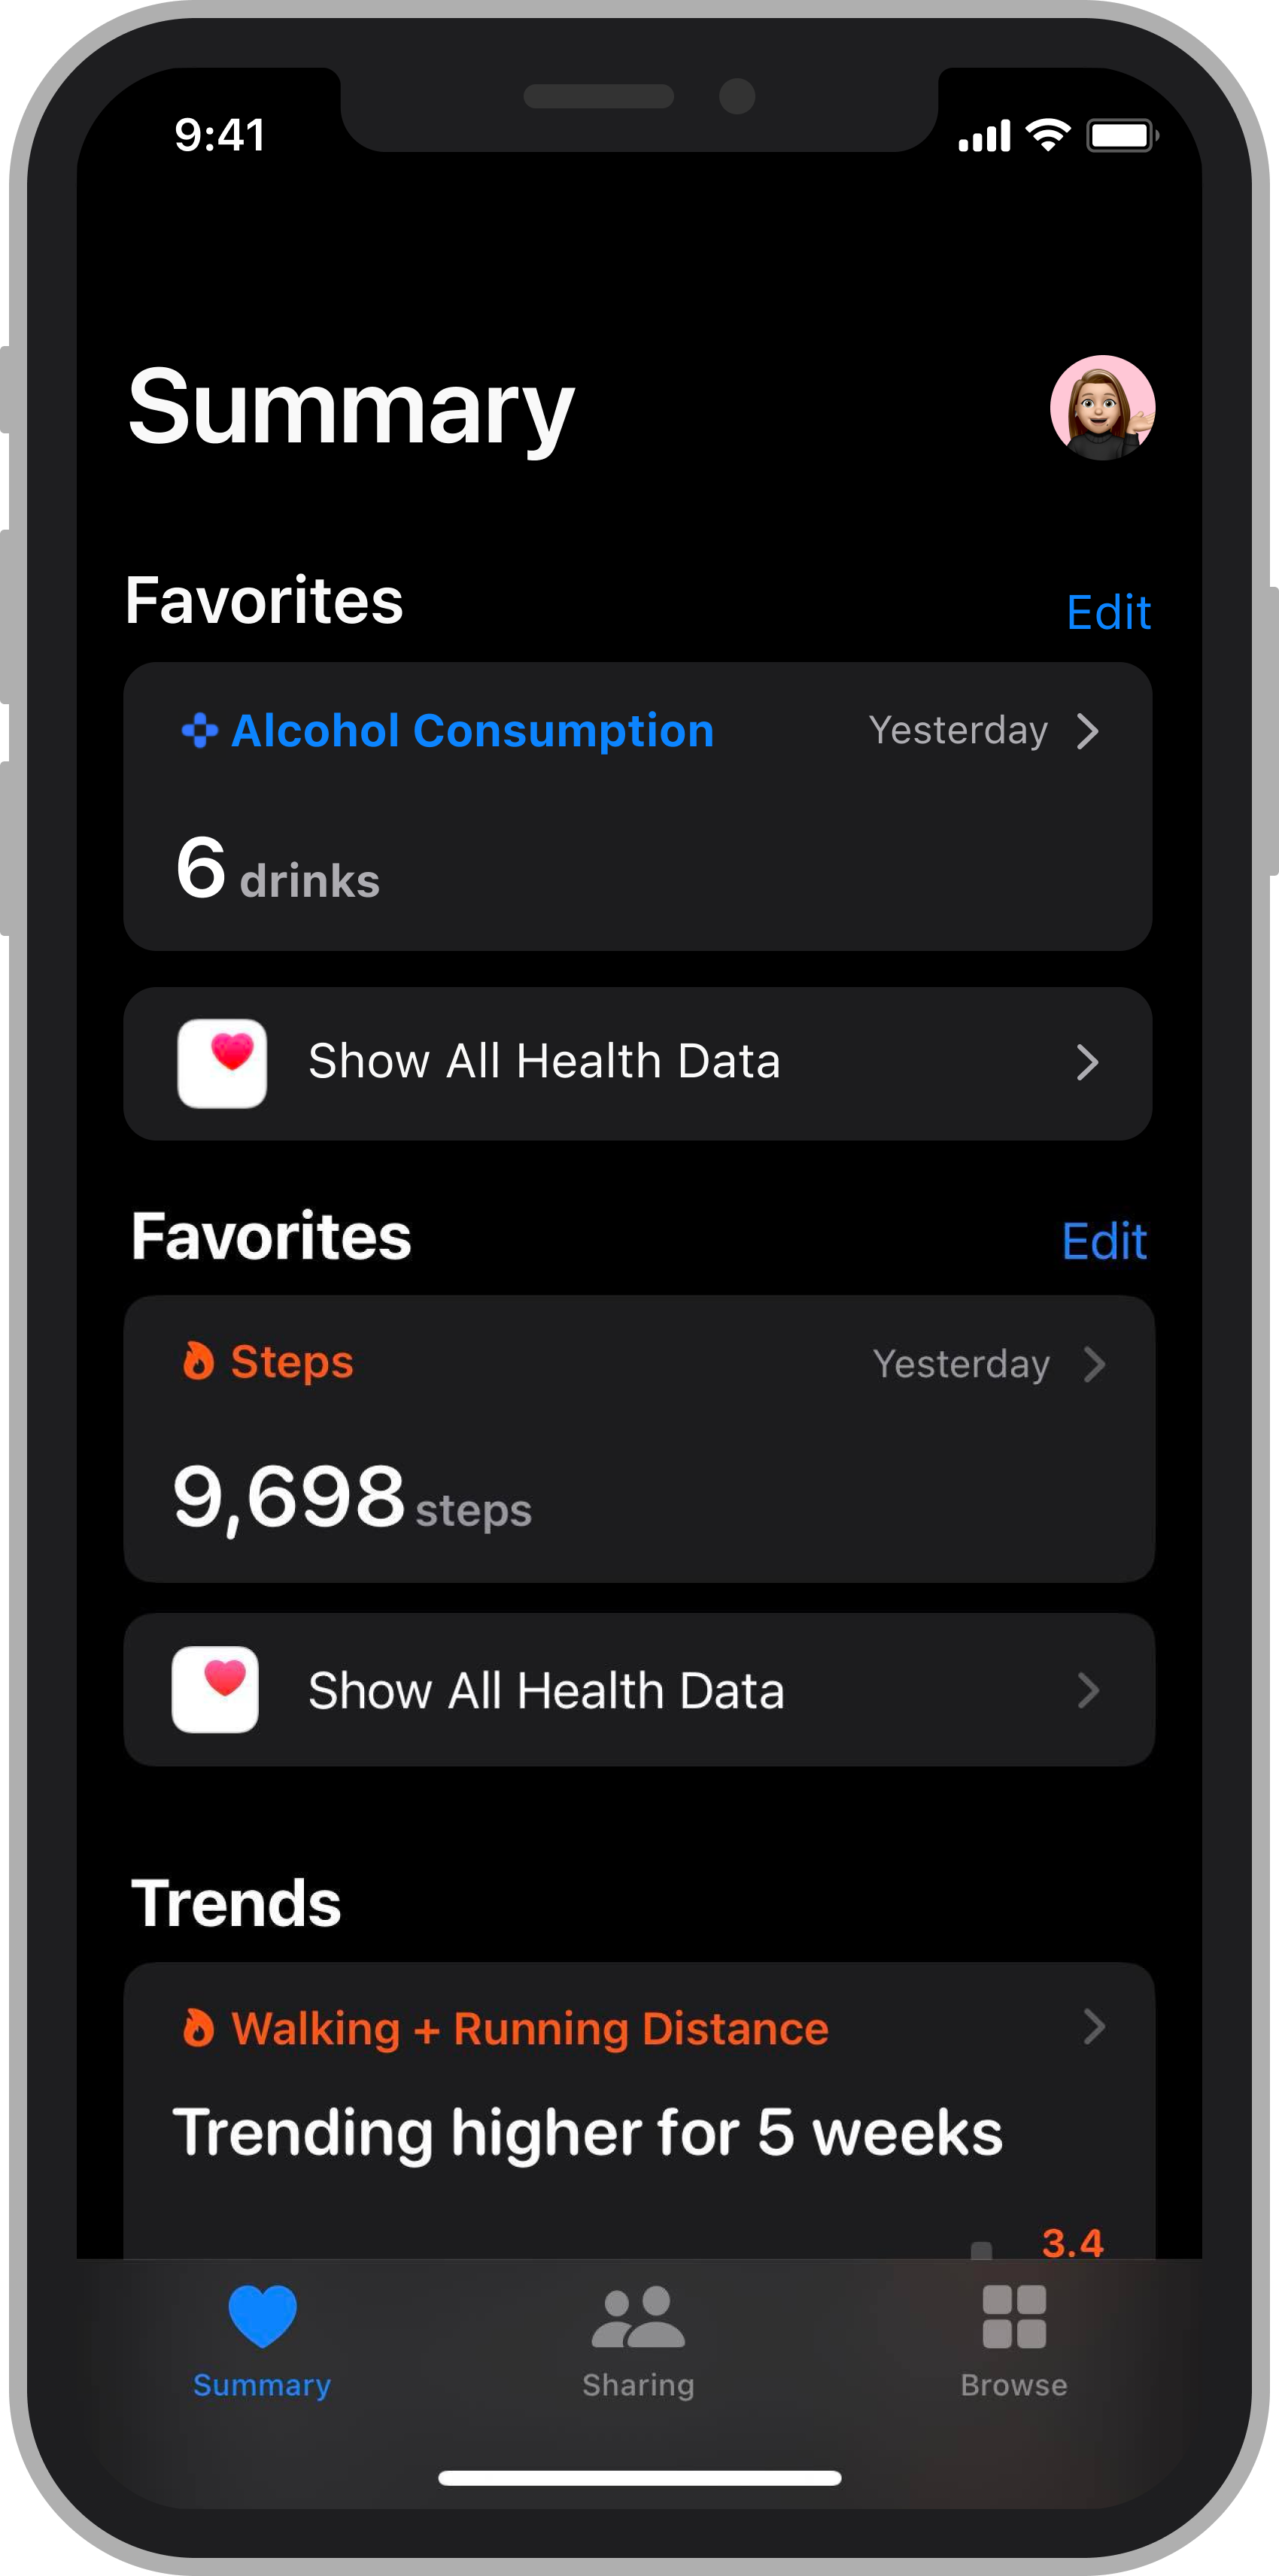
Integrated with Health App
Buzzed is integrated with the people’s health app on their phone for quick and easy access.
Reflection
People will be given a short reflection question regarding how they are currently feeling after consuming alcohol last night.
Detailed statistic
The summary page contains people’s prior tracking data on alcohol consumption.
Drinking Tips
People are also able to see tips on how they might be able to reach their drinking goals and moderate their alcohol consumption next time.