Overview
In this part of the assignment, you will run some code that uses the data structures you implemented in the previous part, and then analyze the resulting behavior. This will generally involve the following steps:
- Read through the experiment
runtimemethods and make a prediction about their resulting behavior. - Run the experiment code and save an image of the resulting plot. (A window displaying the plot should open automatically as the experiment runs.)
- Answer the discussion questions for each specific experiment in order to explain how or why the experiment produced those results.
The hypothesis/predict-based-on-the-code portions of your write-up will be graded based on completion, so just write down your honest thoughts before running the experiment. Please submit all plots generated along with your answers. The post-experiment analysis portions will be graded based on the clarity of your explanations and whether they match up with your plot.
Your completed write-up must be in PDF format. If you have a partner, you will work on this write-up and submit together.
Warning
If your code from the previous part is buggy, your experiments may produce unexpected results. Make sure you pass all tests on Gradescope before you attempt to analyze any experimental results.
Experiments and Discussion Prompts
Task
Follow the directions below to complete the experiments and write-up.
For each of the experiments, make a prediction according to the bolded prompt in your write-up before running the experiment or opening its discussion prompts below.
Then, run the experiment, expand the discussion prompts, and answer the questions inside.
Also include the PNGs of the plots inside your write-up PDF.
Include 1–2 sentences of justification for your predictions, and try to keep answers to discussion questions to a maximum of 2–3 sentences.
Experiment 1: ArrayMap Remove Order
This experiment plots the runtime of removing all entries from your array map, but with two different orderings. Read through the code for each runtime method. Then, predict the order of growth (constant, logarithmic, linear, , quadratic, exponential) of each experiment method’s runtime as its size increases.
Discussion (after running the experiment)
Were you surprised by the results? Let’s review what happened in the experiment.
First, describe the locations of the entries being removed from the dictionary for each runtime method.
Now explain why the methods significantly differ in runtime. Be sure to connect this difference in runtime to the varying locations of removals.
Experiment 2: Chaining with Different hashCodes vs. AVL trees
This experiment explores how different hash code functions affect the runtime of a ChainedHashMap and compares that to the runtime of an AVLTreeMap.
First, we’ll look at the methods involving the ChainedHashMap: runtime1, runtime2, and runtime3. Each runtime method uses a different class as keys for a ChainedHashMap. Each of the different FakeString objects represents a string (by storing an array of chars) but each class has a different implementation of the hashCode method.
Keep in mind that hashCode functions are used to determine where keys belong in a hash table. Without good hashCode functions, the keys in our hash table will frequently collide, which will negatively affect the runtime of our hash table.
Read over the implementations of hashCode in FakeString1, FakeString2, and FakeString3, and expand the box below to show some plots to help illustrate the output distributions of these hash functions.
Histograms
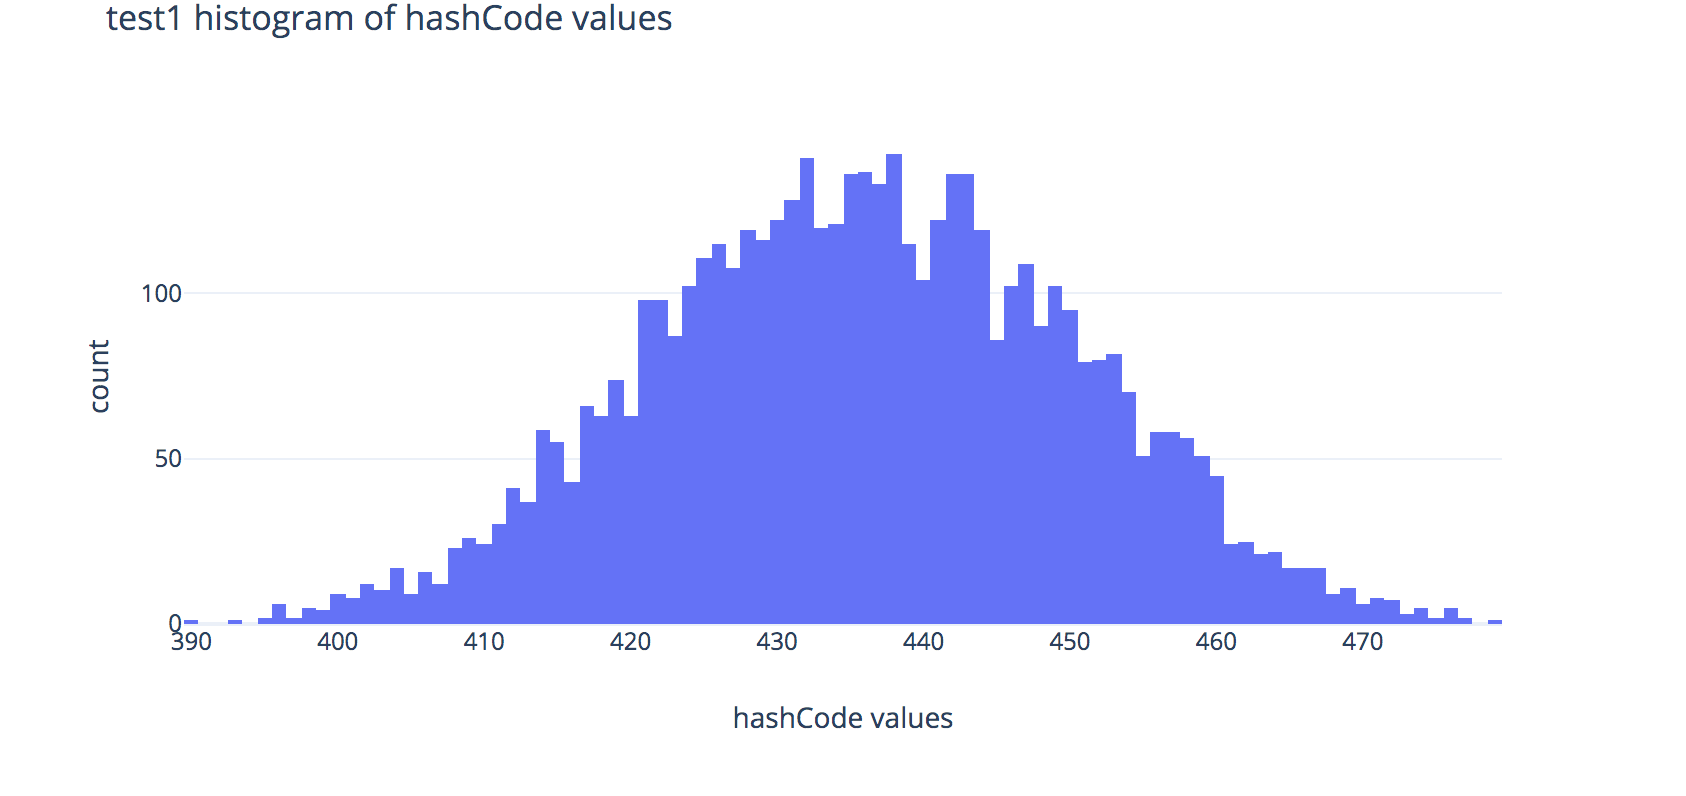
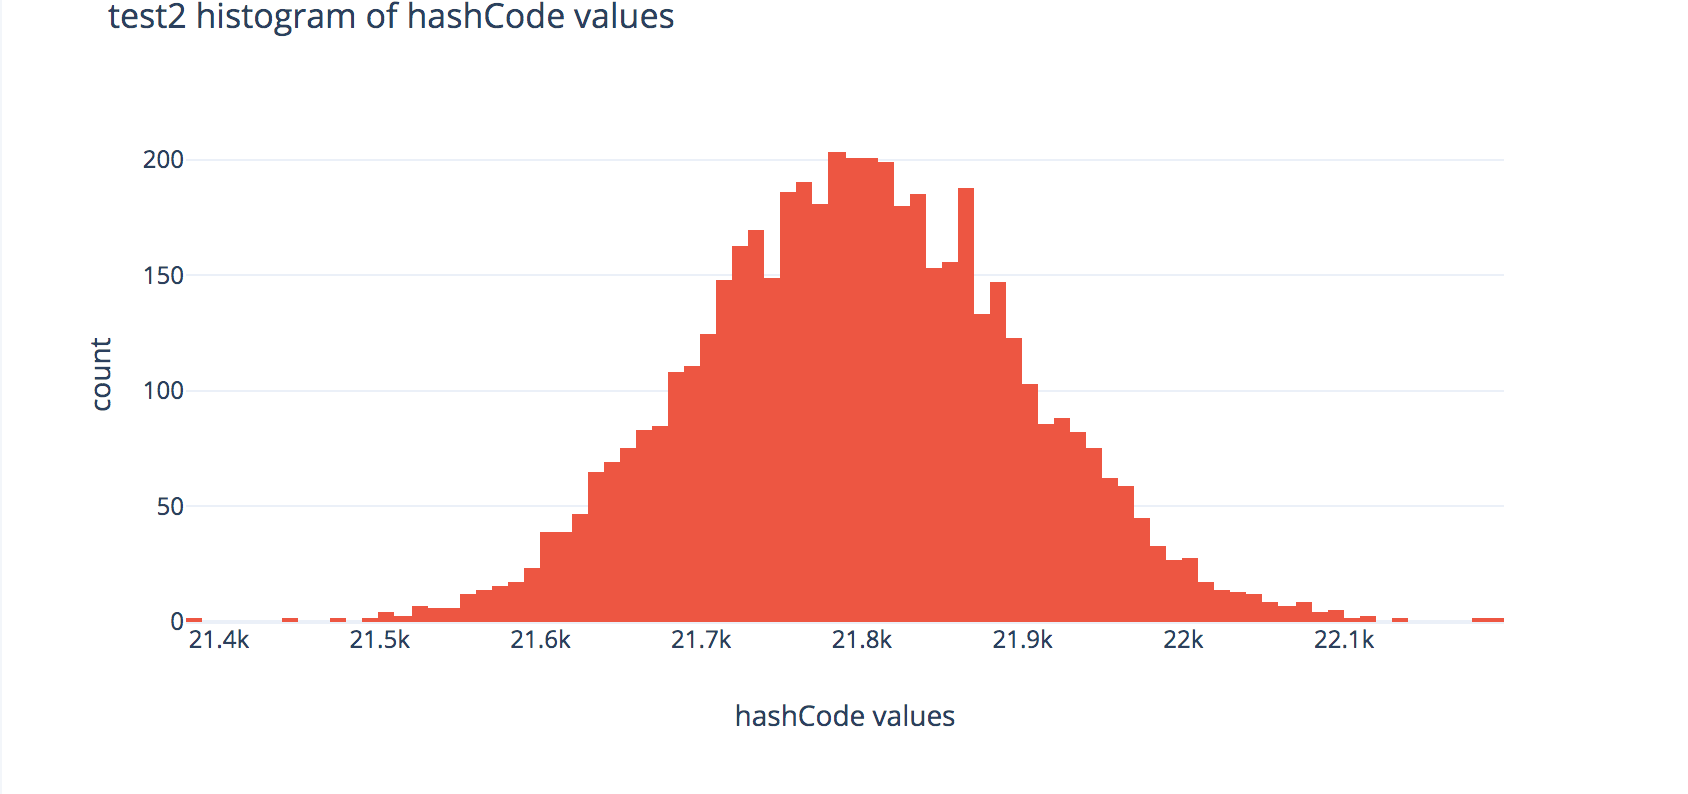
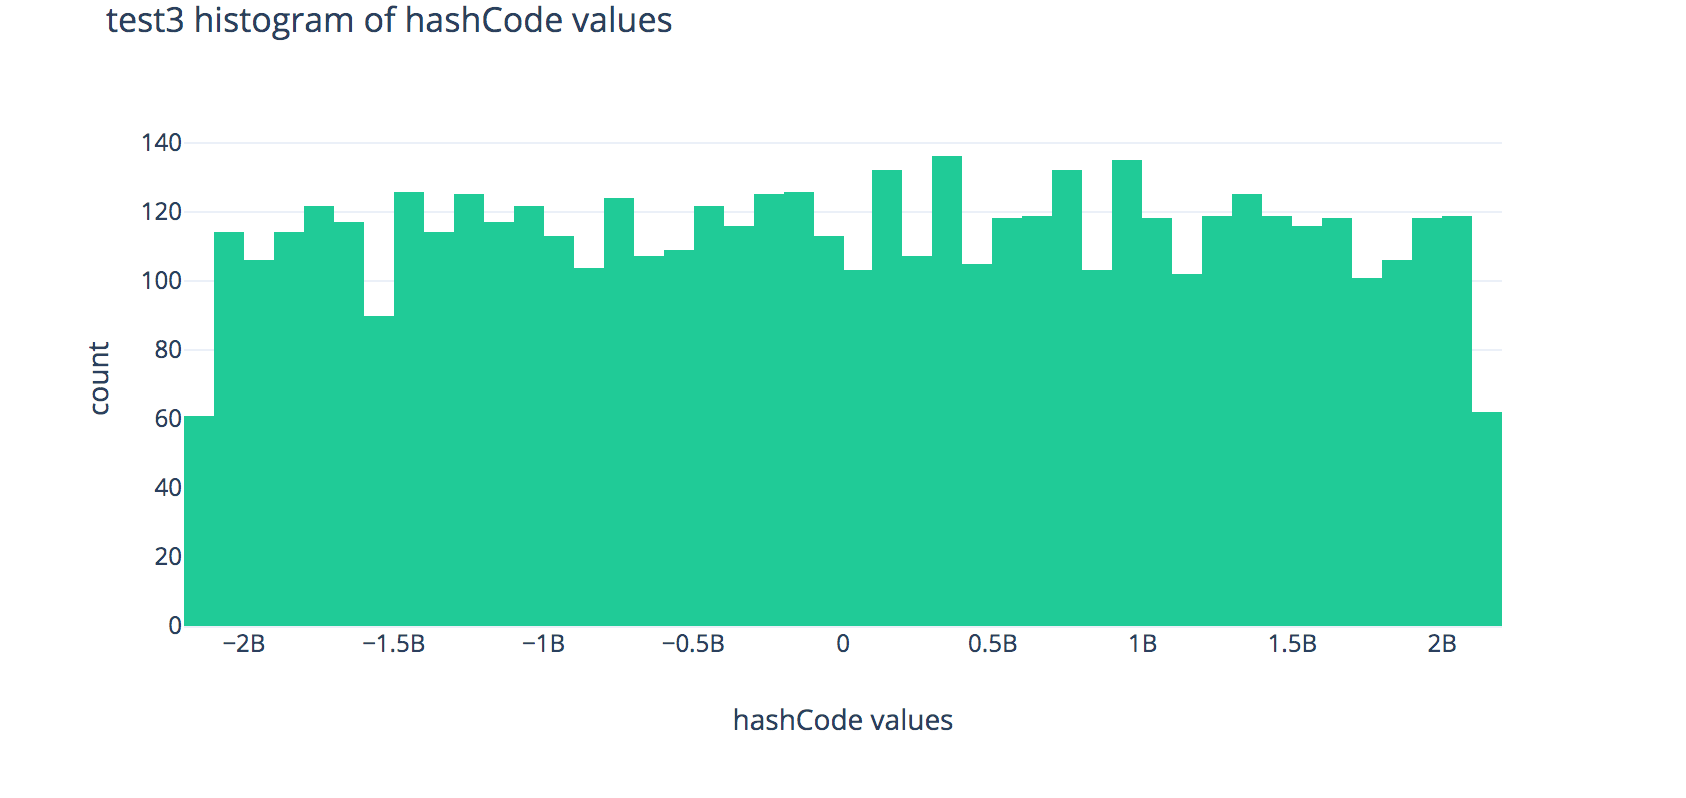
Each plot shows the distributions of outputs of the hashCode methods across 80,000 randomly-generated fake strings.
Histogram for FakeString1:
Histogram for FakeString2:
Histogram for FakeString3:
Predict which runtime method will be asympotically fastest and which runtime method will be asympotically slowest.
Discussion (after running the experiment)
- Note that the distributions for the hash codes used in
runtime1andruntime2look very similar in shape, but in your graphs you produce, you should see thatruntime2tends to run much faster thanruntime1—why is that? Hint: look at the x-axis scale labels. - You should also see that
FakeString3produces the fastest runtimes when used as keys forChainedHashMap—why is this? Explain using the histogram above, citing at least 1 observation about the histogram.
Now, we’ll consider runtime4, which uses AVLTreeMap. This test uses a fake string class that does not provide a working hashCode method, but is comparable in a way that mimics regular String comparisons. You should see that the AVL-tree-based implementation performs much better than a chained-hash implementation that’s used with bad key objects, but looks like it’s only about a constant factor worse than chained-hashing with good keys.
- What interface does
AVLTreeMaprequire its keys to implement? Why does this requirement need to be different from other implementations ofMap, such asChainedHashMaporArrayMap? - Rank the string classes (
FakeString1,FakeString2,FakeString3, andComparableFakeString—the one used in the AVL tree) in order of the asymptotic runtimes of their experiment methods, from fastest to slowest.
Experiment 3: Load Factor Thresholds for Resizing
This experiment tests the runtime for ChainedHashMap‘s put method across different values of the load factor threshold for resizing.
First, answer the following prompts:
- Briefly describe the difference between
runtime1andruntime2. - Predict which of the two methods’ runtimes will have a higher order of growth. If they have the same order of growth, also predict which will run asymptotically slower.
Discussion (after running the experiment)
- Why is using the load factor threshold of 300 slow? Explain in terms of average chain length and/or the frequency of resizing.
- This was not a part of this experiment, but explain why very small load factor thresholds (much less than 0.75; e.g., 0.05) might be wasteful.
Submission
Task
Submit your write-up PDF to Gradescope as a group.
When you submit, mark which pages correspond to the questions we ask. After submitting, the partner who uploaded the PDF must add the other partner as a group member on Gradescope. Do not have each member submit individually. The process for adding group members is the same as for the programming portion; if you need a reminder, here’s the video demonstrating the process.
We may deduct points if you do not correctly submit as a group or do not properly assign your pages/problems.
