Overview
In this part of the assignment, you will run some code that uses the data structures you implemented in the previous part, and then analyze the resulting behavior. This will generally involve the following steps:
- Read through the experiment methods and make a prediction about their resulting behavior.
- Run the experiment code and save an image of the resulting plot. (A window displaying the plot should open automatically as the experiment runs.)
- Answer the discussion questions for each specific experiment in order to explain how or why the experiment produced those results.
The hypothesis/predict-based-on-the-code portions of your write-up will be graded based on completion, so just write down your honest thoughts before running the experiment. Please submit all plots generated along with your answers. The post-experiment analysis portions will be graded based on the clarity of your explanations and whether they match up with your plot.
Your completed write-up must be in PDF format. If you have a partner, you will work on this write-up and submit together.
Warning
If your code from the previous part is buggy, your experiments may produce unexpected results. Make sure you pass all tests on Gradescope before you attempt to analyze any experimental results.
Introduction
Background
An introduction to the experiment plot window.
The experiment executable classes for this assignment can be found in the deques.experiments package. There are other supporting files in the edu.washington.cse373.experiments package of the root src module, but we don’t expect you to need to inspect those too closely in order to understand the experiments, beyond maybe reading some of the method documentation.
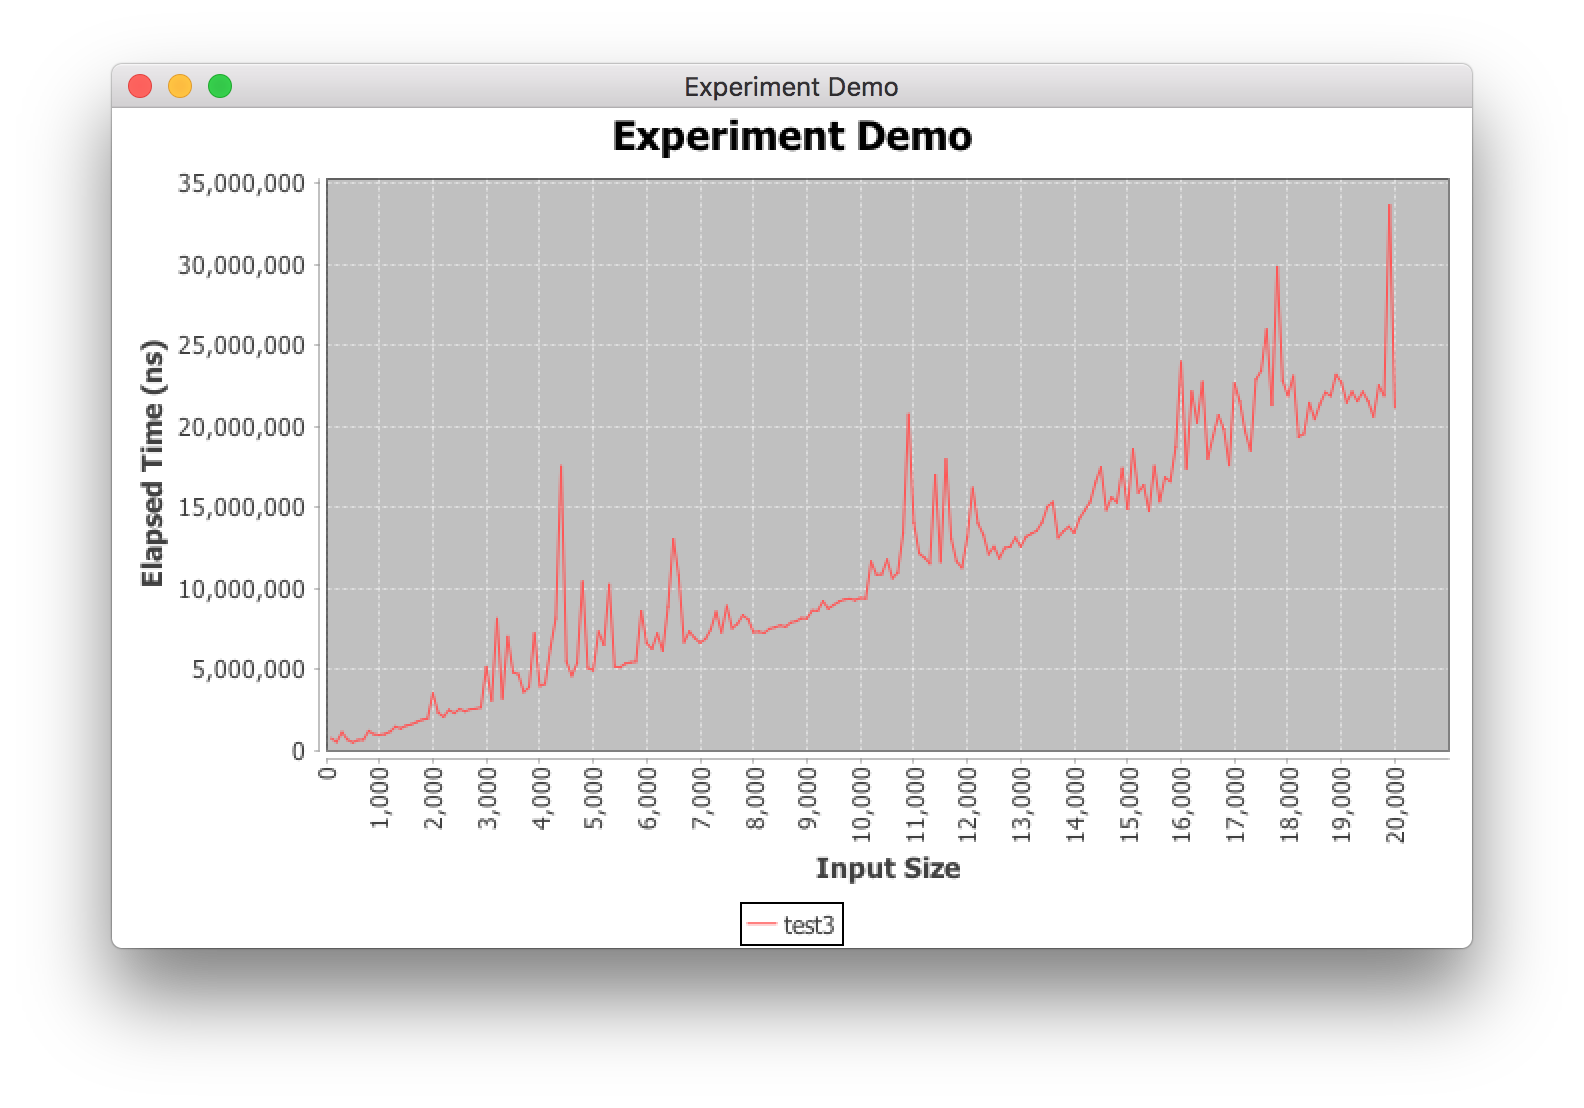
When you run one of the experiments, a new window should open that plots the results in real time. The window should look something like this:
Saving Plots
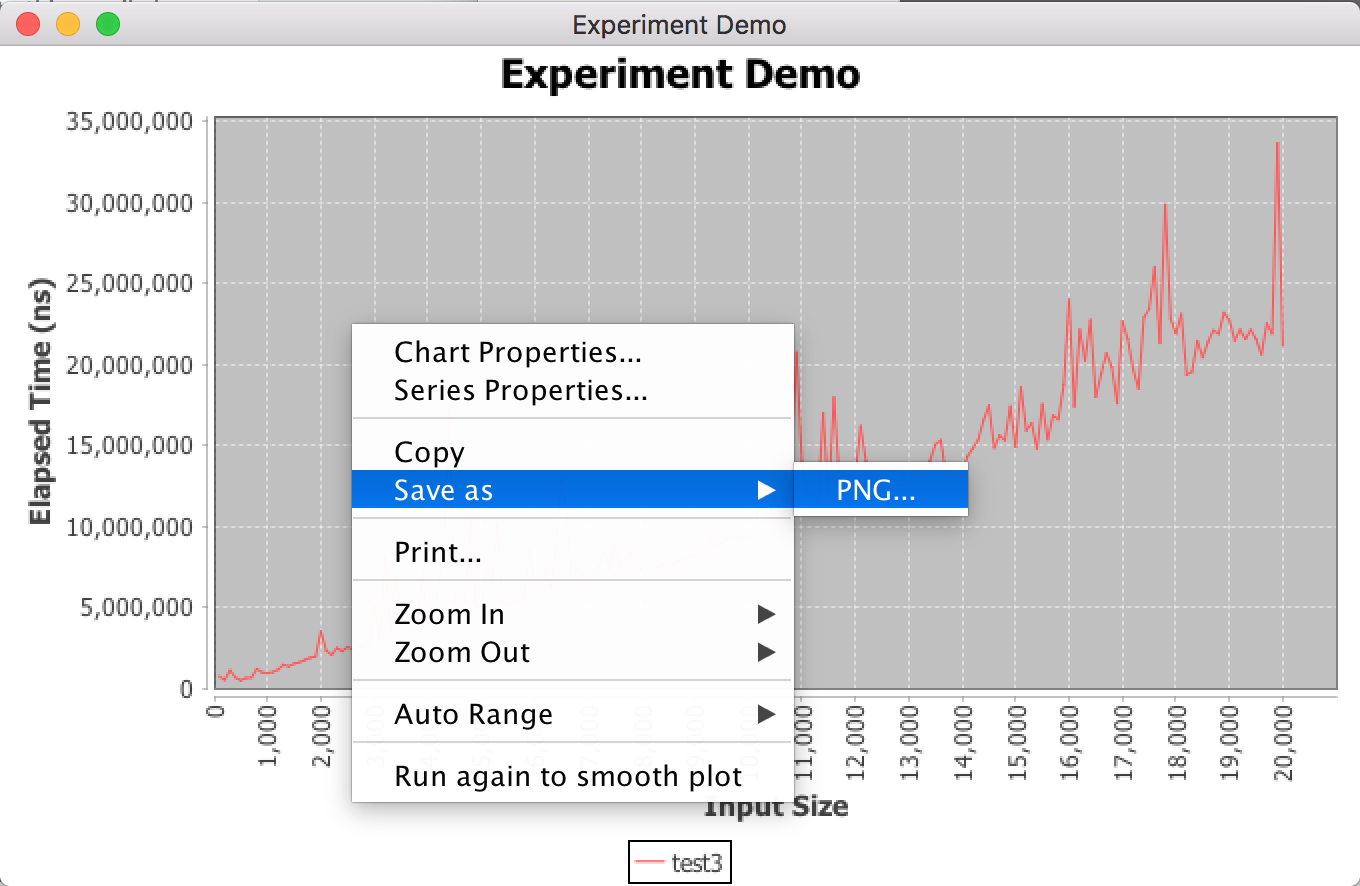
To save these files, right click anywhere on the plot to bring up the context menu. Select Save as » PNG… to save the file.
Note
We’ve set PNG files to be ignored in your git repos, so if you want to share these images with your partner, you’ll have to use other means.
Other settings
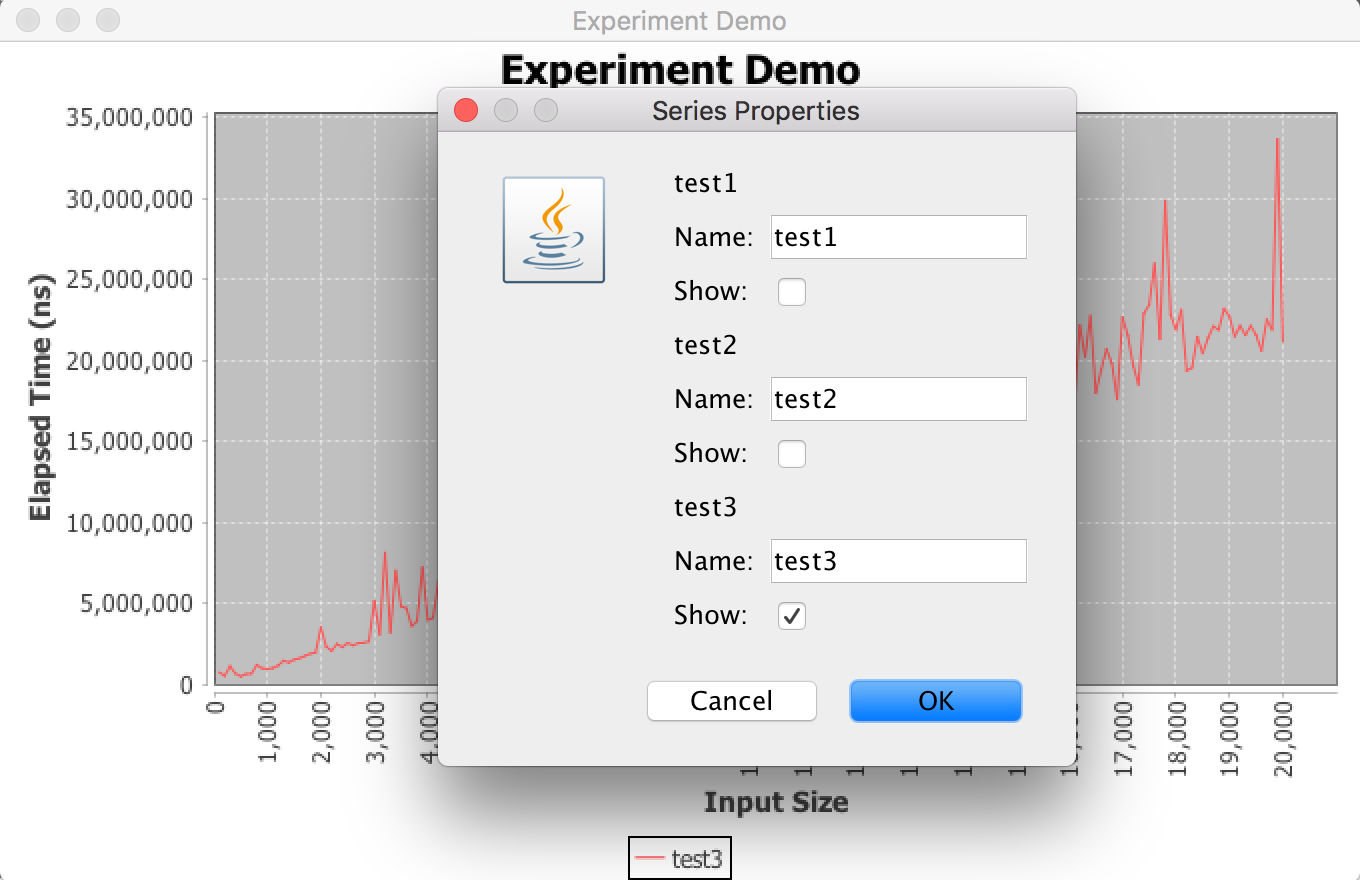
There are a couple more useful options for the plots, such as renaming and hiding results. To access the menus, right click and select Series Properties… to be brought to the menu shown below. Here you can hide results that grow too quickly, allowing you to view the other results better. You can also rename their legend entries here.
Feel free to also explore the other menu options. If you wish to rename the plot titles or axes labels, you may do so from the Chart Properties window.
Note
To zoom in on a specific region of your plot, click and drag right and down to select the region. If you want to reset the zoom, drag in any other direction. You can also zoom through the right-click menu.
Experiments and Discussion Prompts
Task
Follow the directions below to complete the experiments and write-up.
For each of the experiments, make a prediction according to the bolded prompt in your write-up before running the experiment or opening its discussion prompts below.
Then, run the experiment, expand the discussion prompts, and answer the questions inside.
Also include the PNGs of the plots inside your write-up PDF.
Experiment 1: LinkedDeque.get
This experiment will check the runtime of getting various indices of your deque. Read through the code for each test method of the experiment and predict the order of growth (constant, logarithmic, linear, , quadratic, exponential) of each method’s runtime as its size increases. You do not need to justify your answers.
Then, run the experiments.
Discussion (after running the experiment)
You should see that get runs quickly for indices at the front or back of your deque, and much more slowly for indices in the middle. In each test method (f1, f2, and f3), the get calls end up hitting some particular case of the runtime for that input size—specify which case (best/worst) is happening in each test method. Justify in a maximum of 2–3 sentences.
Experiment 2: Deque Memory Usage
In this experiment, we’ll plot the memory usage of LinkedDeque and ArrayDeque objects.
Both test methods simply construct an instance of the corresponding data structure with the given input size. Predict the order of growth (constant, logarithmic, linear, , quadratic, exponential) of the memory usages of each as its size increases. You do not need to justify your answers.
Then, run the experiments.
Discussion (after running the experiment)
You should notice that the memory usage for LinkedDeque increases linearly as its size increases. This is in contrast to ArrayDeque, which has memory usage that increases mostly-linearly, but sometimes has spikes in memory usage. What is the cause of the spikes in the data for ArrayDeque? Justify in a maximum of 2–3 sentences.
(Note: the “vertical” spikes you will see in the graph will be slanted to the right because we don’t run the experiment functions (f1 and f2) for every possible input size—only for multiples of the STEP constant. On the plot, the points on either end of the spike get connected to display a slanted line instead of a true vertical spike.)
Submission
Task
Submit your write-up PDF to Gradescope as a group.
When you submit, mark which pages correspond to the questions we ask. After submitting, the partner who uploaded the PDF must add the other partner as a group member on Gradescope. Do not have each member submit individually. The process for adding group members is the same as for the programming portion; if you need a reminder, here’s the video demonstrating the process.
We may deduct points if you do not correctly submit as a group or do not properly assign your pages/problems.
