name: inverse layout: true class: center, middle, inverse --- class: center, middle, inverse # Evaluating Interactions ## Running a Quantitative Study Lauren Bricker CSE 340 Winter 23 --- layout: false [//]: # (Outline Slide) # Today's Agenda - Administrivia - Menus video checkpoint due (Wed 8-Feb) - Menus code part 1-4 due (Sat 11-Feb) - Finish [Properties of People II](people-motor.html#34) - Quick review of [Menus](/courses/cse340/23wi/assignments/menus.html) - Evaluating Interactions through a Quantatative study - Why study people at all? - Use key properties of people to predict design outcomes - Designing the Menus experiment - Practice data analysis - Go over parts 5 & 6 of Menus --- layout:false # Impressions?  .footnote[Sources: [Elevator](https://www.pinterest.com/pin/459015386994744337/), [Chair](https://www.reddit.com/r/funny/comments/12hka8/biggest_design_flaw_in_history_pisses_me_off/ ), [USB Disk](https://upload.wikimedia.org/wikipedia/commons/8/86/SanDisk_Cruzer_Micro.png), [Tree lined street](https://www.treehugger.com/environmental-policy/india-plant-2-billion-trees-along-its-highways.html)] --- # Impressions? .left-column50[  ] -- .right-column50[ 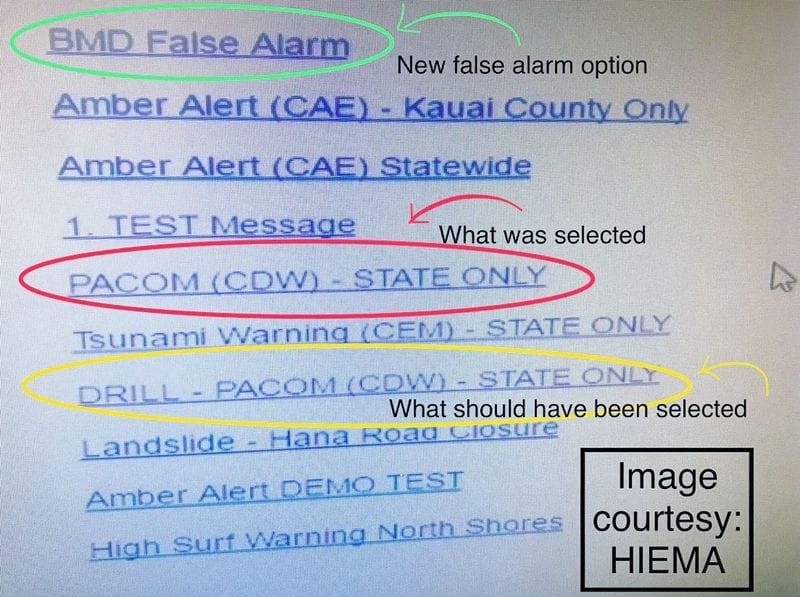 ] .footnote[.red[*] [Washington Post Article](https://www.washingtonpost.com/news/morning-mix/wp/2018/01/16/that-was-no-wrong-button-in-hawaii-take-a-look/?utm_term=.1848969db923) ] --- # Impressions? .left-column50[  ] .right-column50[  ] --- # Why user testing is important Bad user interfaces cost: - Money - 5%↑ satisfaction → up to 85%↑profits - Finding problems early makes them easier to fix - Reputation of organization (e.g., brand loyalty) - Lives ([6 Disasters Caused by Poorly Designed User Interfaces](https://www.cracked.com/article_19776_6-disasters-caused-by-poorly-designed-user-interfaces.html)) User Interfaces hard to get right: - People are unpredictable - Intuition of designers often wrong .footnote[[Zero Defections: Quality Comes to Services](https://hbr.org/1990/09/zero-defections-quality-comes-to-services) HBR September–October 1990.] --- # Code.org Problem Solving Process .left-column40[ <br> ] .right-column60[ - **Define** - What problem are you trying to solve? - What resources, priorities, and constraints do you need to consider? - What does success look like? - **Prepare** - Brainstorm / research possible solutions - Compare pros and cons - Make a plan - **Try** - Put your plan into action - **Reflect** - How do your results compare to the goals you set while defining the problem? - What can you learn from this or do better next time? - What new problems have you discovered? ] --- # You are not the user .left-column40[ <br> 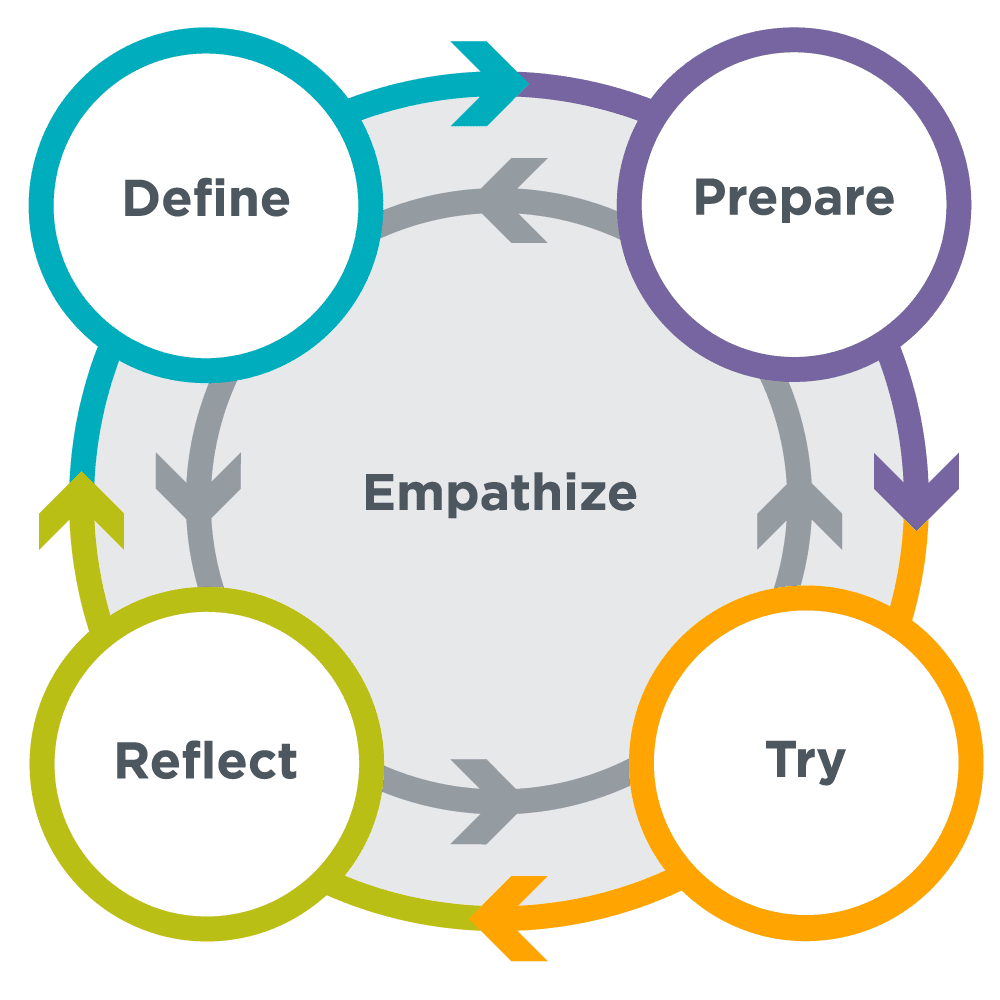 ] .right-column60[ User testing is typically done at all stages of a software development cycle - **Define**: Understanding the user, task, and constraints through Task Analysis, Contextual Inquiry, Ethnographic studies - **Prepare**: Develop use case scenarios and prototype with storyboards then test the prototypes (Participatory Design) - **Try**: Continuous involvement by end users as you develop) - **Reflect**: User Studies done on the current version of the product. ] ??? Find and fix problems in a design (from 440) - Removes the expert blind spot - Obtain data to unify team around changes - Uncover unexpected behaviors Saves money in the long run --- # Types of User Testing .left-column40[ Was this A/B Testing?  <br> <br>  ] .right-column60[ - Qualitative or quantitative usability testing - In-person - Remote (Conference-based, Semi-automatic, Controlled A/B testing) - Wizard-of-Oz testing - Diary Studies - Accessibility evaluation - Surveys - Usability-bug review - System Usability Scale testing - Frequently-asked-questions (FAQ) review ] .footnote[ Nielsen Norman Group [UX Research Cheat Sheet](https://www.nngroup.com/articles/ux-research-cheat-sheet/) ] ??? Not a scientific experiment but focus is on improving the design --- class: center, middle, inverse # Experimenting with Interfaces Important part of building interfaces is experimenting Need structured ways to decide what's better --- # Experiments should be tied to *hypotheses* based on *theories* what will go better - Fitts Law (compare distance and size; check for infinite size) - Steering Law (distance and size over a path) - Cognitive modeling (complex multi-step model of expert behavior) - Does someone have to 'check' something? More than once? - Do they have to move? More than once - Gestalt Psychology (will they see it at all?) - Errors (will they be reduced) ??? why theory and not intuition? --- # Which is better and why? .left-column50[ ## A. Pie Menu  ] .right-column50[ ## B. Pull down Menu  ] ??? What analysis methods can we use to predict? - Fitts Law (compare distance and size; check for infinite size) - *Steering Law* (distance and size over a path) - Cognitive modeling (complex multi-step model of expert behavior) - Does someone have to 'check' something? More than once? - Do they have to move? More than once - Gestalt Psychology (will they see it at all?) - Errors (will they be reduced) --- # Steering Law (based on Fitts' law) .left-column50[ ## A. Pie Menu  ] .right-column50[ ## B. Pull down Menu  ] --- # Which is better and why? .left-column50[ ## A. Pie Menu  ] .right-column50[ ## B. Marking Menu ![:youtube Video assigned before class, 8c58bN6ajJ4?t=30] ] ??? - Fitts Law (compare distance and size; check for infinite size) - Steering Law (distance and size over a path) - Cognitive modeling (complex multi-step model of expert behavior) - **Does someone have to 'check' something? More than once?** - **Do they have to move? More than once** - Gestalt Psychology (will they see it at all?) - Errors (will they be reduced) --- # Cognitive modeling (less double checking) .left-column50[ ## A. Pie Menu  ] .right-column50[ ## B. Marking Menu ![:youtube Video assigned before class, 8c58bN6ajJ4?t=30] ] --- # Which is better and why? A: Tapping B: Crossing ![:youtube Video of using crossing for selection, kp2Zl4ONuik] ??? - **Fitts Law (compare distance and size; check for infinite size)** - Steering Law (distance and size over a path) - Cognitive modeling (complex multi-step model of expert behavior) - Does someone have to 'check' something? More than once? - Do they have to move? More than once - Gestalt Psychology (will they see it at all?) - Errors (will they be reduced) --- # Fitts' Law (infinite width) .left-column60[ A: Tapping B: Crossing  ] .right-column40[ Examples of crossing - [Fruit Ninja](https://www.halfbrick.com/games/fruit-ninja) - Swipe keyboard interactions - Swiping to skip something, like a song in Spotify ] --- # Back to comparing menus Kurtenbach: What did they study here? ![:youtube Illustration of advantages of marking menus,dtH9GdFSQaw] --- # How do we prove our theories? Hypothesis <div class="mermaid"> graph LR S((.)) --> Hypothesis(Hypothesis) classDef finish outline-style:double,fill:#d1e0e0,stroke:#333,stroke-width:2px; classDef normal fill:#e6f3ff,stroke:#333,stroke-width:2px; classDef start fill:#d1e0e0,stroke:#333,stroke-width:4px; classDef invisible fill:#FFFFFF,stroke:#FFFFFF,color:#FFFFFF linkStyle 0 stroke-width:4px; class S invisible class Hypothesis start </div> Discuss -- Marking Menus are better than Pie Menus -- Marking Menus are *faster* than Pie Menus -- Pie Menus are faster than Linear Menus for less than 8 items that have no obvious order --- .left-column-half[ # What conditions does this experiment have? `MenuType` `TaskType` (could be a condition) ] .right-column-half[ # What might we measure? (from POP-Motor) ] -- .right-column-half[ - Time on Task - Accuracy - How strenuous - Recall - Emotional Response ] --- # How do we prove our theories? Method <div class="mermaid"> graph LR S((.)) --> Hypothesis(Hypothesis) Hypothesis -- "Study Design" --> Method(Method) classDef finish outline-style:double,fill:#d1e0e0,stroke:#333,stroke-width:2px; classDef normal fill:#e6f3ff,stroke:#333,stroke-width:2px; classDef start fill:#d1e0e0,stroke:#333,stroke-width:4px; classDef invisible fill:#FFFFFF,stroke:#FFFFFF,color:#FFFFFF linkStyle 0 stroke-width:4px; linkStyle 1 stroke-width:4px; class S invisible class Hypothesis start class Method normal </div> Compare specific conditions | MenuType | 8 items | 12 items | |----------|---------|----------| | Linear | | | | Pie | | | | Marking | | | What if we wanted to do length AND ordered vs not? Want to consider every combination, or run twice (menuType x length and menuType x ordering) --- # How do we prove our theories? Data <div class="mermaid"> graph LR S((.)) --> Hypothesis(Hypothesis) Hypothesis -- "Study Design" --> Method(Method) Method -- "Run Study" --> Data(Data) classDef finish outline-style:double,fill:#d1e0e0,stroke:#333,stroke-width:2px; classDef normal fill:#e6f3ff,stroke:#333,stroke-width:2px; classDef start fill:#d1e0e0,stroke:#333,stroke-width:4px; classDef invisible fill:#FFFFFF,stroke:#FFFFFF,color:#FFFFFF linkStyle 0 stroke-width:4px; linkStyle 1 stroke-width:4px; linkStyle 2 stroke-width:4px; class S invisible class Hypothesis start class Method,Data normal </div> What might we want to measure? -- count:false - Time on task -- how long to complete basic tasks? (For example, find something to buy, create a new account, and order the item.) -- count:false - Accuracy -- How many mistakes did people make? (And were they fatal or recoverable with the right information?) -- count:false - How strenuous (e.g. gaze has lower throughput but is less strenuous than head pointing (Mackenzie 2018) -- count:false - Recall -- How much does the person remember afterwards or after periods of non-use? -- count:false - Emotional Response -- How does the person feel about the tasks completed? (Confident? Stressed? Would the user recommend this system to a friend?) ??? Build up a list of good UI design Principles from these basics Undo Predictability ... What is missing? (e.g. fun) --- # How to get such data? - Video - Timestamps - Notes - Can transcribe and analyze interviews with users - Can look for patterns across users --- # How do we prove our theories? Analysis <div class="mermaid"> graph LR S((.)) --> Hypothesis(Hypothesis) Hypothesis -- "Study Design" --> Method(Method) Method -- "Run Study" --> Data(Data) Data -- "Clean and Prep" --> Analysis(Analysis) classDef finish outline-style:double,fill:#d1e0e0,stroke:#333,stroke-width:2px; classDef normal fill:#e6f3ff,stroke:#333,stroke-width:2px; classDef start fill:#d1e0e0,stroke:#333,stroke-width:4px; classDef invisible fill:#FFFFFF,stroke:#FFFFFF,color:#FFFFFF linkStyle 0 stroke-width:4px; linkStyle 1 stroke-width:4px; linkStyle 2 stroke-width:4px; linkStyle 3 stroke-width:4px; class S invisible class Hypothesis start class Method,Data,Analysis normal </div>  --- # How do we prove our theories? Conclusions <div class="mermaid"> graph LR S((.)) --> Hypothesis(Hypothesis) Hypothesis -- "Study Design" --> Method(Method) Method -- "Run Study" --> Data(Data) Data -- "Clean and Prep" --> Analysis(Analysis) Analysis --> Conclusions(Conclusions) classDef finish outline-style:double,fill:#d1e0e0,stroke:#333,stroke-width:2px; classDef normal fill:#e6f3ff,stroke:#333,stroke-width:2px; classDef start fill:#d1e0e0,stroke:#333,stroke-width:4px; classDef invisible fill:#FFFFFF,stroke:#FFFFFF,color:#FFFFFF linkStyle 0 stroke-width:4px; linkStyle 1 stroke-width:4px; linkStyle 2 stroke-width:4px; linkStyle 3 stroke-width:4px; linkStyle 4 stroke-width:4px; class S invisible class Hypothesis,Conclusions start class Method,Data,Analysis normal </div>  --- # Design an experiment <div class="mermaid"> graph LR S((.)) --> Hypothesis(Hypothesis) Hypothesis -- "Study Design" --> Method(Method) Method -- "Run Study" --> Data(Data) Data -- "Clean and Prep" --> Analysis(Analysis) Analysis --> Conclusions(Conclusions) classDef finish outline-style:double,fill:#d1e0e0,stroke:#333,stroke-width:2px; classDef normal fill:#e6f3ff,stroke:#333,stroke-width:2px; classDef start fill:#d1e0e0,stroke:#333,stroke-width:4px; classDef invisible fill:#FFFFFF,stroke:#FFFFFF,color:#FFFFFF linkStyle 0 stroke-width:4px; linkStyle 1 stroke-width:4px; linkStyle 2 stroke-width:4px; linkStyle 3 stroke-width:4px; linkStyle 4 stroke-width:4px; class S invisible class Hypothesis,Conclusions start class Method,Data,Analysis normal </div> .left-column50[ ## A.  ] .right-column50[ ## B.  ] ??? Hypothesis: Errors (will they be reduced) Method:?? Data:?? Analysis?? Conclusions?? --- # Design an experiment <div class="mermaid"> graph LR S((.)) --> Hypothesis(Hypothesis) Hypothesis -- "Study Design" --> Method(Method) Method -- "Run Study" --> Data(Data) Data -- "Clean and Prep" --> Analysis(Analysis) Analysis --> Conclusions(Conclusions) classDef finish outline-style:double,fill:#d1e0e0,stroke:#333,stroke-width:2px; classDef normal fill:#e6f3ff,stroke:#333,stroke-width:2px; classDef start fill:#d1e0e0,stroke:#333,stroke-width:4px; classDef invisible fill:#FFFFFF,stroke:#FFFFFF,color:#FFFFFF linkStyle 0 stroke-width:4px; linkStyle 1 stroke-width:4px; linkStyle 2 stroke-width:4px; linkStyle 3 stroke-width:4px; linkStyle 4 stroke-width:4px; class S invisible class Hypothesis,Conclusions start class Method,Data,Analysis normal </div> .left-column30[ ## A. Pull down Menu  ] .middle-column30[ ## B. Pie Menu  ] .right-column30[ ## C. Custom Menu ❓❓❓❓❓❓ - Discuss and design your own - Upload to [Ed](https://edstem.org/us/courses/32031/lessons/51112/edit/slides/286420) ] ??? Hypothesis: Errors will be reduced; Hypothesis: Motion will be faster due to low level motor things Hypothesis: fewer cognitive checks needed Method:?? Data:?? Analysis?? Conclusions?? --- name: inverse layout: true class: center, middle, inverse --- # The Menus Quantitative Study Description of how to test a hypothesis in a study, all steps --- layout: false # Menus Experiment Design <div class="mermaid"> graph LR S(.) --> Hypothesis(Hypothesis) Hypothesis -- "Study Design" --> Method(Method) Method -- "Run Study" --> Data(Data) Data -- "Clean and Prep" --> Analysis(Analysis) Analysis --> Conclusions(Conclusions) classDef finish outline-style:double,fill:#d1e0e0,stroke:#333,stroke-width:2px,font-size:.7em,height:2.5em; classDef normal fill:#e6f3ff,stroke:#333,stroke-width:2px,font-size:.7em,height:2.5em; classDef start fill:#d1e0e0,stroke:#333,stroke-width:4px,font-size:.7em,height:2.5em; classDef invisible fill:#FFFFFF,stroke:#FFFFFF,color:#FFFFFF linkStyle 0 stroke-width:3px; linkStyle 1 stroke-width:3px; linkStyle 2 stroke-width:3px; linkStyle 3 stroke-width:3px; linkStyle 4 stroke-width:3px; class S invisible class Hypothesis,Conclusions start class Method,Data,Analysis normal </div> Think: What is the Hypothesis for the Menus assignment... -- count: false Pair: Chat with your neighbor ... -- count: false Share: Your ideas with the whole group... --- # Method <div class="mermaid"> graph LR S(.) --> Hypothesis(Hypothesis <br>Decreased seek <br>time and errors) Hypothesis -- "Study Design" --> Method(Method) Method -- "Run Study" --> Data(Data) Data -- "Clean and Prep" --> Analysis(Analysis) Analysis --> Conclusions(Conclusions) classDef finish outline-style:double,fill:#d1e0e0,stroke:#333,stroke-width:2px,font-size:.7em,height:2.5em; classDef normal fill:#e6f3ff,stroke:#333,stroke-width:2px,font-size:.7em,height:2.5em; classDef start fill:#d1e0e0,stroke:#333,stroke-width:4px,font-size:.7em,height:5em; classDef startsmall fill:#d1e0e0,stroke:#333,stroke-width:4px,font-size:.7em,height:2.5em; classDef invisible fill:#FFFFFF,stroke:#FFFFFF,color:#FFFFFF linkStyle 0 stroke-width:3px; linkStyle 1 stroke-width:3px; linkStyle 2 stroke-width:3px; linkStyle 3 stroke-width:3px; linkStyle 4 stroke-width:3px; class S invisible class Hypothesis start class Conclusions startsmall class Method,Data,Analysis normal </div> - 3 tasks x 3 menu types = 9 *conditions* - Each condition will have a total of totalTrials = `ITEM_MAX` x `NUM_REPEATS` - In each *condition* we test `ITEM_MAX` different menu items - For each menu item, we repeat `NUM_REPEATS` times | | Normal | Pie | Custom | |--|--|--|--| | **Linear** | totalTrials | totalTrials | totalTrials | | **Relational** | totalTrials | totalTrials | totalTrials | | **Unclassified** | totalTrials | totalTrials | totalTrials | --- # Other Method considerations For Menus Part 5-6, an experimental *session* consists of 3 tasks x 3 menu types x `ITEM_MAX` items x `NUM_REPEATS` repetitions = 108 *trials* You have to run at least three participants through a complete session = 108 x 3 or 324 data points. -- - In some experimental designs, participants only do some conditions - Called *between subjects design* - Our participants do *all* trials - Our study is a *within subjects design* Order of presentation of conditions and items is randomized (why?) ??? Between subjects design: Person A compared to person B doing different tasks --- # Document all of this in your [report](/courses/cse340/23wi/assignments/menu-report.html) **Introduce study purpose** *Write two sentences describing the purpose of the experiment. This can be the same text you use in your [consent form](/courses/cse340/23wi/assignments/consent.html) under `Introduction and Purpose of study (Beneficience)`* --- # Document all of this in your [report](/courses/cse340/23wi/assignments/menu-report.html) **Introduce study method** **Menus** *Mention that there are three types of menus: Pie, Linear and Custom. Then include the following:* - *The design your custom menu by including your sketches and a clear explanation of how you expect a user to interact with your custom menu. Also include the description and calculations for your essential geometry.* - *Describe some of the design choices you made when you were conceiving your custom menu, and how you expected it would perform against Normal and Pie menus* - *Include the screenshots of your custom menu in both a selected and unselected state.* - *Discuss how your final product matches/doesn't match your original vision. * --- # Document all of this in your [report](/courses/cse340/23wi/assignments/menu-report.html) **Introduce study method** **Tasks** *Describe the 9 conditions of the study. Explain how many items were selected per menu, and how many times each item was repeated. Describe how many trials each participant completed.* **Setting** *What device was used? Was it an emulator? Did they use a mouse or a finger? Where did the experiment take place?* --- name: study-ethics # Study Ethics <div class="mermaid"> graph LR S(.) --> Hypothesis(Hypothesis:<br>Decreased seek <br>time and errors) Hypothesis -- "Study Design" --> Method(3 menus x <br> 3 task conditions ) Method -- "Run Study" --> Data(Data) Data -- "Clean and Prep" --> Analysis(Analysis) Analysis --> Conclusions(Conclusions) classDef finish outline-style:double,fill:#d1e0e0,stroke:#333,stroke-width:2px,font-size:.7em,height:2.5em; classDef normal fill:#e6f3ff,stroke:#333,stroke-width:2px,font-size:.7em,height:2.5em; classDef normalbig fill:#e6f3ff,stroke:#333,stroke-width:2px,font-size:.7em,height:4em; classDef start fill:#d1e0e0,stroke:#333,stroke-width:4px,font-size:.7em,height:5em; classDef startsmall fill:#d1e0e0,stroke:#333,stroke-width:4px,font-size:.7em,height:2.5em; classDef invisible fill:#FFFFFF,stroke:#FFFFFF,color:#FFFFFF linkStyle 0 stroke-width:3px; linkStyle 1 stroke-width:3px; linkStyle 2 stroke-width:3px; linkStyle 3 stroke-width:3px; linkStyle 4 stroke-width:3px; class S invisible class Hypothesis start class Conclusions startsmall class Method normalbig class Data,Analysis normal </div> --- template: study-ethics Ethical Principles for running participants. - Why are they needed? What examples have you heard about? --- template: study-ethics Ethical Principles for running participants. * [Criminal/Racist/Harmful studies](https://www.nytimes.com/2017/05/22/science/social-science-research-institutional-review-boards-common-rule.html) * 1932-1972: Tuskegee Syphilis study * 1939-1945: Nazi war crimes * 1951: [HeLa](https://en.wikipedia.org/wiki/HeLa) from [Henrietta Lacks](https://en.wikipedia.org/wiki/Henrietta_Lacks) * 1961-1962: [Milgram's study of electric shocking](https://www.simplypsychology.org/milgram.html) * 1945-mid 70s: [16,000 people involuntarily included in radiation studies](https://www.nytimes.com/1995/08/20/us/count-of-subjects-in-radiation-experiments-is-raised-to-16000.html?module=inline) * 1973: [Stanford prison experiment](https://www.simplypsychology.org/zimbardo.html) * 1989: [Havasupai Tribe Blood Samples](https://journalofethics.ama-assn.org/article/genetic-research-among-havasupai-cautionary-tale/2011-02) * 1999: [Jesse Gelsinger Dies](https://en.wikipedia.org/wiki/Jesse_Gelsinger) --- template: study-ethics Ethical Principles for running participants. - Federal Policy for the Protection of Human Subjects - National Commission for the Protection of Human Subjects of Biomedical and Behavioral Research (1974-1978) - Belmont report (issued 1978, adopted 1979) - Common Rule, 1981 rule of ethics, published in 1991, revised in 2018 IRB = Institutional Review Board Protocol (and get it approved.) --- template: study-ethics Basic ethics ([Belmont Report](https://www.hhs.gov/ohrp/regulations-and-policy/belmont-report/read-the-belmont-report/index.html), 1979) - Documented informed consent process - Additional protections for vulnerable populations - **Are subjects willing volunteers?** --- template: study-ethics Basic ethics ([Belmont Report](https://www.hhs.gov/ohrp/regulations-and-policy/belmont-report/read-the-belmont-report/index.html), 1979) - Beneficence --> - Value of research higher than risks - Do no harm - Respect for Persons --> - Informed consent: participants are fully informed of intent and purpose - May opt out at any time, for any reason - Justice --> - Equitable, representative selection of participants --- # Consent Write your [consent](/courses/cse340/23wi/assignments/consent.html) form - Purpose of study (Beneficience) - Requirements for participation (Respect for Persons) - Study procedures (Respect for Persons) - Voluntariness (Respect for Persons) - Benefits to Society (Beneficience) - Contact (of IRB typically; Me in this case) ??? - Beneficence --> - Value of research higher than risks - Do no harm - Respect for Persons --> - Fully informed of intent and purpose - Informed consent - May opt out at any time, for any reason - Justice - equitable, representative selection of participants --- # Choosing and Consenting Participants - Choose your partipants from friends, family members, etc - Can choose to have a wide range of participants (age, comfortability with technology), or participants with simliar characteristics - Max 1 participant can be a class member (post on Ed if that's a problem) - Consenting your participants - Set up a time when can speak to your participant (in real time) - Print out two copies of the consent form for each participant -- one for them and one for you. .footnote[printers are in the CSE labs] --- # Choosing and Consenting Participants During the consent meeting - Briefly explain what your user study is about. - Ensure participants understand their participation in the study is voluntary. - Do not *coerce* anyone into participating in your study. - Make sure they know they have a choice, and have read the consent form. - Participants must acknowledge their consent by filling out the bottom of one of the copies of their form, then “signing” the bottom by writing the words “I consent” and and drawing a picture of a sun next to those words. - Turn in your filled out consent forms on Gradescope. --- # Choosing and Consenting Participants If you are unable to find 3 partipants from your friends or family - Please reach out to a TA during Office Hours or to have them be a participant. - You may also reach out to other students in the class via Ed. --- # Document your participants in your [report](/courses/cse340/23wi/assignments/menu-report.html) **Introduce study method** **Participants:** *Describe your participants (without identifying them). How were they recruited? How many were there? Were they consented? You should also add some optional information such as: What was there average age? What genders were present? How experienced were they with android?* --- # Data Collection <div class="mermaid"> graph LR S(.) --> Hypothesis(Hypothesis:<br>Decreased seek <br>time and errors) Hypothesis -- "Study Design" --> Method(3 menus x <br> 3 task conditions ) Method -- "Run Study" --> Data(Data) Data -- "Clean and Prep" --> Analysis(Analysis) Analysis --> Conclusions(Conclusions) classDef finish outline-style:double,fill:#d1e0e0,stroke:#333,stroke-width:2px,font-size:.7em,height:2.5em; classDef normal fill:#e6f3ff,stroke:#333,stroke-width:2px,font-size:.7em,height:2.5em; classDef normalbig fill:#e6f3ff,stroke:#333,stroke-width:2px,font-size:.7em,height:4em; classDef start fill:#d1e0e0,stroke:#333,stroke-width:4px,font-size:.7em,height:5em; classDef startsmall fill:#d1e0e0,stroke:#333,stroke-width:4px,font-size:.7em,height:2.5em; classDef invisible fill:#FFFFFF,stroke:#FFFFFF,color:#FFFFFF linkStyle 0 stroke-width:3px; linkStyle 1 stroke-width:3px; linkStyle 2 stroke-width:3px; linkStyle 3 stroke-width:3px; linkStyle 4 stroke-width:3px; class S invisible class Hypothesis start class Conclusions startsmall class Method normalbig class Data,Analysis normal </div> 1. **Clear your data** file before you start the **first participant only** 2. Have participant read and sign the consent form 3. Emphasize key points verbally 4. Be consistent in how you present the study to all your users (it's helpful to write yourself a script) 5. Let them run through the session (all 108 trials) 5. Download result (use the `Device File Manager`) --- exclude: true # Data Collection <div class="mermaid"> graph LR S(.) --> Hypothesis(Hypothesis:<br>Decreased seek <br>time and errors) Hypothesis -- "Study Design" --> Method(3 menus x <br> 3 task conditions ) Method -- "Run Study" --> Data(Data) Data -- "Clean and Prep" --> Analysis(Analysis) Analysis --> Conclusions(Conclusions) classDef finish outline-style:double,fill:#d1e0e0,stroke:#333,stroke-width:2px,font-size:.7em,height:2.5em; classDef normal fill:#e6f3ff,stroke:#333,stroke-width:2px,font-size:.7em,height:2.5em; classDef normalbig fill:#e6f3ff,stroke:#333,stroke-width:2px,font-size:.7em,height:4em; classDef start fill:#d1e0e0,stroke:#333,stroke-width:4px,font-size:.7em,height:5em; classDef startsmall fill:#d1e0e0,stroke:#333,stroke-width:4px,font-size:.7em,height:2.5em; classDef invisible fill:#FFFFFF,stroke:#FFFFFF,color:#FFFFFF linkStyle 0 stroke-width:3px; linkStyle 1 stroke-width:3px; linkStyle 2 stroke-width:3px; linkStyle 3 stroke-width:3px; linkStyle 4 stroke-width:3px; class S invisible class Hypothesis start class Conclusions startsmall class Method normalbig class Data,Analysis normal </div> If you have a remote user 1. Generate your APK 2. Consent your user via phone or video conference. 3. Send your APK to the participant so they can load it onto their own device or into their own emulator - You can't email your APK through UW's servers, so upload the APK to your Google Drive or One Drive and send your participant a link to download it for testing. 4. Have your participant use the hamburger menu to select `Clear Result CSV` before starting your study 5. Have your participant run one experiment session. 6. When the study is done, your participant will need to download their data and send it back for analysis. 7. Combine the three participants' data into one common .csv file. --- layout: true class: center, middle --- # Collecting data file (Demo) --- layout: false # Document what all of this in your [report](/courses/cse340/23wi/assignments/menu-report.html) **Introduce study method** **Data Collected** *What information was collected (time, errors, etc)* --- # Data Collection .left-column[  ] .right-column[ Select the 'raw' sheet of your spreadsheet then load your file into the spreadsheet  ] --- # Data Collection .left-column[  ] .right-column[ Now click on `Example Chart`. Here you can - Analyze and chart data: Simple Statistics - Min, Max, Mean (Sum/#), Median (Middle #), Mode (Most Common #) Demo Do this for speed *and* error. ] --- # Document what all of this in your [report](/courses/cse340/23wi/assignments/menu-report.html) **Speed Results** *Describe your thoughts about overall speed in different conditions. Use at least one chart to illustrate what you say. Describe the axes and explain why this graph was chosen. Here is an example chart generated using our data, when you paste your data into the spreadsheet you'll see that it updates to reflect your data. * **Error Results** *Describe what happened in terms of errors -- provide at least one chart showing what you learned about errors in different conditions. Describe the axes and explain why this graph was chosen. * --- # Other Ideas - How can you measure things *other* than what Fitts Law predicts: - How strenuous this was to the user - How easily they could recall what they did - How did they feel about the tasks they completed