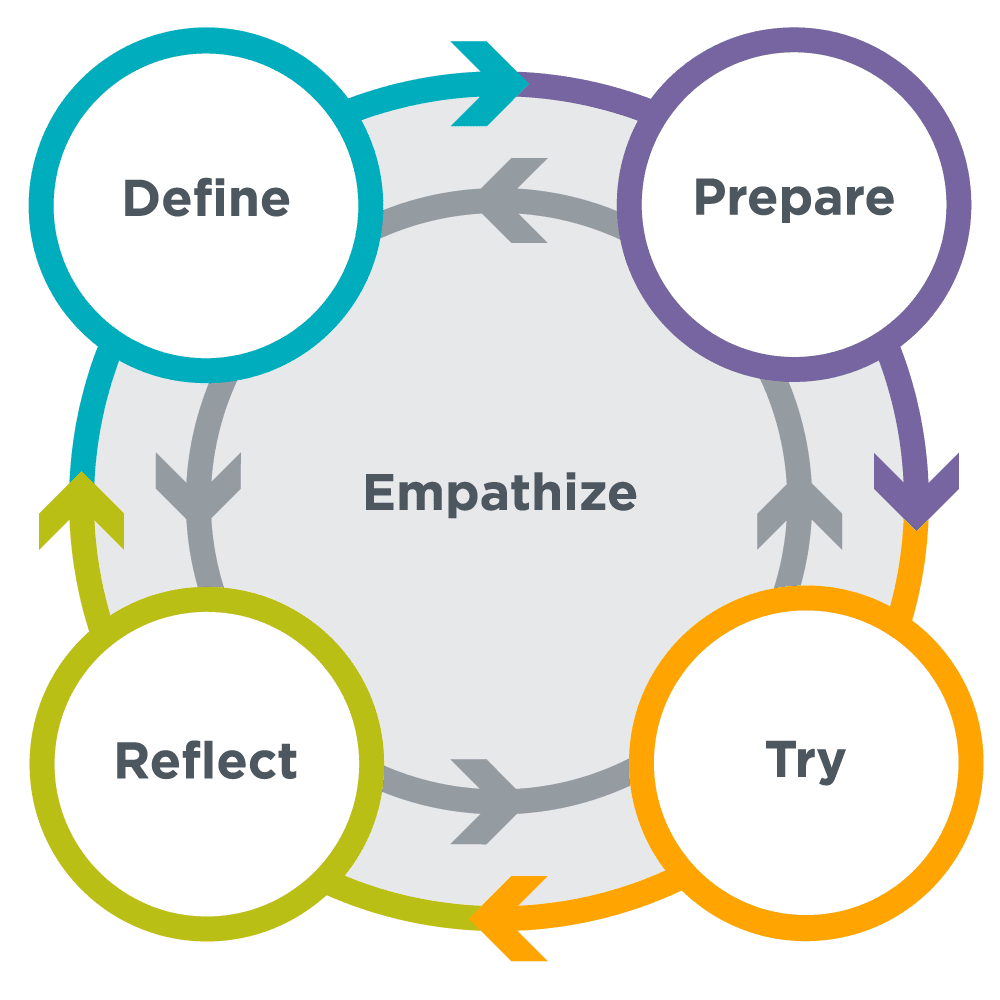
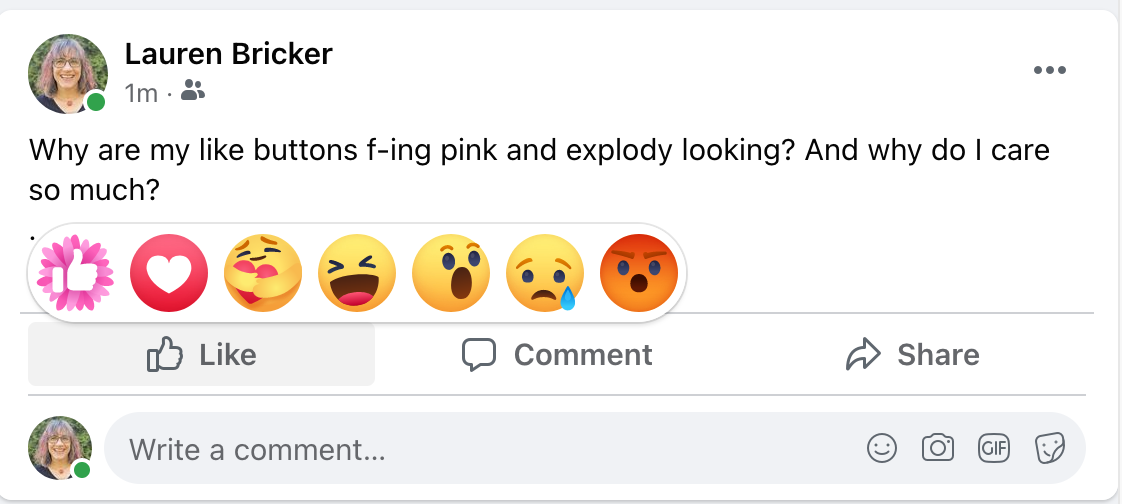
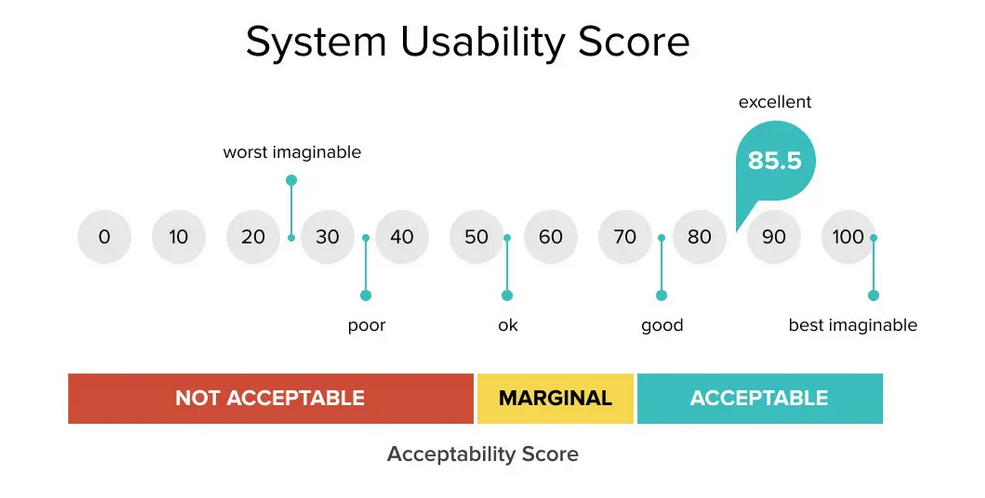
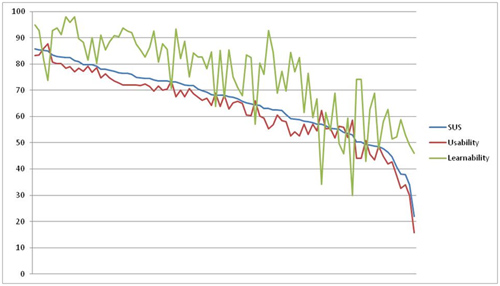
name: inverse layout: true class: center, middle, inverse --- # System Usability Scale Testing Lauren Bricker CSE 340 Spring 2022 --- layout: false # Agenda Administrivia - [Course eval](https://uw.iasystem.org/survey/258542) go out Sunday - $3 of my own money for every percent of students who fill out the eval donated to [Real Rent Duwamish](https://www.realrentduwamish.org/) - Final project deadlines (all @10pm): - Design: Fri 27-May, Code: Sat 4-Jun, <br> SUS testing: Sun 5-Jun, Video/Report: Wed 8-Jun - NO resubmissions on code/testing/video/report. Agenda - Recall different forms of user testing - Discuss System Usability Scale testing - Use SUS to evaluate our website. - AMA/Work time --- # Recall from our Menus Experiment... --- # Code.org Problem Solving Process .left-column40[ <br> ] .right-column60[ - **Define** - What problem are you trying to solve? - What resources, priorities, and constraints do you need to consider? - What does success look like? - **Prepare** - Brainstorm / research possible solutions - Compare pros and cons - Make a plan - **Try** - Put your plan into action - **Reflect** - How do your results compare to the goals you set while defining the problem? - What can you learn from this or do better next time? - What new problems have you discovered? ] --- # You are not the user .left-column40[ <br>  ] .right-column60[ User testing is typically done at all stages of a software development cycle - **Define**: Understanding the user, task, and constraints through Task Analysis, Contextual Inquiry, Ethnographic studies - **Prepare**: Develop use case scenarios and prototype with storyboards then test the prototypes (Participatory/Co-design) - **Try**: Continuous involvement by end users as you develop) - **Reflect**: User studies done on the current version of the product. ] ??? Find and fix problems in a design (from 440) - Removes the expert blind spot - Obtain data to unify team around changes - Uncover unexpected behaviors Saves money in the long run --- # Types of User Testing .left-column40[ Was this A/B Testing?  <br> <br>  ] .right-column60[ - Qualitative or quantitative usability testing - In-person - Remote (Conference-based, Semi-automatic, Controlled A/B testing) - Wizard-of-Oz testing - Diary Studies - Accessibility evaluation - Surveys - Usability-bug review - System Usability Scale testing - Frequently-asked-questions (FAQ) review ] .footnote[ Nielsen Norman Group [UX Research Cheat Sheet](https://www.nngroup.com/articles/ux-research-cheat-sheet/) ] ??? Not a scientific experiment but focus is on improving the design --- count: false # Types of User Testing .left-column40[ Was this A/B Testing?  <br> <br>  ] .right-column60[ - **Qualitative** or quantitative usability testing - **In-person** _(Menus)_ - Remote (Conference-based, Semi-automatic, Controlled A/B testing) - Wizard-of-Oz testing - Diary Studies - **Accessibility evaluation** _(Accessibility)_ - Surveys - Usability-bug review - System Usability Scale testing - Frequently-asked-questions (FAQ) review ] .footnote[ Nielsen Norman Group [UX Research Cheat Sheet](https://www.nngroup.com/articles/ux-research-cheat-sheet/) ] ??? Not a scientific experiment but focus is on improving the design --- count: false # Types of User Testing .left-column40[ Was this A/B Testing?  <br> <br>  ] .right-column60[ - **Qualitative** or quantitative usability testing - **In-person** - Remote (Conference-based, Semi-automatic, Controlled A/B testing) - Wizard-of-Oz testing - Diary Studies - **Accessibility evaluation** - Surveys - Usability-bug review - **System Usability Scale testing** _(Now!)_ - Frequently-asked-questions (FAQ) review ] .footnote[ Nielsen Norman Group [UX Research Cheat Sheet](https://www.nngroup.com/articles/ux-research-cheat-sheet/) ] ??? Not a scientific experiment but focus is on improving the design --- # Definition: Usability .quote[The definition of "usability" is the quality of the user experience when using a product or a system, including websites, software, hardware, applications, or mobile devices. The goal of usability is to effectively and efficiently satisfy the end user.] .footnote[[What's the System Usability Scale (SUS) & How Can You Use It?](https://blog.hubspot.com/service/system-usability-scale-sus)] --- # Factors that create a usable system A combination of factors can make a system usable or not * **Efficiency**: How fast someone can use it * **Intuitiveness**: How effortlessly someone can understand it * **Ease**: How easy it is to use * **Satisfaction**: How much a user subjectively likes or dislikes using it .footnote[[What's the System Usability Scale (SUS) & How Can You Use It?](https://blog.hubspot.com/service/system-usability-scale-sus)] --- # Usability Matters Bad user interfaces cost * Money * 5% increase in satisfaction can mean up to 85% increase in profits * Finding problems early makes them easier to fix * Reputation of organization (e.g., brand loyalty) * Lives .footnote["Zero Defections: Quality Comes to Services," [HBR September–October 1990](https://hbr.org/1990/09/zero-defections-quality-comes-to-services)] --- # System Usability Scale (SUS) * Created by John Brooke in 1986 * Initially used to measure usability of office systems. * It has become an industry standard * Benefits include: * easy to administer * can be used on a wide variety of systems (hardware, software, mobile, web) * can be used with a small sample size and get reliable results * it can effectively differentiate between usable and unusable systems .font-small[ References Brooke, J B (2013). SUS – a retrospective. Journal of Usability Studies, Vol. 8, Issue 2, February 2013 pp. 29-40.<br> Brooke, J. (1986). “SUS: a “quick and dirty” usability scale”. In P. W. Jordan, B. Thomas, B. A. Weerdmeester, & A. L. McClelland (eds.). Usability Evaluation in Industry. London: Taylor and Francis. ] --- # System Usability Scale Questions 1. I think that I would like to use this [project] frequently. 2. I found the [project] unnecessarily complex. 3. I thought the [project] was easy to use. 4. I think that I would need the support of a technical person to be able to use this [project]. 5. I found the various functions in this [project] were well integrated. 6. I thought there was too much inconsistency in this [project]. 7. I imagine that most people would learn to use this [project] very quickly. 8. I found the [project] very cumbersome to use. 9. I felt very confident using the [project]. 10. I needed to learn a lot of things before I could get going with this [project]. --- # System Usability Score Scoring Each question is rated 5-point Likert Scale from strongly disagree to strongly agree Scoring for each question is done based using the following scale: * **Strongly Disagree**: 1 point * **Disagree**: 2 points * **Neutral**: 3 points * **Agree**: 4 points * **Strongly Agree**: 5 points --- # Calculating a System Usability Score 1. Total the odd-numbered questions, then subtract 5 to get X. 2. Subtract the total the even-numbered questions from 25 to get Y. 3. Add these values (X+Y) and multiply by 2.5. Example scoring: |Q1|Q2|Q3|Q4|Q5|Q6|Q7|Q8|Q9|Q10| |-|-|-|-|-|-|-|-|-| | 4| 2| 5| 1| 3| 3| 4| 1| 3| 1| ``` Odd = (4+5+3+4+3) = 19 X = 19 – 5 = 14 Even = (2+1+3+1+1) = 8 Y = 25 – 8 = 17 SUS Score: (14+17) x 2.5 = 77.5 ``` --- # Evaluate the score .left-column40[ * Scores are not a percentage score but a total score out of 100. * The average SUS score is 68 * Scoring above or below the average will give you quick insight into the overall usability of the system being tested. ] .right-column60[ ] .footnote[[Image credit: 10up.com](https://10up.com/uploads/2018/11/sus-score-1-768x427.jpg)] --- ## Learnability and Usability Subscores .left-column40[ * Questions 4 and 10 are a measure of "learnability" of the app * The other 8 questions are a measure of "usability" of the app * There's a relationship between usability, learnability, and the overall SUS score ] .right-column60[ ] .footnote[[ 10 Things to Know About the System Usability Scale (SUS)](https://measuringu.com/10-things-sus/)] --- ## Calculating a Learnability Subscore Learnability: 1. Subtract the total of the scores from questions 4 and 10 from 10 to get X. 2. Multiply that number by 12.5 Example scoring: |Q1|Q2|Q3|Q4|Q5|Q6|Q7|Q8|Q9|Q10| |-|-|-|-|-|-|-|-|-| | 4| 2| 5| 1| 3| 3| 4| 1| 3| 1| ``` Q4 + Q10 = (1+1) = 2 10 - 2 - 8 Learnability Score: 8 x 12.5 = 100 ``` --- ## Calculating a Usability Subscore 1. Total the odd-numbered questions, then subtract 5 to get X. 2. Subtract the total the even-numbered questions from 15 to get Y. 3. Add these values (X+Y) and multiply by 3.125. Example scoring: |Q1|Q2|Q3|Q4|Q5|Q6|Q7|Q8|Q9|Q10| |-|-|-|-|-|-|-|-|-| | 4| 2| 5| 1| 3| 3| 4| 1| 3| 1| ``` Odd = (4+5+3+4+3) = 19 X = 19 – 5 = 14 Even = (2+3+1) = 6 Y = 15 – 6 = 9 Usability Score: (14+9) x 3.125 = 71.875 ``` --- # SUS Testing: Our website 1. Complete the tasks on the next page 2. Use our [SUS testing form](https://forms.gle/daz25Bq6qNDJxDmY7) to evaluate the system. - Select "bricker" for the author 3. Calculate your SUS score to share out in class (This [site](https://uiuxtrend.com/sus-calculator/) can help with the calculation) --- # SUS Testing: Our website **Tasks to accomplish** 1. Find the readings for Wednesday 6/1 2. Find the documentation on "How to Write a Reflection" 3. Make your browser skinny (if you're on web) so you see the "hamburger menu" instead of the list of menu items at the top of the screen. Navigate to the Assignments page. using the Hamburger Menu. 4. Find the Final Project report template. 5. Return to the Final Project specifications page. 6. Use the hamburger menu to go to the COVID-19 Safety page. --- # SUS Testing: Our website Results to be shared in our next class :) --- # SUS Testing: Thoughts * What was your experience as a participant? * Do you think this would feel different if this was an absolutely new site or app? * What did this effectively capture? * What **didn't** this effectively capture? --- # SUS Testing: Counterpoint ![:youtube How Useful Is the System Usability Scale (SUS) in UX Projects with Jakob Nielsen ,6b2YFgRCVDE]