Report on Menus Assignment
Comments about what should be in your report can be found in italics. Please remove the comments and replace them with your own words.
Introduction
Write two sentences describing the purpose of the experiment. This
can be the same text you use in your consent form under
Introduction and Purpose of study (Beneficience)
Method
Menus: Mention that there are three types of menus, Pie, Linear and Custom. Then describe your custom menu and include an screenshots of your custom menu in both a selected and unselected state. Describe some of the design choices you made when you were conceiving your custom menu and how your final product match (or didn’t) your original vision? Be sure to explain clearly how your custom menu works and how a user interacts with it?
Tasks: Describe the 9 conditions of the study. Explain how many items were selected per menu, and how many times each item was repeated. Describe how many trials each participant completed. This should be at most one paragraph
Setting: What device was used? Was it an emulator? Did they use a mouse or a finger? Where did the experiment take place?
Participants: Describe your participants (without identifying them). How were they recruited? How many were there? Were they consented? You should also add some optional information such as: What was there average age? What genders were present? How experienced were they with android?
Data Collected: What information was collected (time, errors, etc)
Results
To analyze your data, you should copy the following spreadsheet
and paste your data into the Raw Data subsheet, replacing the
contents/data that we placed there. To use this spreadsheet look at
the Example Chart sheet to see a chart of your data (you can click on
the hamburger menu in the chart to download it as an image). You can
also create your own charts if you are
comfortable working in a spreadsheet.
The results will be broken into two parts. The first will describe the overall data, including how many erroneous selections took place, and how fast the user was in each condition.
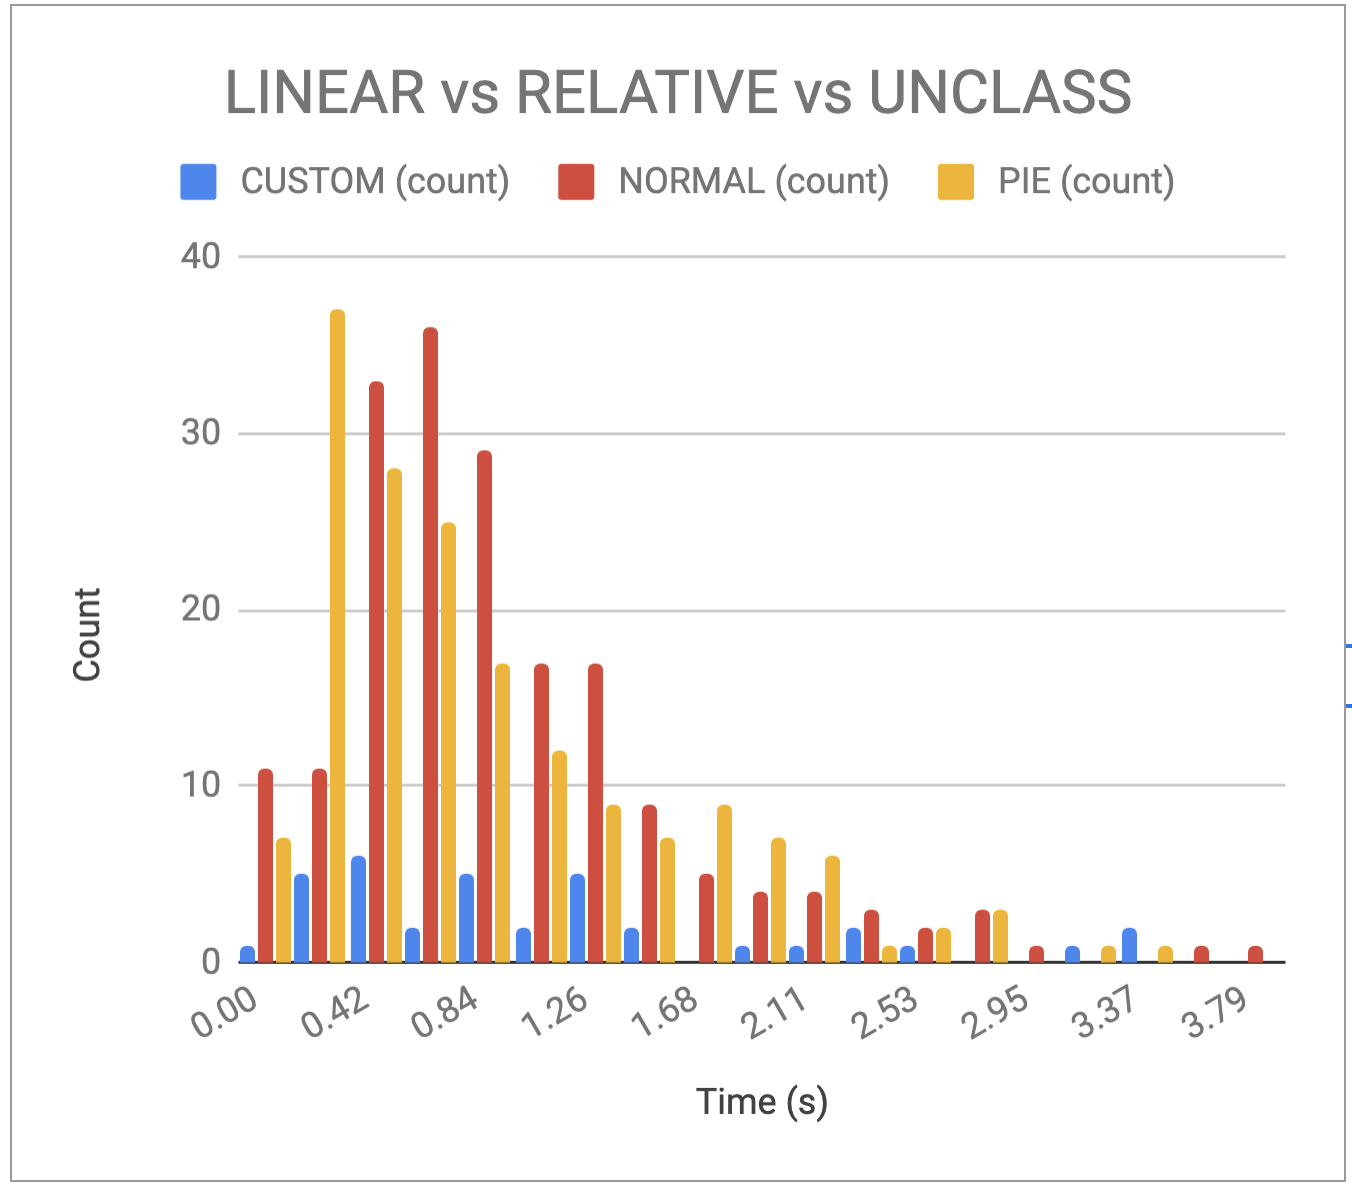
Speed Results
Describe your thoughts about overall speed in different conditions. Use at least one chart to illustrate what you say. Here is an example chart generated using our data, when you paste your data into the spreadsheet you’ll see that it updates to reflect your data
Error Results
Describe what happened in terms of errors – provide at least one chart showing what you learned about errors in different conditions
Conclusions
Describe your conclusions. Do you think we should use pie menus more? normal menus more? or your custom menu? What can we conclude from your data?