Web Programming Step by Step
JavaScript Debugging
Reading: 7.2
Except where otherwise noted, the contents of this presentation are Copyright 2009 Marty Stepp and Jessica Miller.


Debugging JS code in Firebug
- Firebug JS debugger can set breakpoints, step through code, examine values (Script tab)
- interaction pane for typing in arbitrary JS expressions (Console tab; Watch tab within Script tab)
JSLint
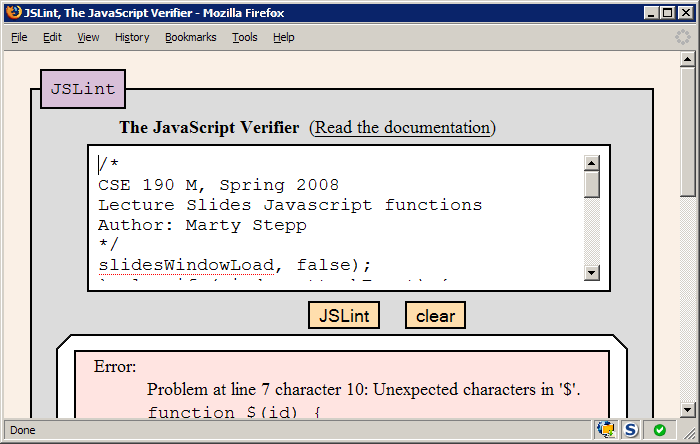
- JSLint: an analyzer that checks your JS code, much like a compiler, and points out common errors
- Marty's version
- original version, by Douglas Crockford of Yahoo!
- when your JS code doesn't work, paste it into JSLint first to find many common problems
Debugging checklist
-
Are you sure the browser is even loading your JS file at all?
Put analertat the top of it and make sure it appears. - When you change your code, do a full browser refresh (Shift-Ctrl-R)
-
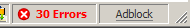
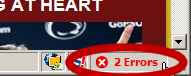 Check bottom-right corner of Firefox for Firebug syntax errors.
- Paste your code into our JSLint tool to find problems.
- Type some test code into Firebug's console or use a breakpoint.
Is my JS file loading?
- put an
alertat the VERY TOP of your script:
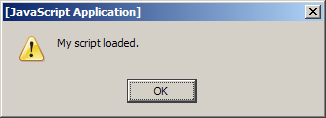
- if it shows up, good!
- if it doesn't show up:
- maybe your HTML file isn't linking to the script properly
- double-check file names and directories
- maybe your script has a syntax error
- check bottom-right for Firebug error text
- comment out the rest of your script and try it again
- run your script through JSLint to find some syntax problems
- check bottom-right for Firebug error text
- maybe your HTML file isn't linking to the script properly
Is it reaching the code I want it to run?
- put an
alertat the start of the appropriate function:
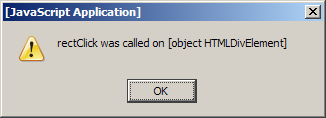
- write a descriptive message, not just
"hello"or"here"
- write a descriptive message, not just
- if it shows up, good!
- if it doesn't show up:
- if it's an event handler, maybe you didn't attach it properly
- maybe your script has a syntax error; run JSLint
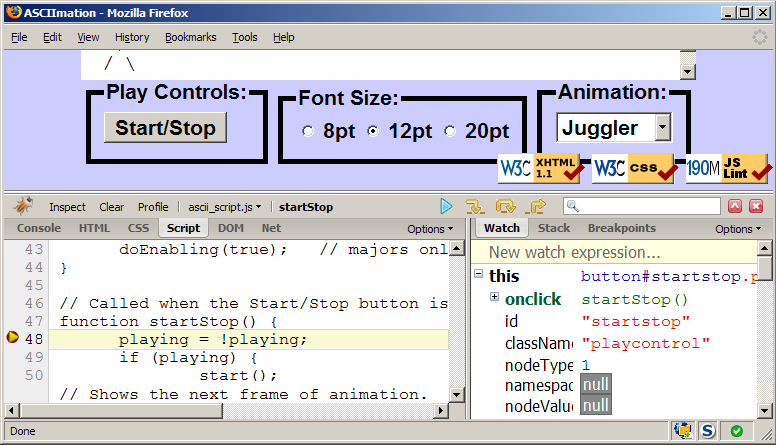
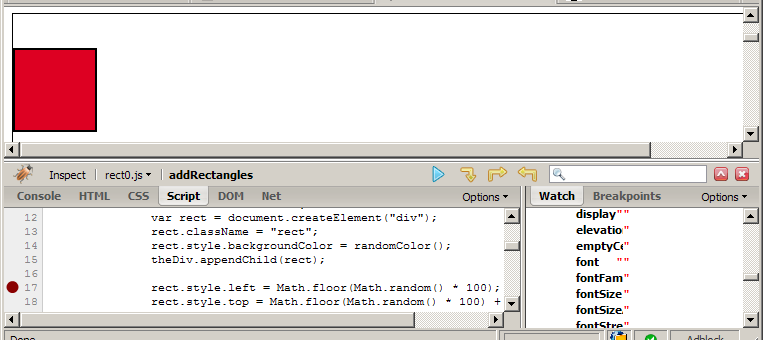
Firebug's debugger
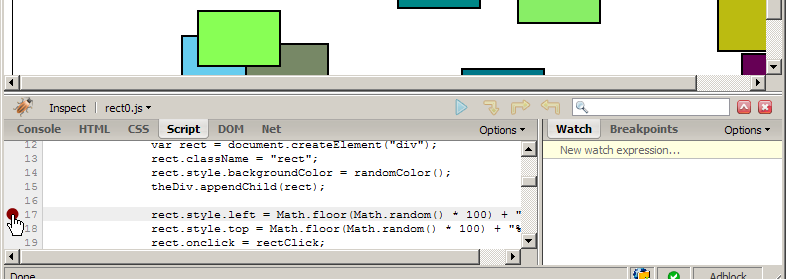
- open Firebug, click Script tab
- click to the left of a line to set a breakpoint
- refresh page; when script gets to that line, program will halt
Breakpoints
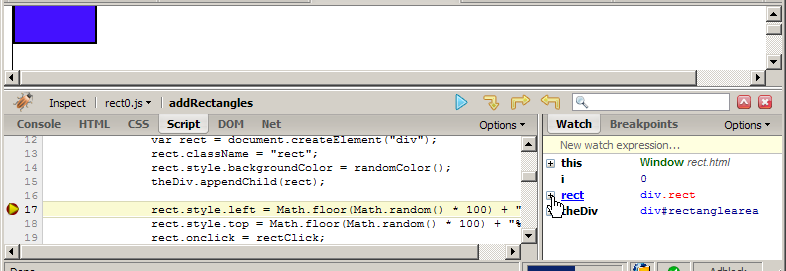
- once stopped at a breakpoint, you can examine variables in the Watch tab at right
- can click + to see properties/methods inside any object
- this variable holds data about current object, or global data
- if the object is global or not listed, type its name in the "New watch expression..." box
Stepping through code
- once stopped at a breakpoint, you can continue execution:
 continue (F8): start program running again
 step over (F10): run current line of code completely, then stop again
 step into (F11): run current line of code; if it contains a call to another function, go into it
 step out (Shift-F11): run the current function to completion and return, then stop
Debugging CSS property code
- expand DOM object with +, and expand its
styleproperty to see all styles - also look at HTML (left) tab, Style (right) tab to see styles