The content for this lesson is adapted from material by Hunter Schafer and by Kevin Lin.
Objectives
pandas is a very popular library used by data scientists to process tabular data: data organized into rows and columns like a spreadsheet. In this lesson, we’ll discuss two key DataFrame operations: the groupby operation and the apply operation. We’ll also discuss how groupby introduces an extra level of complexity towards indexing and slicing values. By the end of this lesson, students will be able to:
- Explain in plain English the outcome of a
pandasDataFramegroupbyoperation. - Apply the
groupbyoperation to apandasDataFrame. - Apply the
applyoperation to apandasDataFrame. - Select values from a hierarchical index using tuples and the
sliceobject as keys.
Setting up
To follow along with the code examples in this lesson, please download the files here:
Because of the interactive nature of this lesson’s contents, you are highly encouraged to follow along with the code examples in lesson7.ipynb rather than just reading the content here!
groupby
Last time, we computed the “shakiness” of each location as the sum of all the magnitudes of earthquakes in that location across all time. For instructional purposes, let’s review how to compute shakiness without pandas (using a list of dictionaries) and with pandas (using a DataFrame).
Processing a List of Dictionaries
For this problem, we want to process the earthquakes.csv as a list of dictionaries and return the result as a dictionary (where the keys are place names and the values are ShakeFactor).
import cse163_utils
# Using the code we wrote to parse the CSV to a list of dictionaries
data = cse163_utils.parse('earthquakes.csv')
data[:5]  # First 5 rows-- food for thought: how would we get the first five rows from a DataFrame?
To compute shakiness, we’ll follow these steps:
- Create a result dictionary
- For each earthquake, find its
nameandmagnitudeand add themagnitudeto the correspondingname.
shakiness = {}  # Empty dictionary
for earthquake in data:
    name = earthquake['name']
    magnitude = earthquake['magnitude']
    shakiness[name] += magnitude

shakiness
Uh-oh! We get a KeyError because we are trying to set values of a dictionary before we’ve initialized any keys! When using a dict as a counter, remember that we have to check for the key before trying to modify its value. Let’s try again.
shakiness = {}  # Empty dictionary
for earthquake in data:
    name = earthquake['name']
    magnitude = earthquake['magnitude']
    if name not in shakiness:
        shakiness[name] = 0
    shakiness[name] += magnitude
And then we are done! It looks like California is the shakiest place on Earth!
What we have just done is a group by operation on the data. We put all the earthquakes into groups by some column label such as name, selected column values of interest such as magnitude, and aggregated (by summing with +) the values in each group.
Processing a pandas DataFrame
Since group by is such a common operation, pandas has its own syntax. Understanding how the list of dictionaries approach works is a good starting point to understand what happens in the background when using pandas.
import pandas as pd
df = pd.read_csv('earthquakes.csv')
We first show how to do this in pandas, and then we will go back and explain what the syntax is saying.
df.groupby('name')['magnitude'].sum()
The way to read this line of code uses the following logic: * df is the DataFrame we want to process * .groupby('name') tells the DataFrame we want it to group all of its rows by the name attribute. Conceptually, this step splits all the data into groups by name. * For each group, ['magnitude'].sum() selects the magnitude from all rows in that group and aggregates the data by taking the sum of the rows.
We can substitute sum aggregation operation for any other Series methods like min, max, and mean. You can also group by any column or use any column for your computations!
The final result is a Series that uses the name as its index. Remember that most of the datasets we’ve seen had integer indices, but we noted that his was not always the case. The result of a groupby has the values you used for group (in this case the string names of locations) as the indices. This makes it convenient to find the shakiness of California specifically, for example.
shakiness = df.groupby('name')['magnitude'].sum()
shakiness['California']
# 3638.4900000000084
What’s going on here?
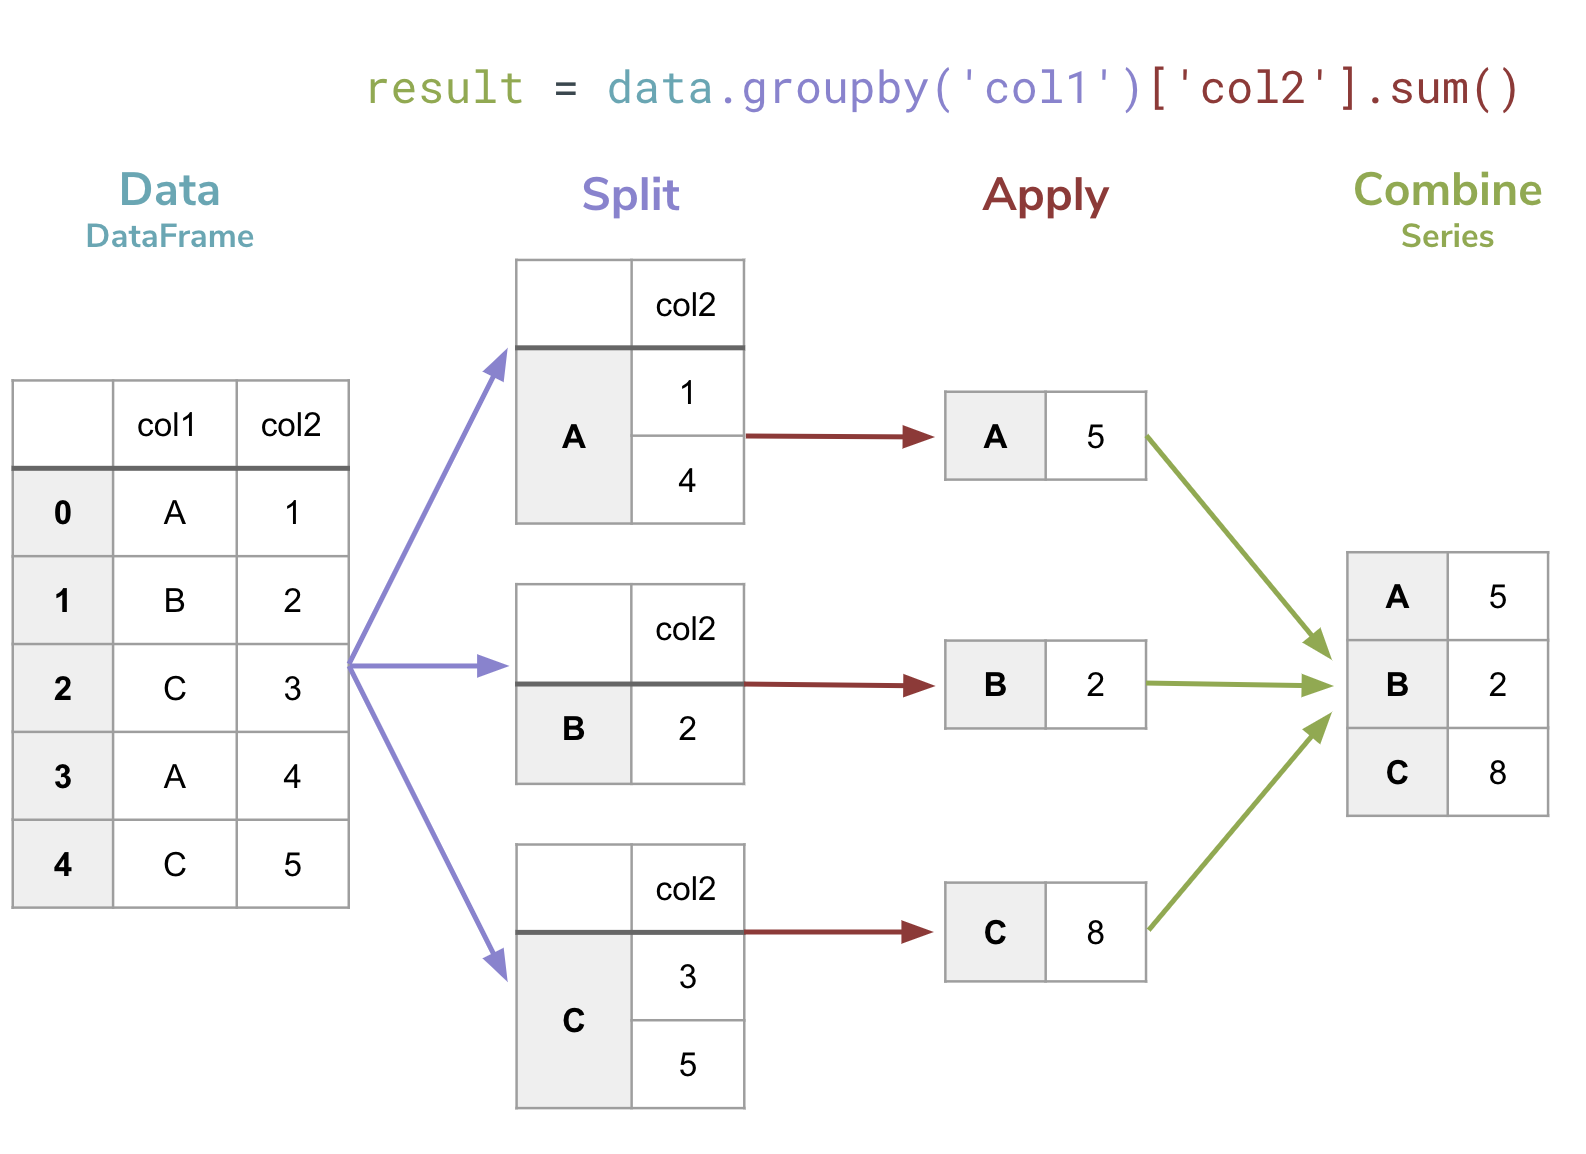
It’s pretty incredible that such a short line of code can do something so complex. In the bullet-list above, I described the steps that happen here but I find it easier to think about it with a small example. The figure below shows a visual explanation of what is going on when you do a groupby.
- Teal,
data. Specify theDataFrame. - Purple,
.groupby('col1'). Call thegroupbyfunction on thatDataFramepassingcol1as the column for forming groups. This splits the data up into groups based on the provided column.- This calls the
DataFrame.groupby(...)method, not indexing with[]! Note the parentheses rather than square brackets.
- This calls the
- Red,
['col2'].sum(). Specify the aggregation column,col2, and the aggregation function,.sum(). The values in each group are aggregated into a single value.- This selects a particular column by indexing with
[].
- This selects a particular column by indexing with
- Green,
result =. The final result evaluates to aSerieswithcol1as the index and the aggregation value for each group.
To get better understand what’s going on, let’s freeze at step 3 (before aggregating results into a Series) to see how Pandas represents the groupby operation.
# Make a DataFrame by giving it a list of dictionaries
example_data = pd.DataFrame([
    {'col1': 'A', 'col2': 1},
    {'col1': 'B', 'col2': 2},
    {'col1': 'C', 'col2': 3},
    {'col1': 'A', 'col2': 4},
    {'col1': 'C', 'col2': 5},
])

groupby = example_data.groupby('col1') # Notice no aggregate
groupby
This returns a special pandas object called a DataFrameGroupBy. This represents an “unfinished” groupby operation since we have not computed an aggregate yet. One feature that is kind of helpful for seeing what’s going on (but you will probably rarely use in practice) is the fact you can loop over a DataFrameGroupBy to inspect the groups.
for key, group in groupby:
    display(group) # To get the fancy Jupyter Notebook display of table
Alternatively, you can use the .describe() function, which gives several different summary statistics.
groupby['col2'].describe()
This is why when we do finish the computation, we get the sum of all these rows that fell into each group
result = example_data.groupby('col1')['col2'].sum()
result
It’s important to highlight that result is a Series with the step 2 group-by names as its index. You can access the underlying index of a Series or DataFrame using its .index attribute.
print(type(result))
print(result.index)
print(result['C'])
When to use this?
Whenever you want to separate your data into groups to get some value for each one, this is the natural time to ues a groupby! Whenever you see “for each” or “per” in a question, it’s likely you will want to use a groupby.
Here are some example questions you can solve with a groupby. We provide some “code” to compute each one, assuming the data had columns with the relevant names. * Compute the number of students per section
grades.groupby('Section')['StudentID'].count()
grades.groupby('Section')['Grade'].mean()
cities.groupby('country')['population'].sum()
Food for thought: What would happen if we wanted to use groupby with multiple columns? For example:
df.groupby(['year', 'month', 'day'])['magnitude'].describe()
apply
apply
Earlier, we saw how arithmetic operators like +, -, *, and / apply element-wise to pandas DataFrames or Series.
What if we wanted to find the length of each value in the name column? You might try something like the following and hope it does an element-wise computation as well.
len(df['name'])
This is evaluating to the number of elements in the entire Series, not the length of each place name! Only certain operators support element-wise computation. * Arithmetic operators such as +, -, *, /, etc. * Comparison operators such as ==, <, etc. * Logical operators such as &, |, ~.
Other functions will act on the entire Series, just as we saw with len!
Built-in Functions on pandas
To call the len function on each str, use the magic syntax below.
df['name'].str.len()
len function defined for strs to each element in the Series.” The syntax looks unusual at first, but it helps programmers be clear about the data type and the function to apply to each element! We won’t look at other data types now but there is a similar syntax for those as well. Now you aren’t limited to just calling len here, you can call pretty much any str function using this syntax.
str.lower()to lower-case each string and return them as a newSeries.str.upper()to upper-case each string and return them as a newSeries.str.len()to compute the length of each string and return them as a newSeries.str.strip(),str.lstrip(),str.rstrip()to trim whitespace from each string and return them as a newSeries.
For example, the following cell shows how to convert each name to its upper-case version.
df['name'].str.upper()
Note that this operation does not modify the original name column but rather returns a new Series with all the names upper-cased.
What if you wanted to write your own function to transform a value and apply it to each element in a Series? For example, what if I wanted to grab the first two characters from each name?
This is where we will need the more general apply function defined for pandas objects. apply is more general than using the specific str functions we saw above since it will let you call your own functions on each element. Before we show how to do the specific example of grabbing the first two characters from the names, let’s use this new approach to find the len of each name.
df['name'].apply(len)
The first part, df['name'].apply(, should probably make some sense to you. We are calling some function named apply on the Series df['name']. What’s very strange about this is it seems to be passing len as a parameter to the apply function! len is not being called directly here but passed as a parameter so that it can be later applied to each element.
This is probably the first time that you’ve seen this syntax. While this does look very strange, this is a feature of Python. A function is, in some sense, just like any other value in Python. But unlike int, str, or list, a Python function doesn’t represent data (like numbers, strings, or collections of such data). A Python function represents an algorithm that can later be applied to some data!
So the authors of pandas who wrote the apply function, wrote it to take a parameter that is another function like len. They then call that function on each element in the Series. As Python programmers, we can write our own functions that take other functions as parameters too.
def list_apply(values, function):
    """
    Takes a list of values and a function, and applies that function
    to each value in values. The given function must take one parameter
    as input and the returned list will be the result of calling that
    function once for each value in the list.
    """
    # It's not necessary to use a list comprehension here,
    # but it's the easiest way to write this method!
    return [function(v) for v in values]

list_apply(['I', 'love', 'dogs'], len)
There is no restriction to only passing in the len function as a parameter here. You can pass any function that takes a single argument.
So if we write a function first_two that takes a str and returns the first two characters, then we can pass first_two to apply.
def first_two(s):
    """
    Returns the first two characters of the given str as a str.

    Assumes there are at least two characters in s.
    """
    return s[:2]

df['name'].apply(first_two)
Food for thought: What happens to the parameter in the function definition? What if we had multiple parameters?
Saving Results
Remember this apply function doesn’t modify any data in the DataFrame or Series, but rather returns a new one. It’s common that you want to save the result of an apply to your dataset to use those values later. Just like how you can use the [] assignment syntax for list and dict types in Python, we can also assign columns directly to a pandas DataFrame.
We can use this syntax to update an existing column.
df['name'] = df['name'].str.upper()
df
Or use it to introduce a new column to the DataFrame.
df['first_two_letters'] = df['name'].apply(first_two)
df
Hierarchical indexing
Let’s revisit groupby to take note of something interesting. Take a look at the indices that result from the following groupby call:
magnitudes = df.groupby(['year', 'month', 'day'])['magnitude'].describe()
magnitudes
In pandas, a DataFrame can have a hierarchical index (or, a multi-level index) called a MultiIndex. We can use the .index property to investigate this further.
magnitudes.index
Food for thought: See a familiar data structure?
The MultiIndex comes in handy when your data might have multiple categorical dimensions. It allows us to work with and manipulate data with multiple levels as though it were one. Some common use cases are:
- Time-series data with multiple columns for time units (like the year, month, and day in
earthquakes.csv) - Experimental data with multiple factors that are difficult to represent in two dimensions
- Geographical data with nested location columns (such as country, state, city)
- Grouping data on multiple dimensions (hence why we see it with multi-column
groupby!)
Indexing a MultiIndex
We can use .loc with MultiIndex, but the syntax will look a bit strange. Recall that .loc[] takes in a row indexer and a column indexer, like so:
df.loc[row_indexer, column_indexer]
To select a specific combination of values in the MultiIndex, you would need to use a tuple.
magnitudes.loc[(2016, 8, 7), :]
Even though there are three values in the MultiIndex, we don’t need to select all of them! In the following slice, we have:
- The
'year'index set to2016 - The
'month'index set to8
Notice that we didn’t specify a 'day' index, so we still see all the possible 'day' values that have a 'year' of 2016 and a 'month' of 8.
magnitudes.loc[(2016, 8), :]
We can use slice(None) to select all values at a particular level. So, if we wanted all the values in August (when 'month' is 8) and it didn’t matter what day or year it was, we might do the following:
magnitudes.loc[(slice(None), 8, slice(None)), :]
Resetting Indices
The .reset_index() method converts index levels back into regular columns. This is useful when you need to perform column-wise operations or when you want to “flatten” your data structure.
By default, .reset_index() moves all index levels to their own columns and assigns integer indices starting from 0:
magnitudes_reset = magnitudes.reset_index()
magnitudes_reset
You could optionally pass in the name of an index level to turn it into a column instead. Take a look at the following:
magnitudes_year_reset = magnitudes.reset_index(level="year")
magnitudes_year_reset
magnitudes_day_year_reset = magnitudes.reset_index(level=["year", "day"])
magnitudes_day_year_reset
Food for thought: When might it be preferable to use a MultiIndex? When might it not be preferable?
⏸️ Pause and 🧠 Think
Take a moment to review the following concepts and reflect on your own understanding. A good temperature check for your understanding is asking yourself whether you might be able to explain these concepts to a friend outside of this class.
Here’s what we covered in this lesson:
groupbyapply- Hierarchical indexing and
MultiIndex
Here are some other guiding exercises and questions to help you reflect on what you’ve seen so far:
- In your own words, write a few sentences summarizing what you learned in this lesson.
- What did you find challenging in this lesson? Come up with some questions you might ask your peers or the course staff to help you better understand that concept.
- What was familiar about what you saw in this lesson? How might you relate it to things you have learned before?
- Throughout the lesson, there were a few Food for thought questions. Try exploring one or more of them and see what you find.
In-Class
When you come to class, we will work together on the problems in ufos.ipynb. We will also need ufos.csv for these tasks. Make sure that you have a way of editing and running these files!
Canvas Quiz
All done with the lesson? Complete the Canvas Quiz linked here!