MNIST Dataset
Now that you’ve successfully implemented k-means clustering and ran it on 2-dimensional data, we will now use it on a clustering of 784-dimensional data points with 12 centroids to identify hand-written letters. We will apply the algorithm to a real world data set known as the Extended Modified National Institute of Standards and Technology database (EMNIST), which contains images of hand-written letters. For this assignment, we are only using a small subset of the dataset. Here are eight example images:
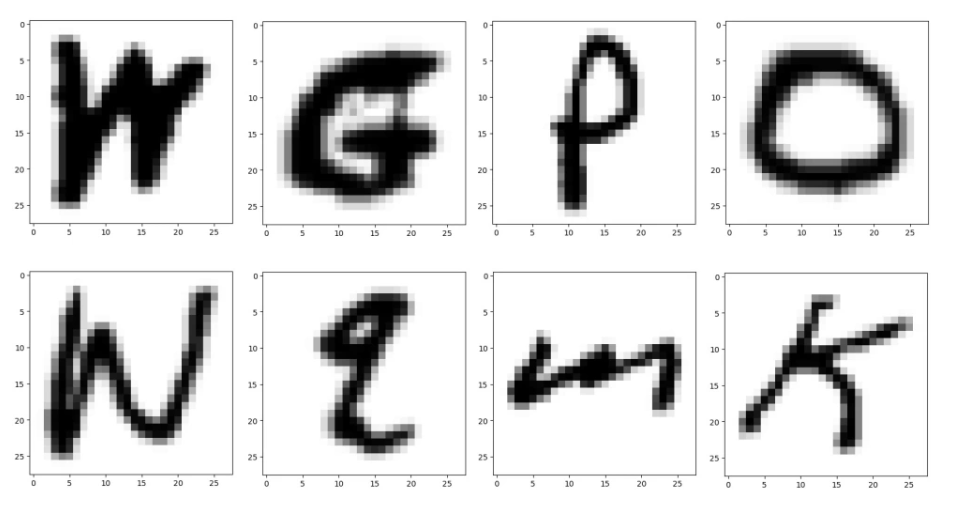
Each of these images is 28 pixels by 28 pixels, for a total of 784 pixels. Each image can be thought of as a 784-dimensional data point, represented as a list containing 784 numbers. For the images shown above, many of the numbers would be zero since the image is mostly white.
To load the MNIST dataset instead of the 2D points, change the code at the bottom of the kmeans.py to the following:
if __name__ == '__main__':
    dataset = 'mnist'

    data, label = read_data("data/" + dataset + ".csv")
    init_c = load_centroids("data/" + dataset + "_init_centroids.csv")
    final_c = main(data, init_c, dataset)
    write_centroids_with_key(dataset + "_final_centroids.csv", final_c)
(Only the variable dataset should change, from the string “2d” to “mnist”.)
You should leave the rest of your code un-changed and it should run with the new data without errors. Run this command again (it may take a minute to run on this data set): python kmeans.py
You should see the following output:
K-means converged after 27 steps.
In the results/MNIST folder, the init and final folders should be filled with the centroids plotted as images.
In the init folder, the centroids should look like random pixels (left below), because that’s how we randomly initialized them. In the final folder, they should look roughly like actual letters (right below) after similar data points (images) have been clustered together.
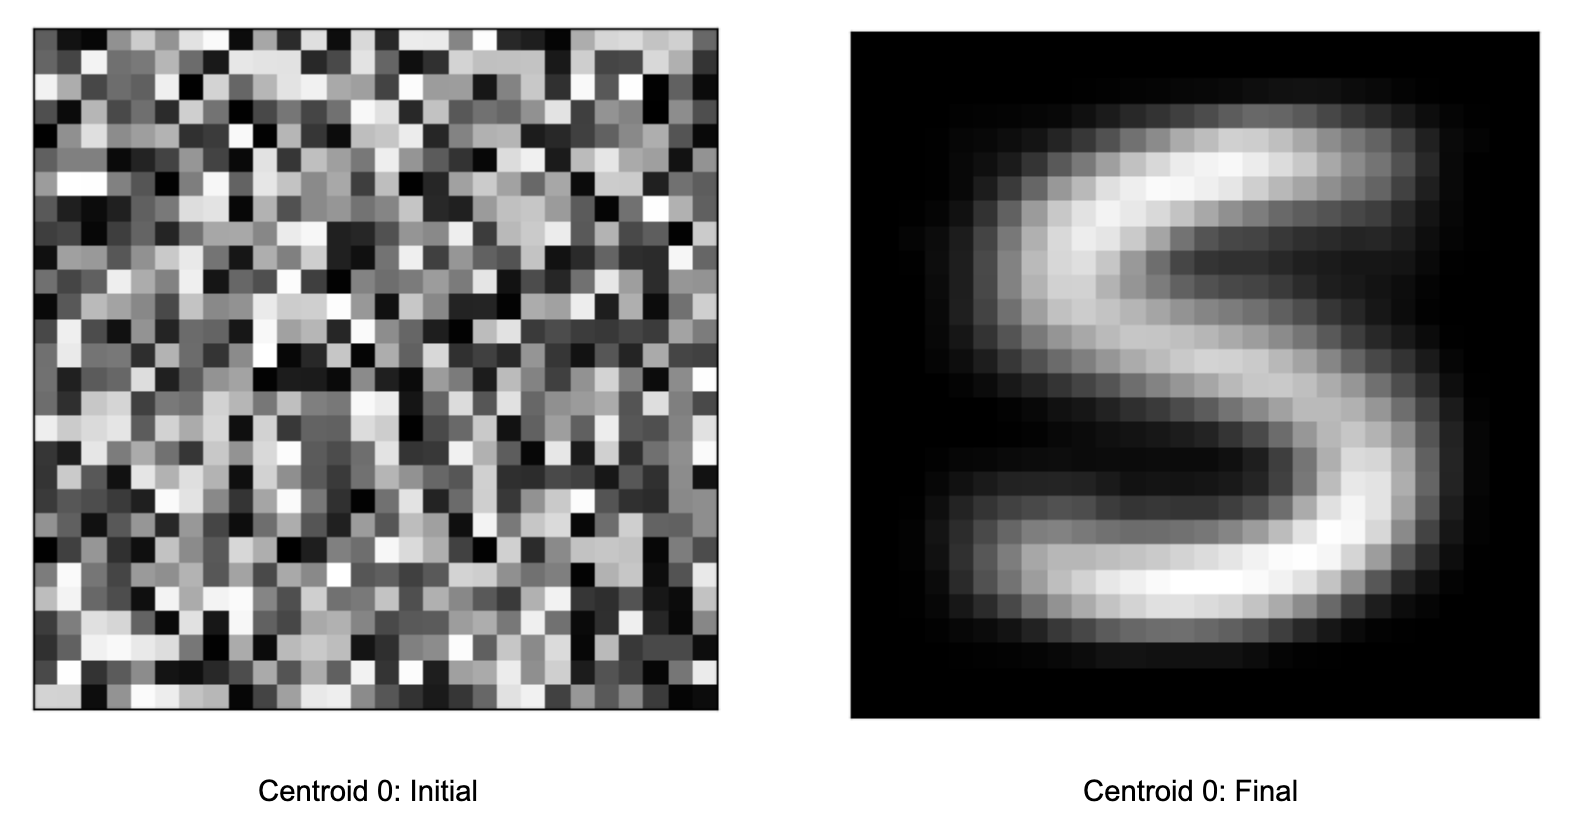
This shows that K-means has adjusted the locations of the centroids from our random initialization to a more meaningful space that corresponds to where the MNIST data is distributed.
If you were to plot each step of the algorithm between the init and final stages, you would see a progression from a blurry blob into something that looks like an actual character. (If the animation is stuck on “step26” you may need to refresh-skipping-cache in your browser. Hold shift and click on the refresh button to do so.)
For example, in this animation, the centroid is a random distribution of pixels that slowly converges on something approximating an ‘S’. Note that in this case, many of the intermediate steps make no change from each to the next. Since there are 11 other centroids, many of the others are still moving and changing before the algorithm converges.
Analyzing the Performance
Info
The images in the MNIST data set have been labeled with the letter they actually represent — you can see this label as the letter in the first column on each row in mnist.csv. Each row of that file represents one data point.
One way to evaluate our algorithm would be to examine the accuracy of the classification of the images from MNIST. For example, how many of the images labeled as the letter ‘K’ ended up closest to the same centroid?
First, let’s define the “classifications” of our data points provided by k-means clustering by taking a majority-takes-all approach: we assign each cluster a label as the majority labels of all data points in this cluster. For example, if we have data points with these labels assigned to cluster1: Q, Q, Q, Q, Q, Q, O, P, Q, Q, O, P, P, Q, Q.
Since there are 10 Q’s, 3 P‘s, and 2 O’s, we say the label of cluster1 is Q since it is the majority label (i.e the first six images have a label of Q), the seventh image has a label of O, and the eighth image has a label of P.
We can then define the accuracy of the classification for a centroid as:
In our example, the majority label is Q, there are 10 label Q’s, and there are 15 labels in total. So we say the accuracy for cluster1 is:
To determine the accuracy of our algorithm, we’ll figure out the majority label for a cluster and keep track of the count of the majority labels for every cluster in our dataset. The accuracy of the algorithm is then defined as:
We will implement the analysis code in a different file, analysis.py.
Load the final centroids: what happened?
Info
This section was modified and expanded on Friday, May 3rd, 2024. If you’ve worked through Part 2 before then, this section has since been updated.
We have provided some starter code for you near the bottom of analysis.py:
if __name__ == "__main__":
    centroids = load_centroids("mnist_final_centroids.csv", with_key=True)
    # Consider exploring the centroids data here

    data, label = read_data("data/mnist.csv")
    print(accuracy(data, label, centroids))
Take a closer look at this centroids dictionary and the images that were generated by adding print statements into the code. How many centroids are there in the final dictionary? In Part 1, we initialized the algorithm with 12 randomly chosen positions as the initial centroids and they all remain when the algorithm converges after 27 steps.
But what if we had used different starting centroids? In the 2D dataset from Part 1, there’s nothing particularly special about (0.332..., 0.179...) as a starting centroid. In fact, we could have started with any random point in the 2D plane. This is similarly true for the starting centroids we gave you for the MNIST data. The actual data set is 784 pixels, each varying from 0 to 255. Organized in a 28x28 grid and rendered into an image, most of them look like a handwritten letter. But if you look at the centroids, they only look like random noise: those 784 pixels were randomly generated.
So what if we generated different centroids to start off the algorithm? Would the results be any different?
Download this CSV file which uses a different set of starting centroids. Replace your data/mnist_init_centroids.csv file with this one. (You should either the file into the data folder and overwrite the original.)
Then, run kmeans.py again. What do you see in the centroids dictionary now? Why are there fewer centroids than 12? What do you suspect happened? Leave your answer in the appropriate place in the answers.txt file.
Assign labels to Centroids
When we implemented the assign_points_to_centroids() function in kmeans.py, it assigned each data point to the centroid it is closest to. This works great for our k-means clustering, but now we are not only interested in which centroid the data point is assigned to, but also the true label of that data point in order to perform the accuracy analysis.
In analysis.py, you should find a function named assign_labels(). This is a similar function to assign_points_to_centroids() but instead of assigning points to centroids, it assigns the actual labels of the data points.
def assign_labels(list_of_points, labels, centroids_dict):
    """
    Assign all data points to the closest centroids and keep track of their
    labels. The i-th point in "data" corresponds to the i-th label in "labels".

    Arguments:
        list_of_points: a list of lists representing all data points
        labels: a list of strings representing all data labels
                labels[i] is the label of the point list_of_points[i]
        centroids_dict: a dictionary representing the centroids where the keys
                        are strings (centroid names) and the values are lists
                        of centroid locations

    Returns: a new dictionary whose keys are the centroids' key names and
             values are a list of labels of the data points that are assigned
             to that centroid.

    Example:
        Code:
            list_of_points = [[1.1, 1, 1, 0.5], [4, 3.14, 2, 1], [0, 0, 0, 0]]
            labels = ['M', 'W', 'N']
            centroids_dict = {"centroid1": [1, 1, 1, 1],
                              "centroid2": [2, 2, 2, 2]}
            print(assign_labels(list_of_points, labels, centroids_dict))
        Output:
            {'centroid1': ['M', 'N'], 'centroid2': ['W']}
    """
Instead of nested lists of data points as the values of the dictionary returned, it should now be single lists that contain the labels of the data points, not the actual data points. Just like kmeans.py, we have provided tests for you to verify your implementation. Run python test_analysis.py in the terminal.
You should see the following output once you have correctly implemented assign_labels():
test_assign_labels passed.
Calculate the count of the majority label
Implement majority_count() to return the count of the majority label:
def majority_count(labels):
    """
    Return the count of the majority labels in the label list

    Arguments:
        labels: a list of labels

    Returns: the count of the majority labels in the list
    """
majority_count(): test_majority_count passed.
Calculate the accuracy of the algorithm
Use the two functions you implemented in the previous parts of Part 2 to calculate the accuracy for every cluster and the whole algorithm, defined as above in the Analyzing the Performance section.
Use assign_labels() and majority_count() to implement accuracy() to calculate the accuracy of our k-means clustering algorithm:
def accuracy(list_of_points, labels, centroids_dict):
    """
    Calculate the accuracy of the algorithm. You should use assign_labels and majority_count (that
    you previously implemented)

    Arguments:
        list_of_points: a list of lists representing all data points
        labels: a list of ints representing all data labels
                labels[i] is the label of the point list_of_points[i]
        centroids_dict: a dictionary representing the centroids where the keys
                        are strings (centroid names) and the values are lists
                        of centroid locations

    Returns: a float representing the accuracy of the algorithm
    """
You should see the following output once you have correctly implemented accuracy():
test_accuracy passed.
At this point, if you completed all parts to analysis.py you should see following output when you run the tests:
all tests passed.
Run analysis and think about the results
You have now completed all the parts required to run the analysis. The code at the end of the file will help to print the accuracy of the algorithm for this sample:
if __name__ == "__main__":
    centroids = load_centroids("mnist_final_centroids.csv", with_key=True)
    # Consider exploring the centroids data here

    data, label = read_data("data/mnist.csv")
    print(accuracy(data, label, centroids))
And run the program by typing python analysis.py.
Note that the file name returned in the output does not necessarily correspond with the label assigned to the character (ex. centroid0.png is not necessarily an image of ‘0’). Instead, decide on the label of the image by looking at the returned image itself. What is the output? Is this value surprising? It might be helpful to take another look at the final centroid images from MNIST in the results/MNIST/final folder.
In your opinion, based on these centroids, which letters are easier to be distinguished by the algorithm, and which are harder? If you can’t tell from the centroid images, consider printing the accuracy for each label inside of your accuracy function. Reasonable answers will receive full credit. (i.e, 2-3 sentences). Leave your answer in the appropriate place in the answers.txt file.
Quality
Info
Make sure to provide descriptive comments for each function in docstring format
Warning
If you discuss this assignment with one or more classmates, you must specify with whom you collaborated in the header comment in your submission. Otherwise, you may be guilty of academic misconduct and face consequences. Note that you may not collaborate in a way that is prohibited, even if you cite the collaboration.
Your assignment should pass two checks: flake8 and our code quality guidelines. The code quality guidelines are very thorough.
Submission
Submit analysis.py, kmeans.py, and answers.txt via Gradescope for part 2.