Background
Info
Watch this video by a former TA that gives a previous quarter’s overview of the assignment. Note that Problems 3 through 7 in the video are actually Problems 2 through 6 below.
One way to determine fraud in election results is to examine the least significant digits of the vote totals — the ones place and the tens place. The ones place and the tens place don’t affect who wins. They are essentially random noise, in the sense that in any real election, each value is equally likely. Another way to say this is that we expect the ones and tens digits to be uniformly distributed — that is, 10% of the digits should be “0”, 10% should be “1”, and so forth. If these digits are not uniformly distributed, then it is likely that the numbers were made up by a person rather than collected from ballot boxes (people tend to be poor at making truly random numbers.)
It is important to note that a non-uniform distribution does not necessarily mean that the data is fraudulent data. A non-uniform distribution is a great signal for fraudulent data, but it is possible for a non-uniform distribution to appear naturally.
Warning
DO NOT modify the function names, parameters, or output of the functions. Doing so will result in your assignment being graded incorrectly.
You will complete this assignment by writing several functions and write a main function that will be responsible for calling the other functions:
extract_election_votes(filename, column_names)plot_iran_least_digits_histogram(histogram)plot_dist_by_sample_size()mean_squared_error(numbers1, numbers2)calculate_mse_with_uniform(histogram)compare_iran_mse_to_samples(iran_mse, number_of_iran_datapoints)
Tip
Writing additional functions and tests will be helpful in completing this assignment. In fact, having additional tests is required.
Setup
Download the starter code. Then, extract (unzip) the contents anywhere on your computer. Take a look through the files. Here are some things to note:
- Inside of
fraud_detection.py, the call tomainis on the last line in the file. Your program should not execute any code, other than themainfunction, when it is loaded — all code from now on should be inside a function, never at the global level. Everything you want to happen when you run this file should go inside ofmain, including assert statements. - Inside of
fraud_detection_tests.py, you’ll only see one test function here. However, you are expected to create at least two additional tests to test the functionality of your code as you work through the assignment.
Given Function
The starter code contains the implementation and a couple of tests for a function that will be used a few times throughout this assignment. Here is the definition and description of that function:
def ones_and_tens_digit_histogram(numbers):
    '''
    Input:
        a list of numbers.
    Returns:
        a list where the value at index i is the frequency in which digit i
        appeared in the ones place OR the tens place in the input list. This
        returned list will always have 10 numbers (representing the frequency
        of digits 0 - 9).

    For example, given the input list
        [127, 426, 28, 9, 90]
    This function will return
        [0.2, 0.0, 0.3, 0.0, 0.0, 0.0, 0.1, 0.1, 0.1, 0.2]

    That is, the digit 0 occurred in 20% of the one and tens places; 2 in 30% of them; 6, 7, and 8
    each in 10% of the ones and tens, and 9 occurred in 20% of the ones and tens.

    See fraud_detection_tests.py for additional cases.
    '''
As mentioned in this function’s documentation, the fraud_detection_tests.py file in the starter code contains additional tests that demonstrate the function’s behavior.
Testing Your Code
An additional requirement of this assignment is to is to write tests.
Code quality is not just how it looks but how it behaves. Your fraud_detection_tests.py should have at least one test for each of the following functions:
extract_election_votes(filename, column_names)mean_squared_error(numbers1, numbers2)calculate_mse_with_uniform(histogram)
These tests should adhere to the following requirements:
- If you write more than one for a function (recommended, but not required), they should test distinctly different scenarios from each other (i.e., “exercise” different code paths in the function being tested or validate a different edge case).
- Use values that are different than what are used as examples in this spec.
- Have at least one comment describing the purpose of the test (e.g., what edge case or behavior the test case exemplifies)
Some tips for designing and writing your tests:
- We have not provided tests (other than for
ones_and_tens_digit_histogramdescribed above) or exact results to check your program against. We require you to write your own tests and to use assert statements.- Refer to the starter code given in
fraud_detection_test.pyfor an example of organizing your test functions.
- Refer to the starter code given in
- We HIGHLY encourage you to write tests before writing the functions. Doing so will allow you to check your work as you write your functions and ensure that you catch more bugs in your code.
- You do not need to test functions that generate plots or print output. Additionally, you do not need to create extra data files for testing, although you are welcome to do so to improve your test suite. However, since you cannot turn in those extra data files, you should comment those tests out in your final submission.
- To compare two floating point numbers (e.g.,
3.1415and2.71828), usemath.isclose()instead of==. - Try writing test cases with values other than the ones provided in this spec. This will help you catch edge cases your code might not cover.
- Your test function names should be descriptive. You should only be testing one specific function in each of your test functions and it should be clear which one you are testing.
Problem 1: Read and clean Iranian election data
There were four candidates in the 2009 Iranian election: Ahmadinejad, Rezai, Karrubi, and Mousavi. The file election-iran-2009.csv contains data, reported by the Iranian government, for each of the 30 provinces. We are interested in the vote counts for each of these candidates. Thus, there are 120 numbers we care about in the file.
Write a function called extract_election_votes(filename, column_names) that
- takes a filename and a list of column names and
- returns a list of integers that contains the values in those columns from every row (the order of the integers does not matter).
Example:
extract_election_votes("election-iran-2009.csv", ["Ahmadinejad", "Rezai", "Karrubi", "Mousavi"])
[1131111, 16920, 7246, 837858, 623946, 12199, 21609, 656508, ...]
Tip
You should make use of csv.DictReader, which will make it easy to read lines from a csv file.
We recommend that you open up the csv file and examine the data before writing code. You will notice that the data contains double-quotes and commas. It is common to receive data that is not formatted quite how you would like for it to be. It is up to you to handle the input by removing these symbols (we recommend using the replace() method) from the data before converting them into numbers.
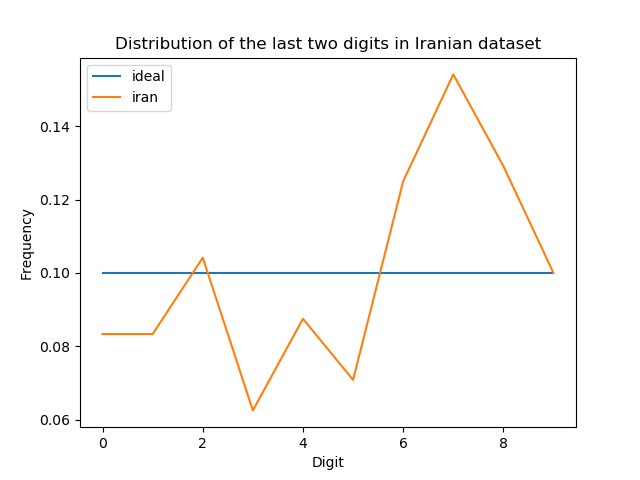
Problem 2: Plot election data
Write a function called plot_iran_least_digits_histogram(histogram) that
- takes a histogram (as created by
ones_and_tens_digit_histogram), - graphs the frequencies of the ones and tens digits for the Iranian election data, and
- saves the plot to a file named
iran-digits.pngand returns nothing.
Example:
plot_iran_least_digits_histogram(histogram) on the histogram created from the numbers in election-iran-2009.csv should save a plot called iran-digits.png that is identical to the following plot.
When creating the plot, you should use:
Info
Calling plt.show() before calling plt.savefig() will result in an empty figure. Be sure to call plt.show() as the last thing.
You may notice that when running your program, if you have created other plots earlier in the program or if you do not close the plotting window after you run the program, successive plots will be drawn to the same window. To avoid this, you may want to put in a call to plt.clf() at the end of your function after saving the plot.
Warning
Before submitting your assignment, be sure to comment out or remove plt.show() as that will interfere with our autograder.
import matplotlib.pyplot as pltto import the plt packageplt.plot()for the line itself (in order to make this line, you will need a list of length 10 in which every element is0.1)plt.title()for the titleplt.legend(loc='upper left')for the legendplt.savefig()to save the plotplt.show()to have Python open a new window and show the plot
Problem 3: Smaller samples have more variation
From the previous problem, the Iran election data is rather different from the expected flat line at y = 0.1. Is the data different enough that we can conclude that the numbers are probably fake? No — you can’t tell just by looking at the graphs we have created so far. We will show more principled, statistical ways of making this determination.
With a small sample, the vagaries of random choice might lead to results that seem different than expected. As an example, suppose you plotted a histogram of 20 randomly-chosen digits (10 random numbers, 2 digits per number):
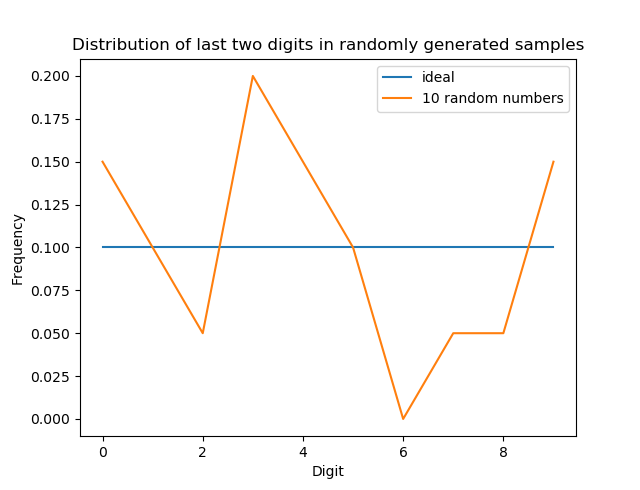
That looks much worse than the Iran data, even though it is genuinely random! It would be incorrect to conclude from this experiment that the data for this plot is fraudulent and that the data for the Iranian election is genuine. Just because your observations do not seem to fit a hypothesis does not mean the hypothesis is false — it is very possible that you have not yet examined enough data to see the trend.
To do that, we’ll write a function called plot_dist_by_sample_size() that
- creates five different collections (sizes 10, 50, 100, 1000 and 10,000) of random numbers where every element in the collection is a different random number
xsuch that0 <= x < 100, - plots the digit histograms for each of those collections on one graph
- saves the plot as
random-digits.pngand returns nothing.
Tip
You can generate random numbers with import random and calling random.randint().
Example:
plot_dist_by_sample_size()
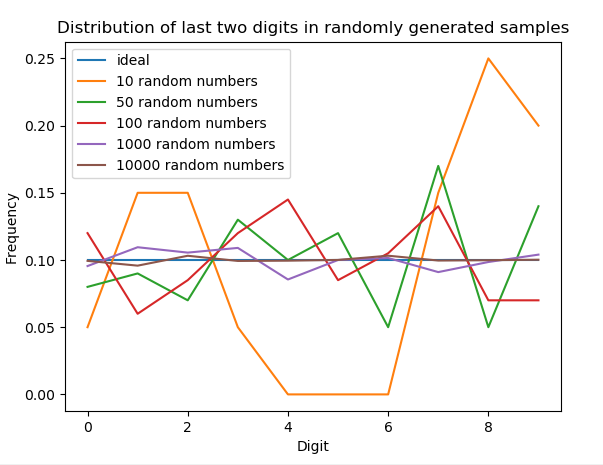
Your graph should have 6 total lines: one for each of the samples (10, 50, 100, 1000, and 10,000) and a line for the ideal.
Info
It is fine if the range of the y-axis varies from run to run and if your resulting plot has a different number of tickmarks on the x-axis.
Problem 4: Comparing variation of samples
In the previous problem, you can visually see that some lines we have plotted are closer to the ideal line than others. Rather than judging the closeness of two lines with our eyeballs, we can calculate how similar the two lines are by using a metric called the mean squared error (MSE).
Essentially, the MSE is a number that determines closeness of the two lines, where the larger the number is, the more different the two lines are. If the MSE is 0 then two lines are identical.
The MSE is computed as follows:
- For each point in one dataset, compute the difference between it and the corresponding point in the other dataset and then square the difference.
- Take the average of these squared differences.
The use of squares means that one really big difference among corresponding data points yields greater weight than several small differences. It also means that the distance between A and B is the same as the distance between B and A. That is, is the same as .
For example, suppose that you had the data that appears in the following table and plot:
| x | f(x) | g(x) | h(x) |
|---|---|---|---|
| 1 | 1 | 2 | 6 |
| 2 | 4 | 3 | 5 |
| 3 | 9 | 4 | 4 |
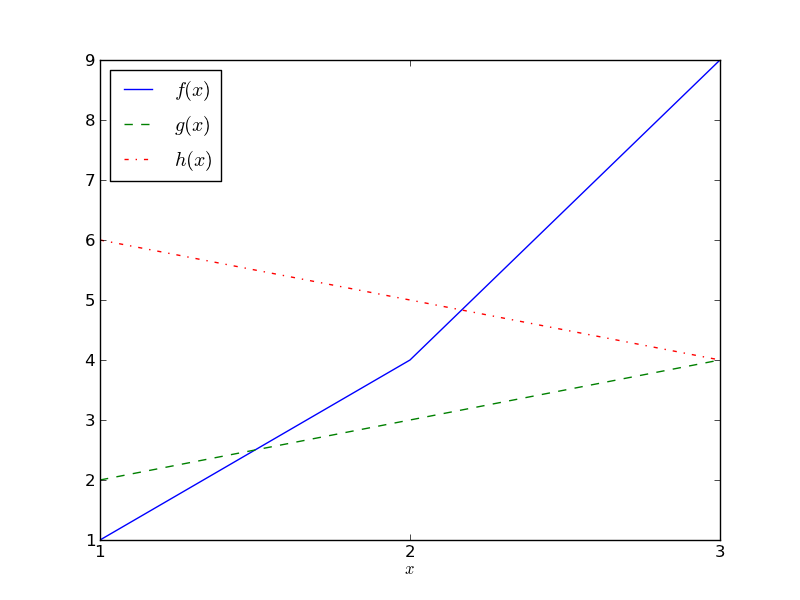
- The MSE difference between and is .
- The MSE difference between and is .
- The MSE difference between and is .
The actual values of the MSE (in this case: 9, 17 and 6.66666666667) are not interesting; it’s only the comparisons between them that are. For example, these numbers show that and are the most similar (have the smallest MSE), and and are the most different (have the largest MSE).
Write a function mean_squared_error(numbers1, numbers2) that
- takes two lists of numbers (you can assume the lists have the same length and are not empty) and
- returns the mean squared error between the lists.
Example:
mean_squared_error([1, 4, 9], [6, 5, 4])
should return:
17.0
Statistics background
The 120 data points from the 2009 Iranian election were generated by some process. That process could have been:
- an actual valid election or
- some other process, like a bureaucrat making up 120 numbers.
If process 1 was used, then we might expect the data points to have uniformly-distributed one’s and ten’s digits. Although we also know that any one set of 120 data points could look suspicious ( e.g. all 120 numbers end with “77”) yet still be data from a valid election - there is a very small possibility that, by pure coincidence, a fair election could have produced these results.
If you ran your code for problem 4 several times you saw how a histogram of a sample of 10 actual random numbers often did not look much like the “Ideal” histogram. 100 actual random numbers looked more “Ideal”, and 1,000 looked even more “Ideal”. Results from an Iranian election with these candidates and these provinces will only ever consist of 120 data points. We shouldn’t expect a histogram of 120 points to look as “Ideal” as a histogram made from 1,000 points. But what we are really wondering is, does the histogram for the reported results of the 2009 Iranian election look like a histogram we would get for a set of 120 randomly generated data points?
While we could potentially use a statistical formula to calculate how likely it is that the results of the 2009 Iranian election occurred that way by chance, we will use a different approach. Instead, we will generate 10,000 samples of 120 randomly generated data points and see how the 2009 Iranian election results compare to those 10,000 samples.
As in problem 4, we expect that a larger number of samples will lead to less variation (so we will use 10,000 sets of 120 numbers rather than say just 10 sets of 120 numbers). In particular, we will see how the 2009 Iranian election results compare to the ideal distribution and also how each of the 10,000 actual random samples compare to the ideal distribution. We talk more below in problem 6 and 7 about how we will interpret this comparison.
Our methodology is as follows:
- We take as an assumption that the observed sample (the Iranian election data) is not fraudulent (they are the actual, unadulterated vote counts from the election) — we call this the null hypothesis.
- Our question is whether we can, with high likelihood, reject that assumption.
- Our specific question is, What is the likelihood that the Iranian election data is a sample of a large unknown dataset whose least significant digits are uniformly distributed?
Problem 5: Calculating the Mean Squared Error
Part 1
Write a function called calculate_mse_with_uniform(histogram) that
- takes a histogram (for example, as created by
ones_and_tens_digit_histogram) and - returns the mean squared error between the given histogram and the uniform distribution.
Example:
Calling calculate_mse_with_uniform with the histogram from the Iranian election results for the ones and tens digits should return the result 0.000739583333333.
To be more explicit, the call:
calculate_mse_with_uniform(histogram)
should return:
0.000739583333333
Part 2
Info
Some of the things you are asked to do in this problem are very similar to other problems from earlier. Rather than copying and pasting the same code for multiple problems, we recommend moving that code into a separate function that can be called in both problems.
Warning
You will be deducted if there is duplicate code.
Write a function called compare_iran_mse_to_samples(iran_mse, number_of_iran_datapoints) that
- takes two inputs: the Iranian MSE (as computed by
calculate_mse_with_uniform()) and the number of data points in the Iranian dataset (120 but this should not be hardcoded), - builds 10,000 groups of random numbers, where each number
xis randomly generated such that 0 <= x < 100, and each group is the same size as the Iranian election data, - computes the MSE with the uniform distribution for each of these groups,
- compares the 10,000 MSEs to the Iranian MSE by determining and printing
- how many of the 10,000 random MSEs are larger than or equal to the Iran MSE,
- how many of the 10,000 random MSEs are smaller than the Iran MSE, and
- the Iranian election null hypothesis rejection level.
Each of these values should be printed after the Iran MSE from part 1.
With each run of your program, you should expect a slightly different outcome from this function call.
Example:
compare_iran_mse_to_samples(0.000739583333333, 120)
should print the following, but with ___ replaced with your answers:
2009 Iranian election MSE: ___
Quantity of MSEs larger than or equal to the 2009 Iranian election MSE: ___
Quantity of MSEs smaller than the 2009 Iranian election MSE: ___
2009 Iranian election null hypothesis rejection level p: ___
Problem 6: Interpret your results
Interpret your results and write your answers in answers.txt. State whether the data suggest that the Iranian election results were fraudulent. Then justify your answer by giving and comparing it to the threshold for statistical significance, .
To help you with this task, below are some possibilities for the outcome of the previous question. Each example includes an explanation of how to interpret such their result.
As a reminder, the MSEs are a measure of how different the ones_and_tens_digit_histogram() for that dataset were from the ideal, uniform distribution. The greater the MSE, the more different from the ideal, and therefore the more likely the data are fraudulent.The null hypothesis for this scenario is that the Iranian election data is not fraudulent. We are looking to see if the Iranian election was different enough from a random distribution that we can reject the null hypothesis (conclude the data are fraudulent).
Tip
We recommend you pay attention to the percent of random MSEs that are smaller than the Iranian election MSE.
Example 1
Suppose that 9992 of the random MSEs were smaller than the Iranian election MSE (and therefore 8 were larger or equal). This means that only about 0.08% of genuine elections would be as different from the uniform distribution as the Iranian election was. Given that, it is highly unlikely that the Iranian election was genuine, so we say that we are 99.92% confident that the data is fraudulent. More precisely, your program should output “2009 Iranian election null hypothesis rejection level p: 0.0008”.
Example 2
Suppose that 8871 of the random MSEs were smaller than the Iranian election MSE (and therefore 1129 were larger or equal). This means that only 11.29% of genuine elections were as different from the uniform distribution as the Iranian election was. Given that, it is somewhat unlikely that the Iranian MSE would be this high, but not so surprising that we can say the data is fraudulent.
When we observe an event (such as the Iranian MSE being a particular value) that is more than 5% likely, we say that it does not provide statistically significant evidence to reject the null hypothesis. This means that, by convention, when a result is reported as “statistically significant”, there is less than a 5% chance that the result is just a fluke caused by natural randomness.
Example 3
Suppose that 4833 of the random MSEs were smaller than the Iranian election MSE (and therefore 5167 were larger or equal). This means that only 51.67% of genuine elections were as different from the uniform distribution as the Iranian election was. This is not surprising at all; it provides no evidence regarding the null hypothesis.
Example 4
Suppose that 29 of the random MSEs were smaller than the Iranian election MSE (and therefore 9971 were larger or equal). This means that 99.71% of genuine elections were as different from the uniform distribution as the Iranian election was. Again, this provides no evidence regarding the null hypothesis.
Quality
Info
Make sure to provide descriptive comments for each function in docstring format.
Warning
If you discuss this assignment with one or more classmates, you must specify with whom you collaborated in the header comment in your submission. Otherwise, you may be guilty of academic misconduct and face consequences. Note that you may not collaborate in a way that is prohibited, even if you cite the collaboration.
Your assignment should pass two checks: flake8 and our code quality guidelines. The code quality guidelines are very thorough. Please ensure you’ve reviewed those guidelines (and updated your code to follow them) before submitting.
Code Tests
As a reminder, having tests for this assignment is required. Review those requirements above before uploading your submission.
Submission
Submit fraud_detection.py, fraud_detection_tests.py and answers.txt to Gradescope. And answer a required survey asking how much you spent and other reflections on part of the assignment.
HW6 - Homework 6
Initial Submission by Thursday 06/01 at 11:59 pm.
Submit on Gradescope