K-means clustering is a popular machine learning and data mining algorithm that discovers possible clusters within a dataset. Finding these clusters can often reveal interesting and meaningful information in the distribution of data. K-means clustering is used for a number of different applications, such as recognizing hand-written digits, which we will be implementing in this assignment.
K-Means Clustering Overview
K-means clustering works in four steps:
- Initialize some number () of cluster centers (centroids).
- For each data point in the dataset, assign it to the closest centroid.
- Update the locations of the centroids to be the average of all the points assigned to that cluster.
- Repeat steps 2 and 3 until convergence.
Info
The data points do not change. Only the locations of the centroids change with each iteration. As the centroids move, the set of data points that are closest to each centroid changes.
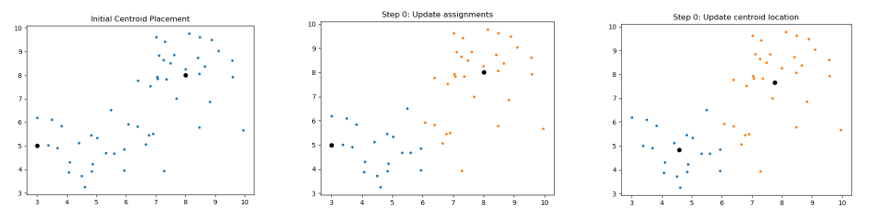
The following images are an example of a single run of the K-means clustering:
As with many machine learning techniques, there is a lot of terminology associated with it. A lot of the terminology is just fancy names for simple concepts. Here we’ll define and go over some of them in a bit more detail:
Distance
A simple way we can calculate how close a data point is to a centroid is with euclidean distance, which is just a fancy way of saying “a straight line.” We can calculate the euclidean distance by using the Pythagorean theorem. If we have two points and , where is the dimension we are in, we can define the euclidean distance between both points as:
For example, if we had two data points from a 3-dimensional dataset x1 = [-2, -1, -4] and x2 = [10, -5, 5], the distance between x1 and x2 can be found by
Clusters
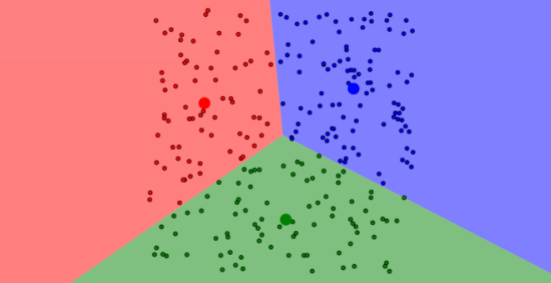
A cluster is a collection of points that are part of the same group. For k-means, every point is part of a cluster. As the algorithm progresses and the centroids shift, points may change what cluster they are in, even though the point itself does not move. For example, in the picture below, all blue points are part of cluster1, all red points are part of cluster2, and all green points are part of cluster3.
Centroids
A centroid is the center of a cluster. In K-means, we assume that the centroid of a cluster is the average location of all the points in that cluster. This is equivalent to the average of the data points’ components in each dimension. If we have three n-dimensional points , , and , the average is defined as:
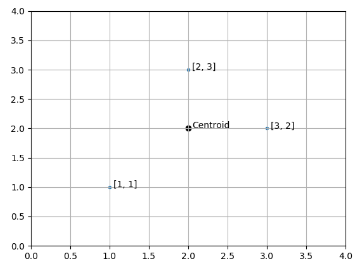
For example, if a cluster contains three 2-dimensional points:
x1 = [1, 1]
x2 = [2, 3]
x3 = [3, 2]
The centroid for this cluster is defined as:
The following image is a graphical representation of these three points and their centroid:
Convergence
We say our algorithm has converged if the locations of all centroids did not change much between two iterations (e.g. within some threshold, such as or ). For example, if we have two 2-dimensional centroids and :
c1 = [0.45132, -0.99134]
c2 = [-0.34135, -2.3525]
After running the next iteration of the algorithm, the centroids are updated to:
c1 = [1.43332, -1.9334]
c2 = [-1.78782, -2.3523]
We say the algorithm has NOT converged, since the location of the two centroids are very different between iterations. However, if the new locations of the centroids are instead:
c1 = [0.45132, -0.99134]
c2 = [-0.34135, -2.3524]
We say the algorithm HAS converged, since the locations of the two centroids are very similar between iterations.
K-Means Clustering Algorithm
The K-means algorithm (in pseudo code) is described as follows:
data = Load Data
centroids = Randomly Created K Centroids

while centroids not converged:
    for each data point:
        assign data point to the closest centroid
    for each centroid:
        set new centroid location to be the mean of
        all points in this cluster
The following gif visualizes this process:
The initial frame (step0) is the initialization: two randomly chosen centroids are drawn as an X in blue (centroid 0) and red (centroid 1). In the following steps, (step1 through step6):
- Data points are assigned to whichever centroid is closest (and colored accordingly),
- Centroid locations are adjusted based on the mean of the points assigned to them.
This process is repeated until the centroids do not move anymore. As we progress through the steps, and especially in the later ones, the centroids do not move as much between steps. Throughout the algorithm, the data points never move but they may be assigned to different centroids as they are updated.
You can also check out Naftali Harris’s Visualizing K-Means Clustering site to play with k-means and get more familiar with it.