we define the distance between points a and b as:
Part I Due: at 11:00pm on Wednesday, February 10, 2021. Submit via Gradescope.
(REQUIRED Feedback
Survey)
Part II Due: at 11:00pm on Monday, February 15, 2021. Submit via Gradescope.
(REQUIRED Feedback
Survey)
This time we have a couple videos available to help clarify the assignment if you feel like you need more guidance. The first video is a excerpt from 2/3 Lecture that introduces the assignment and the K-means algorithm. The direct link is here if the embeded version is not working for you.
This next video goes into more detail on what you will be doing for part-1 specifically. It gives examples of input and output for each of the five functions you'll need to implement in part 1. The direct link for this video is here.
This last video covers the requirements of part 2. Direct link.
In Homework 4, we will implement a commonly-used algorithm -- K-means clustering. K-means is a popular machine learning and data mining algorithm that discovers potential clusters within a dataset. Finding these clusters in a dataset can often reveal interesting and meaningful structures underlying the distribution of data. K-means clustering has been applied to many problems in science and still remains popular today for its simplicity and effectiveness. Here are a few examples of recently published papers using K-means:
Hopefully, these examples motivate you to try this homework out! You will very likely be able to apply this computational tool to some problems relevant to you! Though appearing in many advanced fields of science, the essence of K-means is not difficult to understand. We will break down the name and explain the algorithm now.
We will assume we have a dataset of m data points where each data point is n-dimensional. For example, we could have 100 points on a two dimensional plane, then m = 100 and n = 2.
Given two n-dimensional points a and b where:
we define the distance between points a and b as:
This is commonly known as the Euclidean distance. For example, the
Euclidean distance between the three-dimensional points x1 and x2
(displayed as Python lists) is:
x1 = [-2, -1, -4], x2 = [10, -5, 5]
Here is another example of two four-dimensional points:
x1 = [0, 0, 1, 1], x2 = [1, 1, 0, 0]
A centroid can be seen as the “center of mass” of a group of points.
In K-means, we assume that the centroid of a cluster is the mean
of all the points in that cluster. The mean data point consists
of the mean of the components on each dimension. Say, for three
n-dimensional points a, b, and c, we have the mean as:
For example, if a cluster contains three 2D points
(displayed as Python lists) as below:
x1 = [1, 2], x2 = [3, 4], x3 = [5, 6]
The centroid for this cluster is defined as:
C = [(1 + 3 + 5)/3, (2 + 4 + 6)/3] = [3, 4]
Our ultimate goal is to partition the data points into K clusters.
How do we know which data point belongs to which cluster?
It is actually extremely hard to find the “optimal” answer for this,
but K-means takes a simple, heuristic approach - we simply assign
a data point to the centroid whose distance to the data point is
the smallest (the “closest centroid” to this data point)!
Let’s assume we already have K centroids, initialized randomly.
Now, if our randomly initialized centroids were already in good
locations, we would have been done! However, it is most likely that
the initial centroid locations do not reflect any information about
the data (since they were just random). To update the centroid locations
to something that makes more sense we use an iterative approach:
One last question you may have is, when do we stop repeating these two steps?
I.e., what does it mean for the algorithm to have converged?
We say the algorithm has converged if the locations of all centroids
did not change much between two iterations.
Take this example of two centroids of 2-dimensional points.
If at the previous iteration, we have the two centroid locations as:
c1 = [0.45132, -0.99134], c2 = [-0.34135, -2.3525]
And at the next iteration the centroids are updated to:
c1 = [1.43332, -1.9334], c2 = [-1.78782, -2.3523]
Then we say the algorithm has NOT converged, since the location
of the two centroids are very different between iterations.
However, if the new locations of the centroids are instead:
c1 = [0.45132, -0.99134], c2 = [-0.34135, -2.3524]
Then we say the algorithm HAS converged, since the locations
of the two centroids are very similar between iterations
(Typically, “very similar” means for every dimension of two points
a and b, their difference (|a - b|) is smaller than some constant
(1e-5 is a common choice)).
In summary, the K-means algorithm (in pseudo code) is described as follows:
    data = Load Data
    centroids = Randomly Created K Centroids
    while centroids not converged:
        for each data point:
            assign data point to the closest centroid
        for each centroid:
            set new centroid location to be the mean of
            all points in this cluster
The following gif visualizes this process, and will be what you accomplish in Part 1! The initial frame (step0) is the initialization: two randomly chosen centroids are drawn as an X in blue (centroid 0) and red (centroid 1). Then in the following steps (step1 through step6):

In the following parts of this homework, you will implement this algorithm and apply it to (1) 2D points shown in the gif above; (2) a small subset of the MNIST hand-written digit dataset.
Please download homework4.zip and unzip the file to get started. You should see the following file structure in the homework4 folder:
homework4
├── __init__.py
├── analysis.py [Your code for Part 2]
├── data [data to run the programs with]
│   ├── 2d_init_centroids.csv
│   ├── data_2d.csv
│   ├── mnist.csv
│   └── mnist_init_centroids.csv
├── kmeans.py [Your code for Part 1 and Part 2]
├── results [Where your result figures will be saved]
│   ├── 2D
│   └── MNIST
│       ├── final
│       └── init
└── utils.py [Helper code: Don’t edit]
The red highlighted part is where you will work on your code. We have provided utils.py which contains helper code to help you complete the assignment. Do not change anything in utils.py!
You will be given the following data structures for K-means clustering:
Implement the following function in kmeans.py:
def euclidean_distance(data1, data2):
    """Calculate the Euclidean distance between two data points.

    Arguments:
    data1: a list of floats representing a data point
    data2: a list of floats representing a data point

    Returns: the Euclidean distance between two data points
    """
In the code we have provided you for this (and all functions you need to implement), the body of the function is empty. We have provided testing code for you to verify your implementation. Run
python kmeans.pyin a terminal window to verify your implementation of eucliean_distance. If you passed our tests, you should see:
test_eucliean_distance passed.Note that you may find several assertions further down in the program failing at this point. This is to be expected since you have not implemented those parts of the program yet! In fact this will continue to happen as you progress through the problems. Success usually means you are no longer failing the same assertion, but that instead a different assertion is failing further down in the program.
Implement the following function in kmeans.py:
def assign_data(data_point, centroids):
    """Assign a single data point to the closest centroid. You should use
    the euclidean_distance function (that you previously implemented).

    Arguments:
    data_point: a list of floats representing a data point
    centroids: a dictionary representing the centroids where the keys are
               strings (centroid names) and the values are lists of
               centroid locations

    Returns: a string as the key name of the closest centroid to the data point
    """
We have provided testing code for you to verify your implementation. test_assign_data() is already set up to run when
python kmeans.pyis typed in a terminal window. Check the output of this test to verify your implementation.
Implement the following function in kmeans.py:
def update_assignment(data, centroids):
    """
    Assign all data points to the closest centroids. You should use
    the assign_data function (that you previously implemented).

    Arguments:
    data: a list of lists representing all data points
    centroids: a dictionary representing the centroids where the keys are
               strings (centroid names) and the values are lists of
               centroid locations

    Returns: a new dictionary whose keys are the centroids' key names and
             values are lists of points that belong to the centroid. If a
             given centroid does not have any data points closest to it,
             do not include the centroid in the returned dictionary.
    """
Notice that your algorithm should run regardless of if any
centroid becomes empty, i.e. there are no points that are the
closest to a centroid. In that case you should not include
that centroid in the dictionary you return.
We have provided testing code for you to verify your implementation.
test_update_assignment() is already set up to run when
python kmeans.pyis typed in a terminal window. Check the output of this test to verify your implementation.
Implement the following function in kmeans.py:
def mean_of_points(data):
    """Calculate the mean of a given group of data points. You should NOT
    hard-code the dimensionality of the data points.

    Arguments:
    data: a list of lists representing a group of data points

    Returns: a list of floats as the mean of the given data points
    """
We have provided testing code for you to verify your implementation. test_mean_of_points() is already set up to run when
python kmeans.pyis typed in a terminal window. Check the output of this test to verify your implementation.
def update_centroids(assignment_dict):
    """
    Update centroid locations as the mean of all data points that belong
    to the cluster. You should use the mean_of_points function (that you
    previously implemented).

    Arguments:
        assignment_dict: the dictionary returned by update_assignment function

    Returns: A new dictionary representing the updated centroids
    """
Notice that you should not hard-code the dimensionality of
data - your code needs to run regardless of the dimension
of data!
We have provided testing code for you to verify your implementation.
test_update_centroids() is already set up to run when
python kmeans.pyis typed in a terminal window. Check the output of this test to verify your implementation.
python kmeans.pyin the terminal window. You should see:
All tests passed.
You have now completed all parts needed to run your k-means algorithm! Now, let's verify your implementation by running the algorithm on 2D points. At the bottom of kmeans.py you should see code like this:
if __name__ == "__main__":
    main_test()

    # data, label = read_data("data/data_2d.csv")
    # init_c = load_centroids("data/2d_init_centroids.csv")
    # final_c = main_2d(data, init_c)
    # write_centroids_tofile("2d_final_centroids.csv", final_c)
This is the code that actually runs when your program does. Right now your code is only calling the main_test() function. De-comment the last four lines and turn the call to main_test() into a comment. These new commands will load the 2D data points and the initial centroids we provided in from .csv files. After that, main_2d will execute the k-means algorithm and write_centroids_tofile will save the final centroids to a file to save them permanently. Your code should now look like this:
if __name__ == '__main__':
    # main_test()

    data, label = read_data("data/data_2d.csv")
    init_c = load_centroids("data/2d_init_centroids.csv")
    final_c = main_2d(data, init_c)
    write_centroids_tofile("2d_final_centroids.csv", final_c)
Now run your program again by typing
python kmeans.pyin the terminal window. If you are successful, you should see:
K-means converged after 7 steps.as the output of the program. In addition, there should be 7 plots generated, in the results/2D/ folder. If you examine these 7 plots, they should be identical to the steps shown in the the gif above.
You've completed part 1! Before you take a break, be sure to submit kmeans.py via Gradescope.
Answer a REQUIRED survey asking how much time you spent and other reflections on this part of the assignment.
Now that you have successfully run K-means clustering on
2-dimensional data points with 2 centroids, we will use
your code to do clustering of 784-dimensional data points
with 10 centroids. Don’t worry, you won’t need to change
any of the code that you wrote!
We will apply the algorithm to a real world data set known
as the Modified National Institute of Standards and Technology
database (MNIST). It is a dataset that consists of images of
hand-written digits. Here are nine example images from the
MNIST data set (we are using a very small subset of all MNIST images):
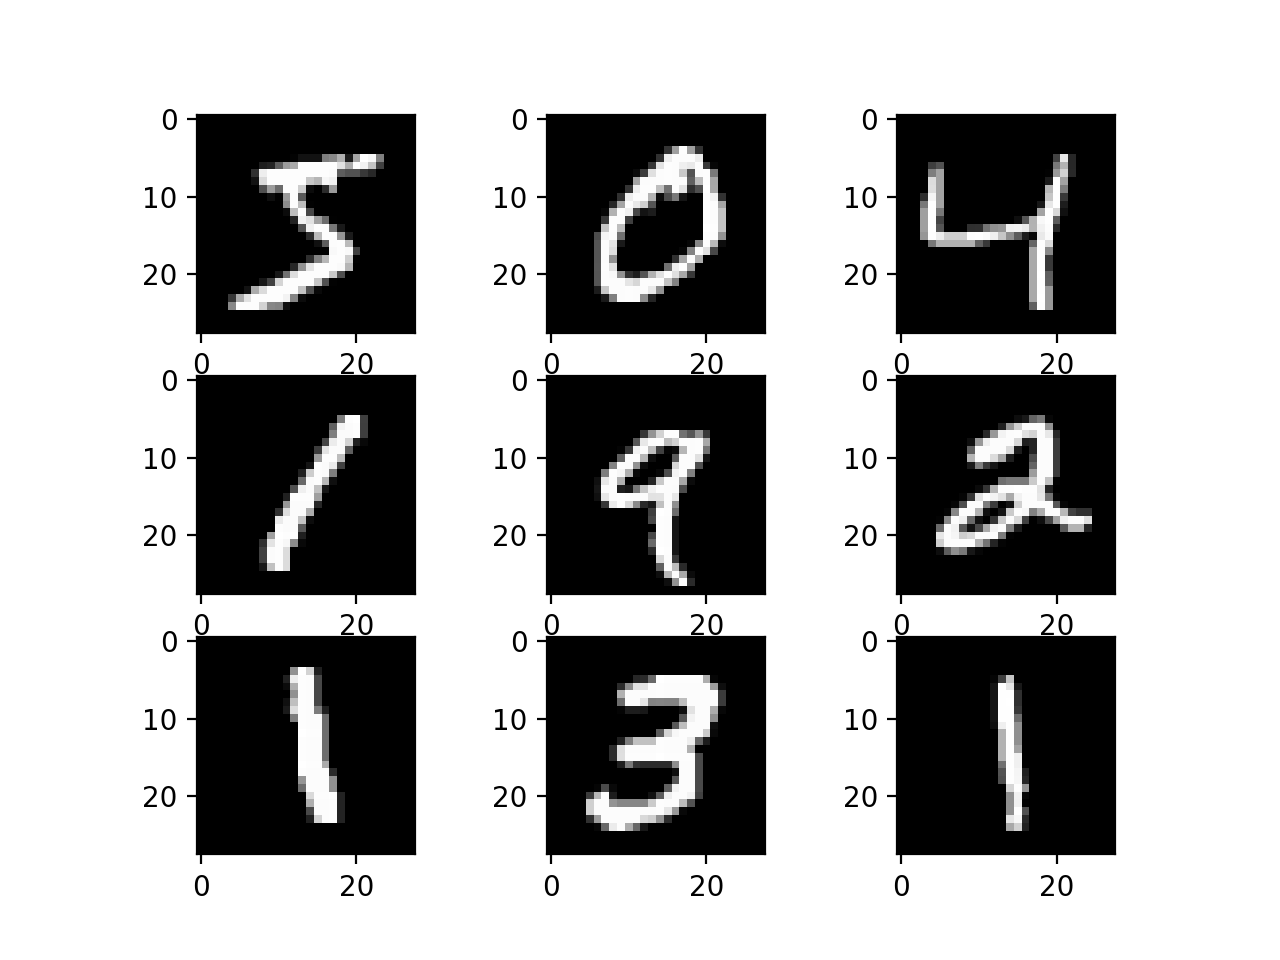
Each of these images is 28 pixels by 28 pixels, for a total of 784 pixels.
(As in HW3, pixels have values between 0 and 255 (0=black, 255=white),
although we don’t need to know this for K-means.) Each image can be
thought of as a 784-dimensional data point, represented as a list
containing 784 numbers. For the images shown above, many of the
numbers would be zero since the image is mostly black. So the nine
sample images above are actually nine sample data points!
We will see how applying K-means to these digit images helps us
discover clusters of images which contain mostly one kind of digit!
To load the MNIST dataset instead of the 2D points, change the code
at the bottom of the file to the following (the red text shows the
changes that should be made):
if __name__ == '__main__':
    # main_test()

    data, label = read_data("data/mnist.csv")
    init_c = load_centroids("data/mnist_init_centroids.csv")
    final_c = main_mnist(data, init_c)
    write_centroids_tofile("mnist_final_centroids.csv", final_c)
You should leave the rest of your code intact, and it should run with the new data without errors! Run this command again (it may take a minute to run on this data set!):
python kmeans.py
You should see the following output:
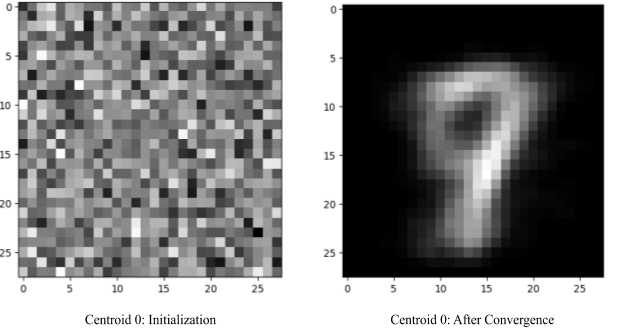
K-means converged after 18 steps.Meanwhile, in the results/MNIST folder, the init and final folders should be filled with the centroids plotted as images. Remember that centroids are basically a data point that represents the average of all the data points (images) that are assigned to it.
How do we evaluate the performance of our algorithm? The images in
the MNIST data set have been labelled with the digit they actually
represent. (You can see this label as the digit in the first column
on each row in the file mnist.csv. Each row of that file represents
one data point (image).) So, one way to evaluate our algorithm would
be to examine the accuracy of the classification of the images from
MNIST. For example, how many of the images known to be (labelled as)
the digit 4 ended up in the centroid we think of as representing the
digit 4?
First, let’s define the “classifications” of our data points provided
by K-means. We take a majority-takes-all approach: we assign each
cluster a label as the majority labels of all data points in this
cluster. For example, say we have data points with these labels
assigned to cluster1:
2, 2, 2, 2, 2, 2, 8, 6, 2, 2, 6, 8, 8, 2, 2Since there are 10 2’s, 3 8’s, and 2 6’s, we say the label of cluster 1 is 2 since it’s the majority label.
Now we can start the analysis. We have provided the code for you near the bottom of analysis.py:
if __name__ == "__main__":
    centroids = load_centroids("mnist_final_centroids.csv")
    # Consider exploring the centroids data here

    # main_test()

    # data, label = read_data("data/mnist.csv")
    # print(accuracy(data, label, centroids))
First, please take a closer look at this centroids dictionary and/or the images that were generated. Feel free to write some print statements to explore the content (you don’t need to show this code when you submit your homework) - how many centroids are there in the dictionary now? In Part A, we initialized the algorithm with 10 randomly chosen positions as the initial centroids. Why are there fewer centroids than 10 now? What do you suspect happened? This question is just for fun (un-graded), but we want you to at least think about what is happening and give an answer. Leave your answers as comments at the bottom of the file (analysis.py). Please do not stress about this question!
When we implemented the update_assignment function, it assigned each data point to the centroid it is closest to. This works great for our algorithm, but now we are not only interested in which centroid the data point is assigned to, but also the true label of that data point in order to perform the accuracy analysis. Therefore, we need to update the function to incorporate more parameters and return different values. Implement the following function in analysis.py:
def update_assignment(data, labels, centroids):
    """Assign all data points to the closest centroids
    and keep track of their labels. The i-th point in
    "data" corresponds to the i-th label in "labels".

    Arguments:
        data: a list of lists representing all data points
        labels: a list of ints representing all data labels
        centroids: the centroid dictionary

    Returns: a new dictionary whose keys are the centroids'
             key names and values are a list of the
             labels of the data points that are assigned to
             that centroid.
    """
Notice the red parts as the difference between the previous
version of the function you wrote and what you need to write now.
Instead of nested lists of data points as the values of the
dictionary returned, it should now be single lists that contain
the labels of the data points, not the actual data
points. Feel free to copy your previous implementation in
kmeans.py over as a starting point. And just like your
old implementation, you should use the assign_data
function when implementing this one.
We have provided testing code for you to verify your implementation. De-comment
the call to main_test() near the bottom of analysis.py and then
run python analysis.py, which will call that same main_test(). Similar to
part 1, you should see
test_update_assignment passedif your update_assignment is working. You will see a test fail after that, since your other functions are not ready yet.
In the next function, you should take in a single list of labels, and return the count of the majority label defined as above. Implement the following function in analysis.py:
def majority_count(labels):
    """
    Return the count of the majority labels in the label list

    Arguments:
        labels: a list of labels

    Returns: the count of the majority labels in the list
    """
We have provided testing code for you to verify your implementation. Run python analysis.py again. This time you should see
test_majority_count passedif your majority_count is working. You will see a test fail after that, since your last function is not ready yet.
Use the two functions you implemented to calculate the accuracy for every cluster and the whole algorithm, defined as above. Implement the following function in analysis.py:
def accuracy(data, labels, centroids):
    """
    Calculate the accuracy of the algorithm. You
    should use update_assignment and majority_count
    (that you previously implemented)

    Arguments:
        data: a list of lists representing all data points
        labels: a list of ints representing all data labels
        centroids: the centroid dictionary

    Returns: a float representing the accuracy of the algorithm
    """
We have provided testing code for you to verify your implementation. Run python analysis.py again. This time you should see
test_accuracy passedif your accuracy function is working. Now you should also see
all tests passed.
You have now completed all the parts required to run the analysis. Please de-comment the last few commented lines of code at the bottom of analysis.py and comment out the call to main_test() (and remove your exploration code from Step 1) so you have:
if __name__ == "__main__":
    centroids = load_centroids("mnist_final_centroids.csv")

    # main_test()

    data, label = read_data("data/mnist.csv")
    print(accuracy(data, label, centroids))
And run the program by typing:
python analysis.pyWhat is the output? Is this value surprising? It might be helpful to take another look at the final centroid images from MNIST in the results/MNIST/final folder -- In your opinion, based on these centroids, which digits are easier to be distinguished by the algorithm, and which are harder? If you can't tell from the centroid images, consider printing the accuracy for each label inside of your accuracy function. This question is graded, but don’t stress too much about it. Reasonable answers will receive full credit. Leave your answer as comments at the bottom of the file analysis.py.
Be sure to submit both analysis.py and kmeans.py via Gradescope under part 2.
Answer a REQUIRED survey asking how much time you spent and other reflections on this part of the assignment.