Due: at 11:59pm on Friday, December 11, 2020. Only ONE late day may be applied to HW6. HW6 will not be accepted after 11:59pm on Sunday Dec 13.
Submit
your fraud_detection.py, fraud_detection_tests.py, answers.txt file via
Gradescope. (REQUIRED survey)
For all of our assignments you should NOT use parts of Python not yet discussed in class or the course readings.
Advice from previous students about this assignment:
A portion of your grade depends on use of good coding style. Code written in good style is easier to read and understand, is easier to modify, and is less likely to contain errors. You should comment clearly, create functions as needed, and minimize redundancy (Don't Repeat Yourself).
Your program's documentation should allow us to understand it. You can get some ideas on how to document your code from the starter code of previous assignments. Follow good docstring conventions (You do not have to follow these conventions to the letter).
Different parts of this assignment require similar, but not exactly identical, work. When you notice such repetition, you should refactor and generalize your code. That is, rather than writing two similar functions, you should write one function that takes the place of most of both.
You should decompose functions into smaller helper functions. One usual good rule of thumb is that if you cannot come up with a descriptive name for a function, then it may be too small or too large. If there is a good name for a portion of a function, then you might consider abstracting it out into a helper function.
We have not provided tests or exact results to check your program against. We encourage you to write your own tests and to use assert statements.
Make sure to add import statements to gain access to tools and functions that are not included by default, such as matplotlib.pyplot or math. All import statements should be at the top of the file, before any function definitions.
Important: Leave yourself some time to go back and refactor your code before you turn it in. Whenever you make a change to your program, ensure that it produces the same results as before. Pay close attention to the coding style section of the specification as it will be a large portion of your grade. It is very possible to get a low grade on this assignment even if your program correctly executes the requested calculations if you are not paying attention to style.
In this assignment, you will look for fraud in election returns from the disputed 2009 Iranian presidential election. You will examine the least significant digits of the vote totals — the ones place and the tens place.
The ones place and the tens place don't affect who wins. They are essentially random noise, in the sense that in any real election, each value is equally likely. Another way to say this is that we expect the ones and tens digits to be uniformly distributed — that is, 10% of the digits should be “0”, 10% should be “1”, and so forth. If these digits are not uniformly distributed, then it is likely that the numbers were made up by a person rather than collected from ballot boxes. (People tend to be poor at making up truly random numbers.)
It is important to note that a non-uniform distribution does not necessarily mean that the data is fraudulent data. A non-uniform distribution is a great signal for fraudulent data, but it is possible for a non-uniform distribution to appear naturally.
You will complete this assignment by writing several functions. You must preserve the names, parameters, and output of these functions. DO NOT add more parameters to these functions. The functions that we ask for are as follows:
Note that you are STRONGLY ENCOURAGED to create additional functions as needed, but we require that the functions above be present with these EXACT names and parameters.
Additionally, you'll write a main function that will be responsible for calling the other functions.
fraud_detection.py to hold your code.
# The code in this function is executed when this file is run as a Python program
def main():
    # Code that calls functions you have written above
    # e.g. extract_election_vote_counts() etc.
    # This code should produce the output expected from your program.


if __name__ == "__main__":
    main()
This if statement and the call to main inside of it should be the last line in your file, after all of the function definitions. Your program should not execute any code, other than the main function, when it is loaded; that is, all code from now on should be inside a function, never at the global level. Think of the main function as the "driver" of your program. Everything you want to happen when you run this file should go inside of main. Do not place any assert statements outside of functions in fraud_detection.py.
Create a file called fraud_detection_tests.py to hold your tests for the functions from fraud_detection.py. Not all functions are easy to test, but we will expect to see tests for many of your functions. Please put your tests in the file fraud_detection_tests.py using an approach similar to what we did in HW5. You may want to use a similar structure to what you have in fraud_detection.py - with a main function that gets called from inside of an if statement as shown above.
There were four candidates in the 2009 Iranian election: Ahmadinejad, Rezai, Karrubi, and Mousavi. The file election-iran-2009.csv contains data, reported by the Iranian government, for each of the 30 provinces. We are interested in the vote counts for each of these candidates. Thus, there are 120 numbers we care about in the file.
Requirements:
Write a function called extract_election_vote_counts that:
Example:
The call:
extract_election_vote_counts("election-iran-2009.csv", ["Ahmadinejad", "Rezai", "Karrubi", "Mousavi"])
Should return:
[1131111, 16920, 7246, 837858, 623946, 12199, 21609, 656508, ...
Hints:
Requirements:
Write a function ones_and_tens_digit_histogram that:
Specifically:
Examples:
Here are some example calls to the function and their results:
The call:
ones_and_tens_digit_histogram([127, 426, 28, 9, 90])
Should return:
[0.2, 0.0, 0.3, 0.0, 0.0, 0.0, 0.1, 0.1, 0.1, 0.2]
And the call:
ones_and_tens_digit_histogram([0, 1, 1, 2, 3, 5, 8, 13, 21, 34, 55, 89, 144, 233, 377, 610, 987, 1597, 2584, 4181, 6765])
Should return:
[0.21428571428571427, 0.14285714285714285, 0.047619047619047616, 0.11904761904761904, 0.09523809523809523, 0.09523809523809523, 0.023809523809523808, 0.09523809523809523, 0.11904761904761904, 0.047619047619047616]Hints:
Requirements:
Write a function called plot_iranian_least_digits_histogram that:
Example:
Calling:
plot_iranian_least_digits_histogram(histogram)
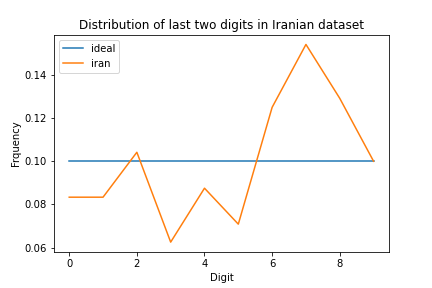
on the histogram created from the numbers in election-iran-2009.csv should save a plot called iran-digits.png that is identical to the following plot.
Don't forget the x- and y-axis labels and the legend (although the entries in the legend can come in any order, and the colors of the lines, and tick marks on the x and y axis may be different). Use plt.plot for the line itself (don't forget to use the label= optional argument). To create the legend at the top right corner, use plt.legend.
Don't forget the title. Add a title with plt.title.
The Ideal line above represents the "uniform distribution" (where each digit occurs with equal frequency — that is, utterly randomly). In order to make this line, you will need a list of length 10 in which every element is 0.1.
The Iran election data are rather different from the expected flat line at y = 0.1. Are these data different enough that we can conclude that the numbers are probably fake? No — you can't tell just by looking at the graphs we have created so far. We will show more principled, statistical ways of making this determination.
Hints:With a small sample, the vagaries of random choice might lead to results that seem different than expected. As an example, suppose that you plotted a histogram of 20 randomly-chosen digits (10 random numbers, 2 digits per number):
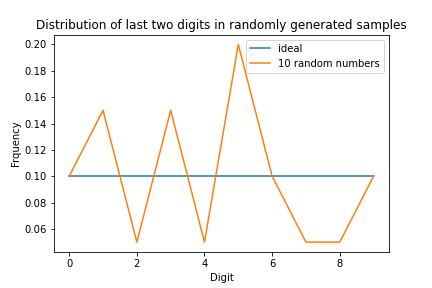
That looks much worse than the Iran data, even though it is genuinely random! Of course, it would be incorrect to conclude from this experiment that the data for this plot is fraudulent and that the data for the Iranian election is genuine. Just because your observations do not seem to fit a hypothesis does not mean the hypothesis is false — it is very possible that you have not yet examined enough data to see the trend.
Requirements:
Write a function called plot_distribution_by_sample_size that:
Example:
Calling:
plot_distribution_by_sample_size()
should produce a graph similar, but not identical, to the figure above.
Your plot demonstrates that the more datapoints there are, the closer the result is to the ideal histogram. We must take the sample size into account when deciding whether a given sample is suspicious.
Hints:In the previous problem, you can visually see that some lines we have plotted are closer to the Ideal line than others. Rather than judging the closeness of two lines with our eyeballs, we would like a way to computationally determine how similar two lines are.
Specifically, we would like to determine whether the difference between lines A and B is larger or smaller than the difference between lines C and D. For this, we will define a distance metric. Given two lines, it returns a number — a distance — that is 0 if the two lines are identical, and is larger the more different the two lines are.
One common measure for the difference/distance between two datasets is the mean squared error. MSE is computed as follows:
The use of squares means that one really big difference among corresponding datapoints yields greater weight than several small differences. It also means that the distance between A and B is the same as the distance between B and A. That is, (9 - 4)2 is the same as (4 - 9)2.
For example, suppose that you had the data that appears in the following table and plot:
| x | f(x) | g(x) | h(x) |
|---|---|---|---|
| 1 | 1 | 2 | 6 |
| 2 | 4 | 3 | 5 |
| 3 | 9 | 4 | 4 |
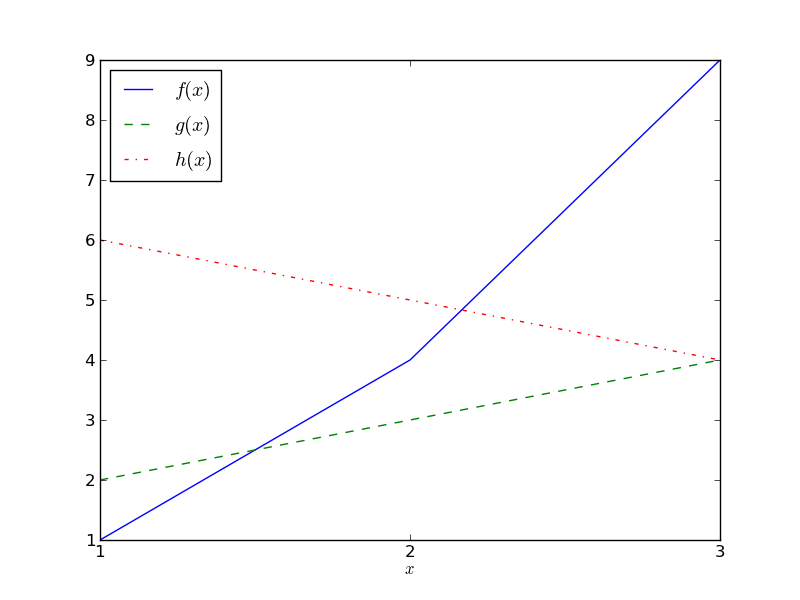
The MSE difference between f and g is
((1-2)2 +
(4-3)2 +
(9-4)2) / 3 = 9.
The MSE difference between f and h is
((1-6)2 +
(4-5)2 +
(9-4)2) / 3 = 17.
The MSE difference between g and h is
((2-6)2 +
(3-5)2 +
(4-4)2) / 3 = 6.66666666667.
The actual values of the MSE (in this case: 9, 17 and 6.66666666667) are not interesting; it's only comparisons between them that are. For example, these numbers show that g and h are the most similar (have the smallest MSE), and f and h are the most different (have the largest MSE).
Requirements:
Write a function mean_squared_error that:
Example:
The call:
mean_squared_error([1, 4, 9], [6, 5, 4])
Should return:
17.0
The 120 datapoints from the 2009 Iranian election were generated by some process. That process could have been:
If process (a) was used, then we might expect the data points to have uniformly-distributed ones and tens digits. Although we also know that any one set of 120 data points could look suspicious (e.g. all 120 numbers end with “77”) yet still be data from a valid election - there is a very small possibility that, by pure coincidence, a fair election could have produced these results.
If you ran your code for problem 4 several times you saw how a histogram of a sample of 10 *actual* random numbers often did not look much like the "Ideal" histogram. 100 *actual* random numbers looked more "Ideal", and 1,000 looked even more "Ideal". Results from an Iranian election with these candidates and these provinces will only ever consist of 120 data points. We shouldn't expect a histogram of 120 points to look as "Ideal" as a histogram made from 1,000 points. But what we are really wondering is, does the histogram for the reported results of the 2009 Iranian election look like a histogram we would get for a set of 120 randomly generated data points?
While we could potentially use a statistical formula to calculate how likely it is that the results of the 2009 Iranian election occured that way by chance, we will use a different approach. Instead,
As in problem 4, we expect that a larger number of samples will lead to less variation (so we will use 10,000 sets of 120 numbers rather than say just 10 sets of 120 numbers). In particular we will see how the 2009 Iranian election results compare to the ideal distribution and also how each of the 10,000 actual random samples compare to the ideal distribution. We talk more below in problem 6 and 7 about how we will interpret this comparison.
Our methodology is as follows:
Requirements (part 1 of 2):
Write a function called calculate_mse_with_uniform that:
Example:
Invoking calculate_mse_with_uniform with the the Iranian election results histogram (for the ones and tens digits) should return the result 0.000739583333333, or approximately 0.0007.
To be more explicit, the call:
calculate_mse_with_uniform(histogram)
Should return:
0.000739583333333
Of course, this number on its own does not mean anything — we don't know whether it is unusually low, or unusually high, or about average. What MSE would 120 randomly generated data points have?
Requirements (part 2 of 2):
Write a function called compare_iranian_mse_to_samples that:
With each run of your program, you should expect a slightly different outcome from this function call.
Example:
Calling the function in your program:
compare_iranian_mse_to_samples(0.000739583333333, 120)
You would see the following, except that ___ is replaced by your answers:
2009 Iranian election MSE: ___
Quantity of MSEs larger than or equal to the 2009 Iranian election MSE: ___
Quantity of MSEs smaller than the 2009 Iranian election MSE: ___
2009 Iranian election null hypothesis rejection level p: ___
(See Problem 7 below for more about the p value)
Hints:Below are some possibilities for the outcome of the previous question. They each include an explanation of how to interpret such a result. You should pay attention to the % of random MSEs that are smaller than the Iranian election MSE.
Remember that the MSEs in this function and discussed below are a measure of how different the ones_and_tens_digit_histogram for that dataset were from the ideal, uniform distribution. The greater the MSE, the more different from the ideal, and therefore the more likely the data are fraudulent.
Also, remember that the null hypothesis is that the Iranian election data are not fraudulent. We are looking to see if the Iranian election was different enough from a random distribution that we can "reject the null hypothesis" (conclude the data are fraudulent).
Suppose that 9992 of the random MSEs were smaller than the Iranian election MSE (and therefore 8 were larger or equal). This means that only about 0.08% of genuine elections would be as different from the uniform distribution as the Iranian election was. Given that, it is highly unlikely that the Iranian election was genuine, so we say that we are 99.92% confident that the data are fraudulent. More precisely, we say that “we reject the null hypothesis at the p=.0008 level”.
Suppose that 8871 of the random MSEs were smaller than the Iranian election MSE (and therefore 1129 were larger or equal). This means that only 11.29% of genuine elections were as different from the uniform distribution as the Iranian election was. Given that, it is somewhat unlikely that the Iranian MSE would be this high, but not so surprising that we can say the data are fraudulent.
By convention, when we observe an event (such as the Iranian MSE being a particular value) that is more than 5% likely, we say that it does not provide statistically significant evidence to reject the null hypothesis. This means that, by convention, when a result is reported as "statistically significant", there is less than a 5% chance that the result is just a fluke caused by natural randomness.
Suppose that 4833 of the random MSEs were smaller than the Iranian election MSE (and therefore 5167 were larger or equal). This means that only 51.67% of genuine elections were as different from the uniform distribution as the Iranian election was. This is not surprising at all; it provides no evidence regarding the null hypothesis.
Suppose that 29 of the random MSEs were smaller than the Iranian election MSE (and therefore 9971 were larger or equal). This means that 99.71% of genuine elections were as different from the uniform distribution as the Iranian election was. Again, this provides no evidence regarding the null hypothesis.
(However, that 99.71% of elections deviated more than this example from the ideal is unusual in itself. That's remarkably close to the theoretical ideal — much closer than one would typically expect a randomly-chosen sample of that size to be. Maybe the data were fudged to look really, really natural — too natural, suspiciously natural. In any event, this result does not give grounds for accusing the election authorities of fraud, given what we were measuring.)
An interesting note about the phrase "statistically significant": suppose that you are only testing genuine, non-fraudulent elections. Then, 5% of the time, the above procedure will cause you to cry foul and make an incorrect accusation of fraud. This is called a false positive or false alarm. False positives are an inevitable risk of statistics. If you run enough different statistical tests, then by pure chance, some of them will (seem to) yield an interesting result (relevant XKCD cartoon). You can reduce the chance of such an error by reducing the 5% threshold discussed above. Doing so makes your test less sensitive; your test will more often suffer a false negative or failed alarm — a situation where there really was an effect but you missed it. That is, there really was fraud but it was not detected.
In this assignment, you have computed approximated statistical confidence via simulation: generation of random data, then comparison. This idea of performing many trials, and seeing how likely or unlikely the real data are, is at the heart of all statistics, and it is more fundamental than memorizing a set of complex formulas. This approach can be applied in many situations, including those when you do not have an explicit formula.
Requirements:
Interpret your results and write your answers in answers.txt. State whether the data suggest that the Iranian election results were fraudulent. Then justify your answer by giving p and comparing it to the threshhold for statistical significance, p=0.05.
We have provided you with another dataset, from the 2008 US presidential election. It appears in the file election-us-2008.csv, and is taken from Wikipedia. Consider the null hypothesis that it is a genuine dataset (and therefore should have a uniform distribution of ones and tens digits).
Implement a function called compare_us_mse_to_samples that performs the same analysis as compare_iranian_mse_to_samples but with 2008 US presidential election dataset.
When finished with this problem, when you run fraud_detection.py, it's output should exactly match the following formatting, including capitalization and spacing (except where ___ is replaced by your answers):
2009 Iranian election MSE: ___
Quantity of MSEs larger than or equal to the 2009 Iranian election MSE: ___
Quantity of MSEs smaller than the 2009 Iranian election MSE: ___
2009 Iranian election null hypothesis rejection level p: ___

2008 United States election MSE: ___
Quantity of MSEs larger than or equal to the 2008 United States election MSE: ___
Quantity of MSEs smaller than the 2008 United States election MSE: ___
2008 United States election null hypothesis rejection level p: ___
Requirements:
us_2008_candidates = ["Obama", "McCain", "Nader", "Barr", "Baldwin", "McKinney"]
Now you are done!