The Chrome Web Inspector and Debugger are conveniently built-in with Chrome. You can launch it by hitting F12 while in your browser or by right clicking on a web page and selecting the Inspect menu item. The images below show a few different views that you'll see in the Chrome DevTools browser.
Chrome DevTools Source Tab
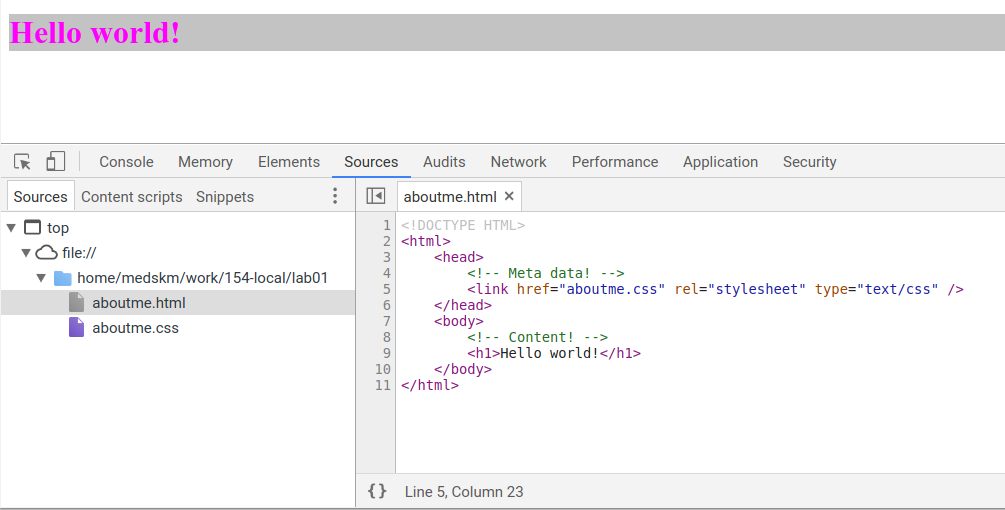
In Chrome's Inspector, you'll see a tab that shows all of your source files in the current directory,
relative to the file path you have in your browser's file path (where URL's are). Below
is a screenshot that is similar to what you would see when clicking on this
aboutme.html page.
Modifying the HTML in the Browser (Elements Tab)
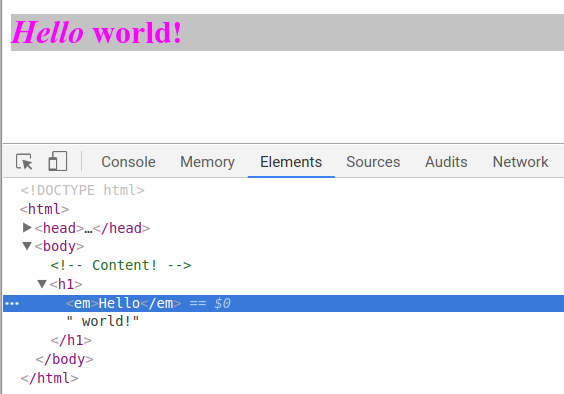
One handy way to quickly test the effects of changing HTML tags is to edit the HTML directorly in the browser. When clicking on the "Elements" Tab in Chrome, you can do so by right-clicking on the HTML you're looking at and choosing the option to edit HTML. Then the HTML will be editable - after making any changes (new tags, changing tags, etc.) you should see the effects on your page immediately! But know if you refresh the page, these changes will go away.
Modifying the CSS in the Browser (Elements Tab)
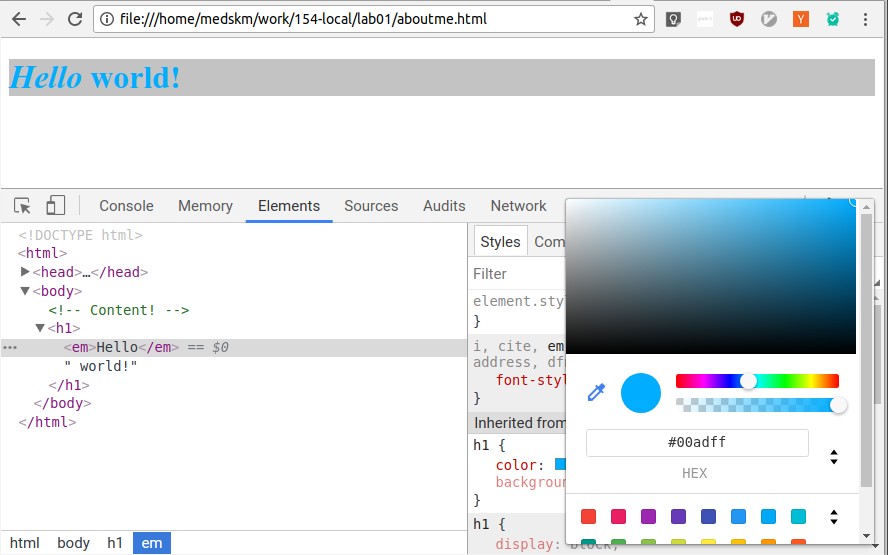
In addition to being able to view/modify HTML in the browser, you can also edit styles on the page. This is especially helpful when testing different color combinations, fonts, layout methods, etc. You will likely find the styles pane especially useful in this class! In Chrome and many other browsers, the "Styles" pane offers auto-complete features so you can learn more about different style attributes without referring to Google so often.
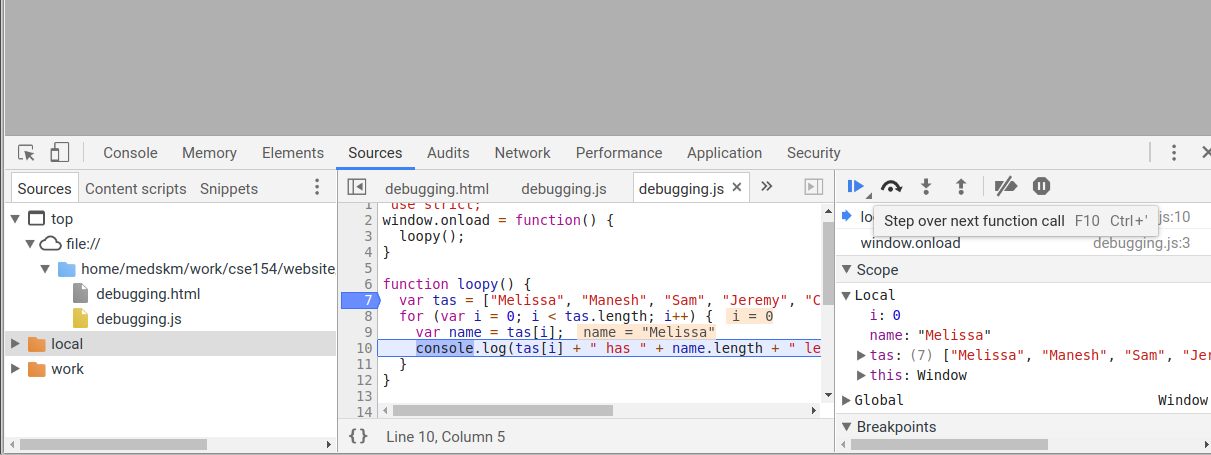
Debugging JS code in Chrome
Chrome's Web Inspector debugger can set breakpoints, step through code, examine values (Sources tab)
The interaction pane for typing in arbitrary JS expressions (Console tab; Sources tab with code and variable views)
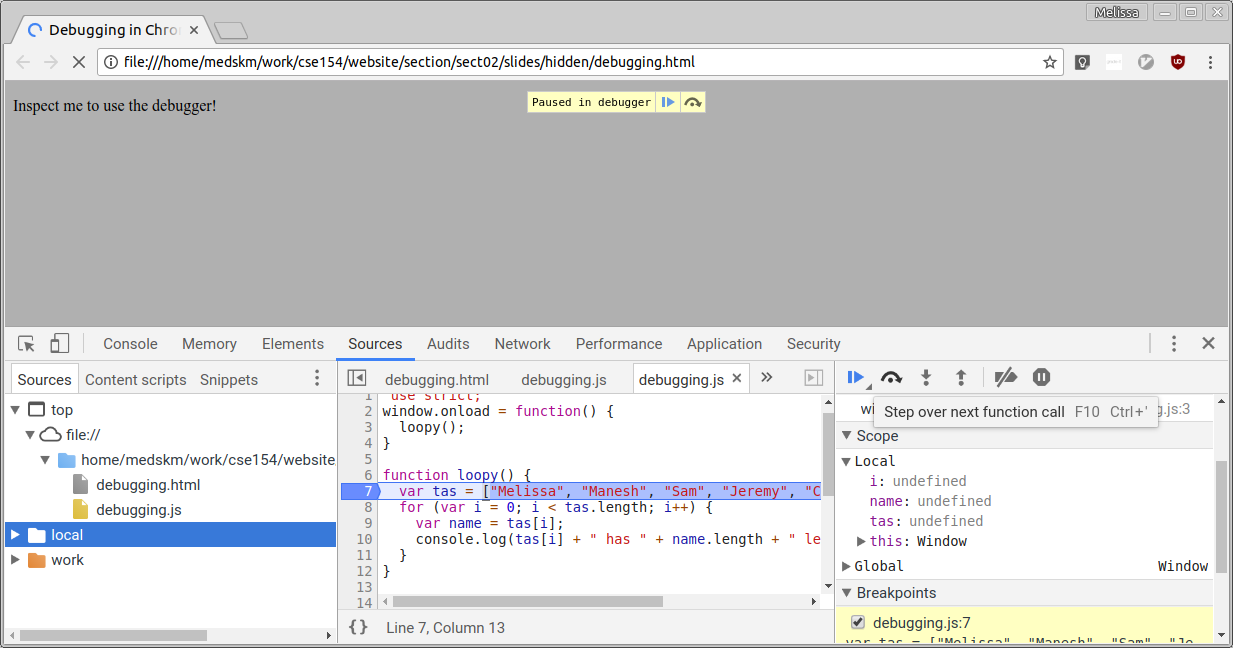
Debugging in Progress
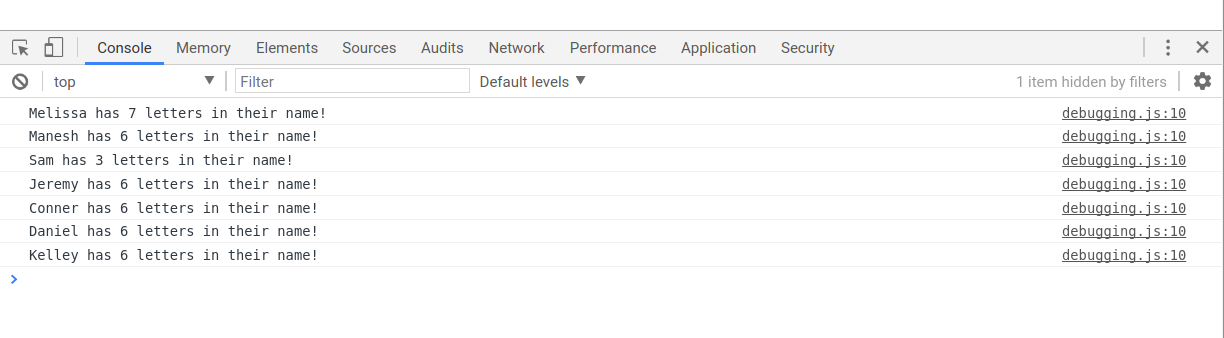
Debugging Finished
Debugging Checklist
-
Are you sure the browser is even loading your JS file at all?
Put analertat the top of it and make sure it appears. - When you change your code, do a full browser refresh (Shift-Ctrl-R)
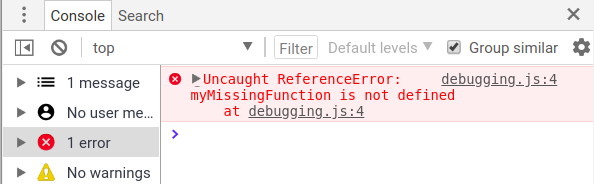
- Check bottom-right corner of Chrome console panel for syntax errors ->
- Paste your code into our JSLint tool to find problems.
- Type some test code into Chrome's console or use a breakpoint.
Final Words on Using Your Browser Development Tools
As you may find, there are many features offered by browser development tookits. Don't worry about understanding all of them - many you won't need to use in this class, and we'll introduce the ones that are helpful when we learn how to integrate JavaScript to add behavior to our webpages.
For now, focus on getting familiar with the Elements and Styles panes, and play around a bit! You may find some neat CSS styles along the way. Or try playing around with the JS debugger!
The more you use these tools the more comfortable you will feel with them!
Firefox Developer Tools
As a note, Firefox, Safari and other browsers have similar tools. Please see the associated documentation for those browsers' tools for more information.