Why Use it?
The VS Code debugger is a powerful tool that enables us to visualize and track what our code is doing line by line. It allows us to stop our code at certain points and check the state of the program. The debugger is one of the features that makes VS Code a much more powerful tool for programming compared to Ed.
While going line by line may seem tedious, it’s oftentimes the most certain way of ensuring we catch the bugs within our program. If we begin skipping lines, we can easily begin missing bugs unless we are absolutely certain that those lines of code do not cause any issues (and even when we’re sure, we sometimes made a simple mistake we overlooked!).
Something to note is that just because we use the debugger does not mean that we shouldn’t use println debugging! Println debugging alongside with the debugger can be very useful! Additionally, there will be a coding example of how to use the debugger along with our walkthrough or how we would go about using it at the end of the guide.
The Basics
Breakpoints
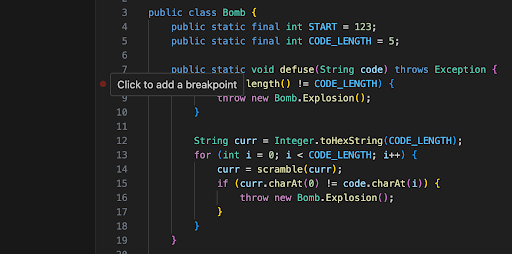
Place a breakpoint by hovering your mouse to the left of the line numbers. Click on any spot to add a red dot, which will mark a breakpoint
Breakpoints signify to the debugger where we want to begin going line by line in our program. Prior to hitting our first breakpoint, the code will execute like normal. Additionally, we can add multiple breakpoints to our program if we would like to make sure we stop at multiple locations.
To effectively choose where to place your breakpoints, we recommend starting broad! An important characteristic of the debugger is that you cannot go backwards once you have executed a line of code. Try placing your first breakpoint at the start of the method you want to investigate or even maybe at the start of your program. As you begin to get a better understanding of your program, you’ll get a better intuition of where the bug may be. As such, you can slowly begin narrowing down where you are looking with your breakpoints as you begin understanding your bug more thoroughly.
Running the Debugger
In the top right corner, you will find play button with a drop down option next to it. Click the dropdown option and then click Debug Java.
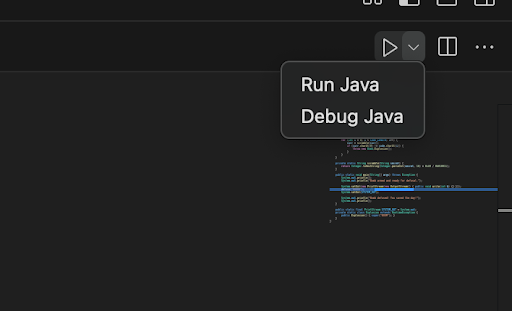
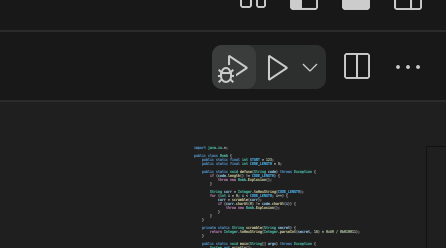
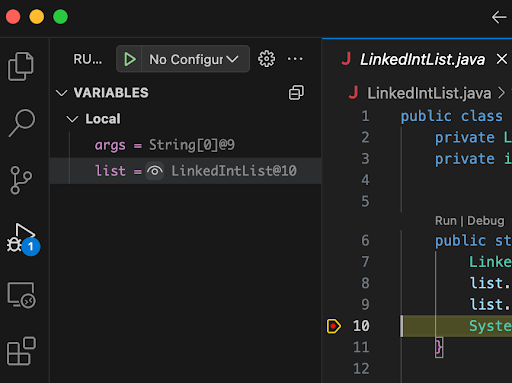
Additionally, if you see icons with a run button and a bug like this one, those will be associated with the debugger!
The Debug Toolbar
Once you have clicked Debug Java, the screen above will pop up. A highlighted yellow line will appear on the line that your code is currently on. This will usually correspond to the location of your first breakpoint when you have just started the debugger. Note that this line has not been run yet.
At the top, you will see the debug toolbar. This allows you to move throughout your code. Below, we will explain what each tool does: - Continue: runs the program to the next breakpoint, or to termination - Step over: Executes the highlighted line and moves onto the next line of code - Step into: Enters the highlighted method to follow its execution line-by-line. - Step out: When inside of a method, you can return to the caller method by executing all of the remaining lines. - Stop: Terminate the current program execution.
Tracking your Variables
Variables Tab
On the upper left hand side of the screen, you will find the variables tab. This will track all variables that are currently in the scope of the line of code being executed. Note that if some of the variables are objects, it may be useful to hit the dropdown/eyeball to find out more about the object and track their field
Watch
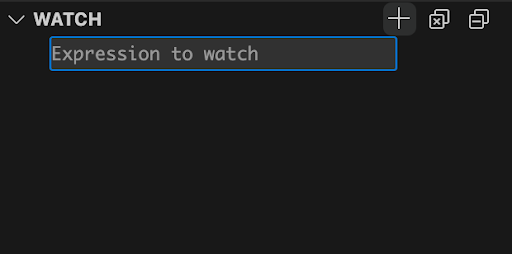
Just beneath the variables tab, you will find the watch. The watch enables you to add whatever expressions you would like to track. This can be anything from variables of interest to method calls and their results.
Additional Tools
A powerful tool that we can also use is the Conditional Breakpoint. Here, we can set a condition on which a breakpoint will halt the execution of our code. This is extremely useful for situations where a line of code is repeated many many times, and we don’t want to spend the time manually stepping over line by line when we know our bug only occurs on certain iterations.
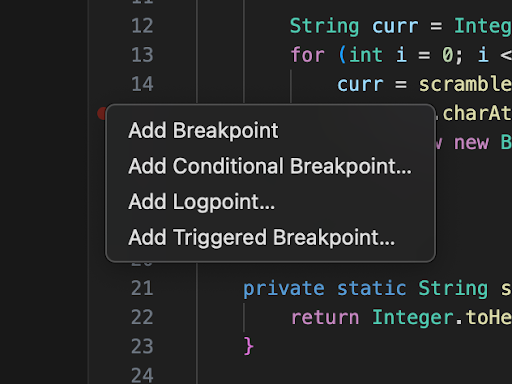
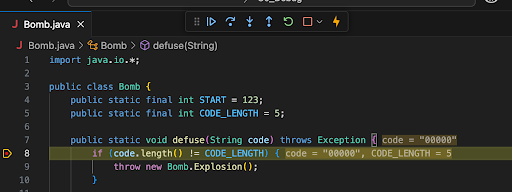
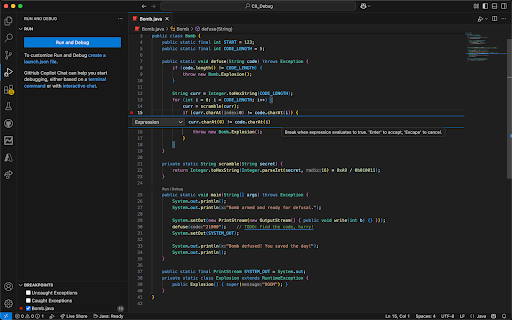
To do this, we can start off with the same process of creating a normal breakpoint. However, instead of left clicking, we can right click at a specific point to open the shown menu above. From here, select Add Conditional Breakpoint.
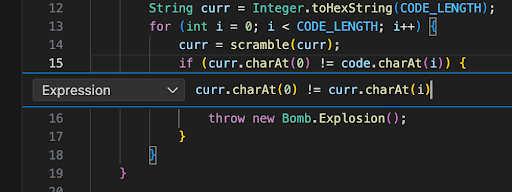
From here, we can add an expression that we want our code to halt the execution at. Once you are satisfied with the condition you have written, you can hit Enter to create the breakpoint. In the example above, we created a breakpoint that will only trigger once curr.charAt(0) != curr.charAt(i) is true.
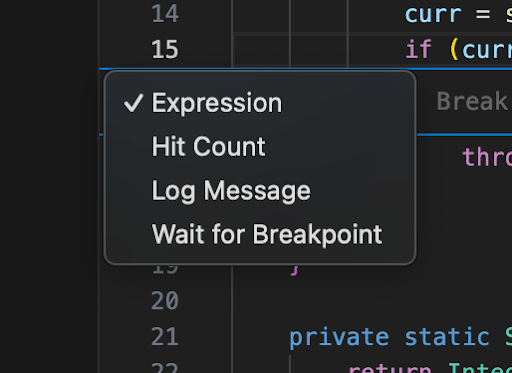
Note that there are other options other than “Expression” you can use to customize your breakpoints but we will not be covering them within this guide. If you are interested in finding out more, we highly recommend taking a look at the official documentation found here https://code.visualstudio.com/docs/debugtest/debugging#_breakpoint-types.
Walkthrough with the Bomb.java program!
Now that you’re familiarized with the debugger, you’re ready to begin using it to debug your first program! First, we highly recommend trying this out yourself! - You will learn a lot from messing around with the debugger and build your intuition on how to use this powerful tool! - Afterwards, take a look at the way we choose to use the debugger to solve this problem
You can find the download to the Bomb.java program here: debugger-exercise.zip
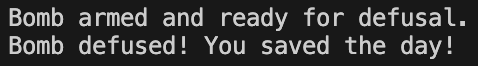
To start, we will want to first run the program to get an idea of what is happening. When the Bomb.java file is first run, we get the following message in the console
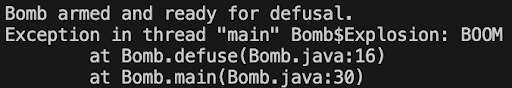
This message gives us a lot of insight as to where the error is occurring. We can see what caused the error (the Exception), the line number of where error occurred (Bomb.java @ 16), and the stack trace (which methods were called leading up to the error)
In this case, we can take a look at our main method and notice that everything before the call to defuse comes from standard libraries and does not affect our call to defuse in any way. Therefore, our bug is most likely in our defuse method so we will place a breakpoint at the beginning on defuse on line 8.
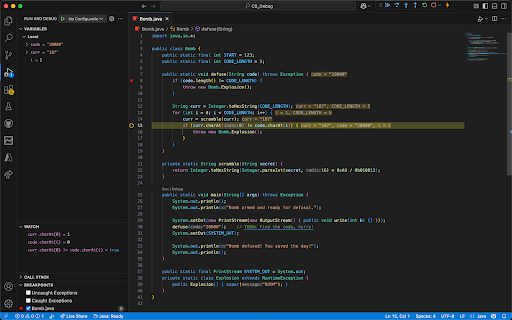
After hitting debug, the screen above should pop up. Line 8 should be highlighted in yellow, indicating that we are currently stopped at that line. From here, we can progress by stepping through our code.
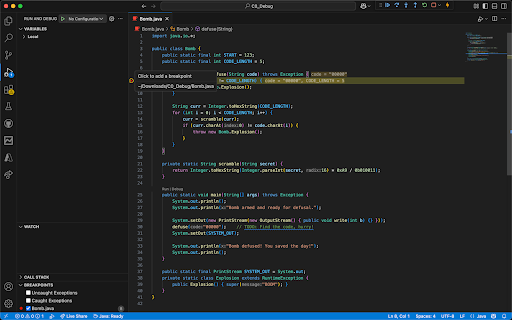
Let’s stop at line 15. At this point, we know that the line responsible for the error is line 16 which will only execute if the conditional on this line evaluates to true. Using the debugger, we can take a look at the current variables relevant to this conditional.
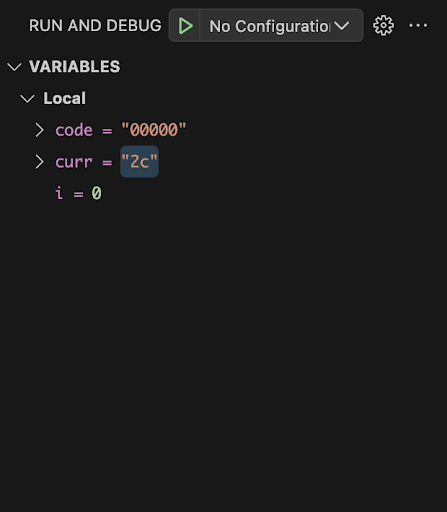
Let’s take a closer look at the variables. Here we can see that currently code = “00000” and that curr = “2c”. We can then reason out that curr.charAt(0) = 2 and code.charAt(i) = 0 and that these two values are not equal. Using step over, we can see that this is indeed the case as we move to line 16. Therefore, we can stop and edit the code passed into defuse to be “20000”. Now, let’s try running it again and stepping back through.
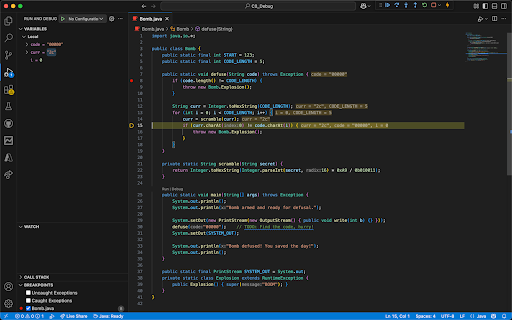
Hooray! We have successfully passed the first iteration of the for loop meaning we have solved our bug (notice how in the variables tab, i = 1 in this screenshot vs i = 0 in the previous)! The bad news? Continuing to step over our code reveals that we don’t pass the second iteration of the loop meaning we have a new bug.
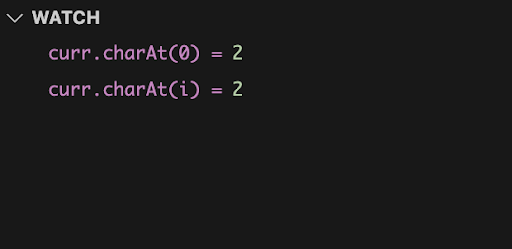
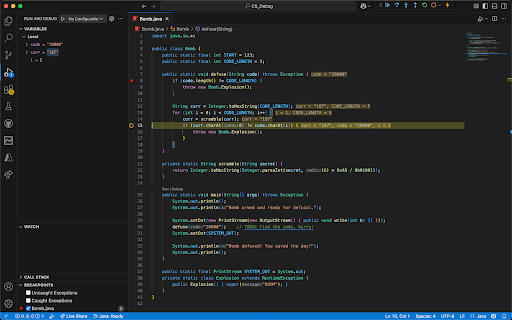
At this point, we know we have recurring issues linked to the if statement on line 15 so let’s begin adding important values to our watch. Here, we’re going to add curr.chatAt(0) and then curr.charAt(i) since these are the values being compared! We can also add the expression curr.chatAt(0) != code.charAt(i) to easily let us know if the conditional will cause an exception.
With our added watch values, we can quickly notice that the conditional will evaluate to true so we must edit the code! Additionally, we know that we want to make code.charAt(i) match curr.charAt(0) so we will change the code to become “21000”.
Additionally, at this point, we are very confident that we’re going to have more bugs linked with line 15 so let’s remove the breakpoint on line 8 and place it directly on line 15. Additionally, we know the exact condition that will cause our bug so let’s edit the breakpoint to have that condition. Now, instead of tediously stepping through our code, we can press run and only stop when we are about to have a bug.
Finally, by pressing run and changing the values in code to match those of our watch when we have issues, we can get that the correct code is “21d74”. When we run it the final time, we see that we never stop as we never enter the conditional and we have defused the bomb! Congratulations on successfully using the debugger and we hope this guide will be helpful on future projects!