All students enrolled in CSE 123 will receive free access to Ed. Ed comes with an online editor that lets you work on your assignment without having to download any software. However, we will still ask that you complete some software setup on your computer since there are a couple of downsides primarily relying on Ed.
- Ed requires internet access. You cannot work on your assignments on Ed if you don’t have a stable internet connection.
- Ed does not have a debugger. One of the skills we will be practicing this quarter is how to debug the programs we write. Without a debugger built-in to the software, debugging is much more difficult.
So in addtion to using Ed, we will ask that you install a editor named VSCode (Visual Studio Code) as another option for working on your assignments. VSCode is a fully-featured Integrated Development Environment (IDE) that is used by many professional software developers. The instructions below will explain how to install and set up VSCode for our course.
Install Java
Following the instructions here to install Java on your computer.
Install VSCode
You can get Visual Studio Code (VSCode) from https://code.visualstudio.com/.
Set Up VSCode
We strongly recommend you start by installing our profile file to get the cse12x settings configured automatically. It will enable and disable a number of features and plugins to try and make it a better first IDE experience.
NOTE: Some of these menus look slightly different on macOS vs windows. If you are on macOS you may need to access the menus via clicking on the gear icon on the bottom left.
Something not matching up with what you see? Let us know! Ideally tell us what step specifically doesn’t make sense on your machine, and give us a screenshot.
If you want to change settings later, you are welcome to do so.
Download the CSE13-Java settings
Found here: cse123-Java.code-profile
Macos
You may need to right-click and select “Download Linked File As…” 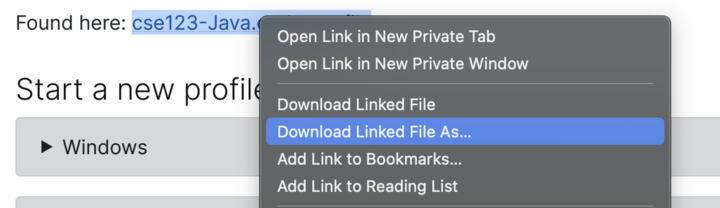
Alternatively, if you downloaded the file and Safari renamed it to “cse123-Java.code-profile.txt” you can rename it to “cse123-Java.code-profile”. This will not modify the content of the file, just change the name.
Start a new profile
Windows
In the VSCode menus: File->Preferences->Profiles->“Import Profile…” 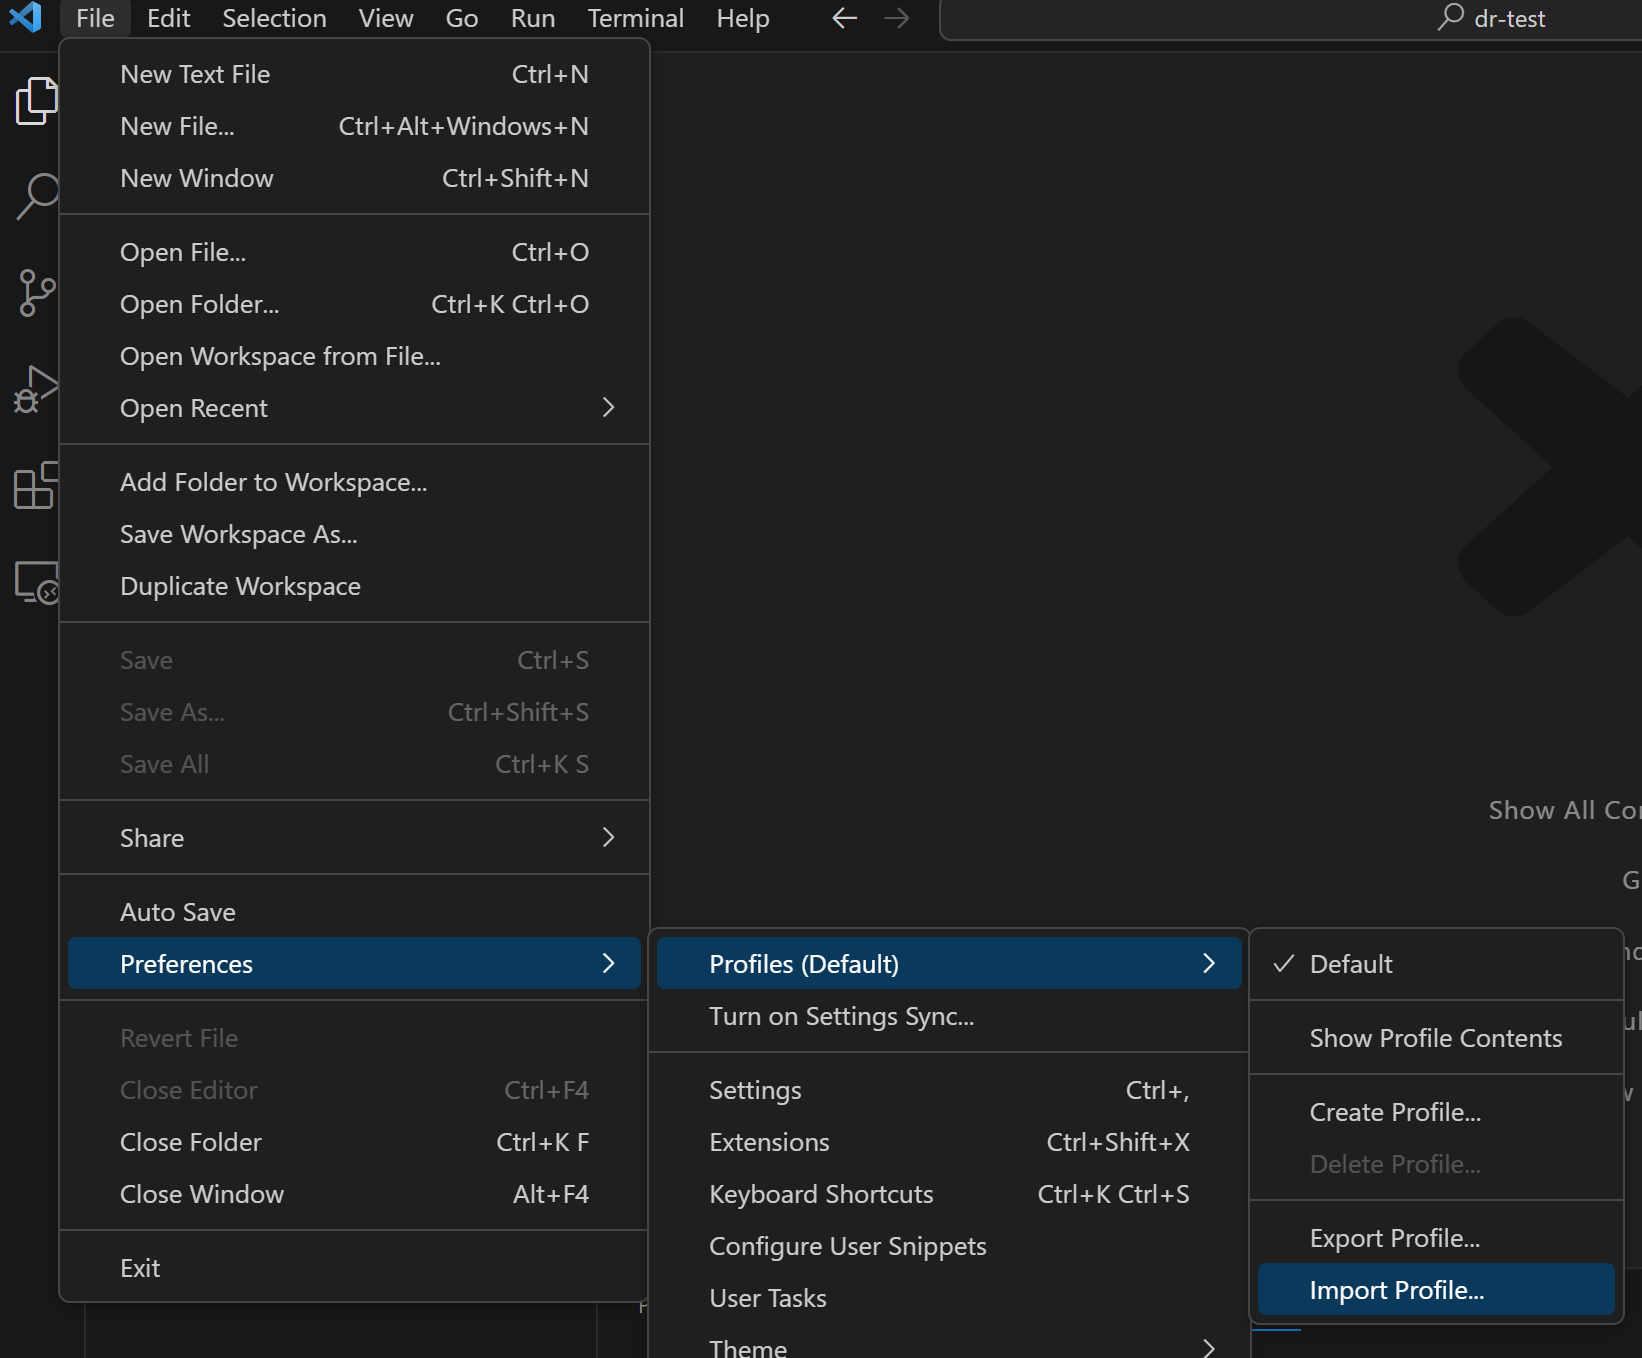
Macos
In VSCode: Gear icon on the bottom left->Profiles->“Import Profile…”
You may also find this via a menu at the top called “Code”. 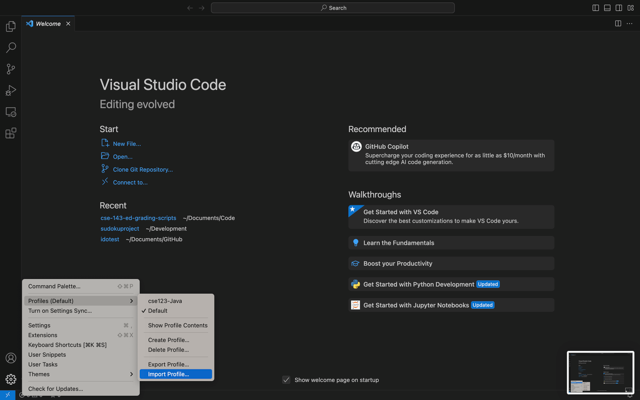
Open the file
Select the top option “Select File” (at the top of the screen). 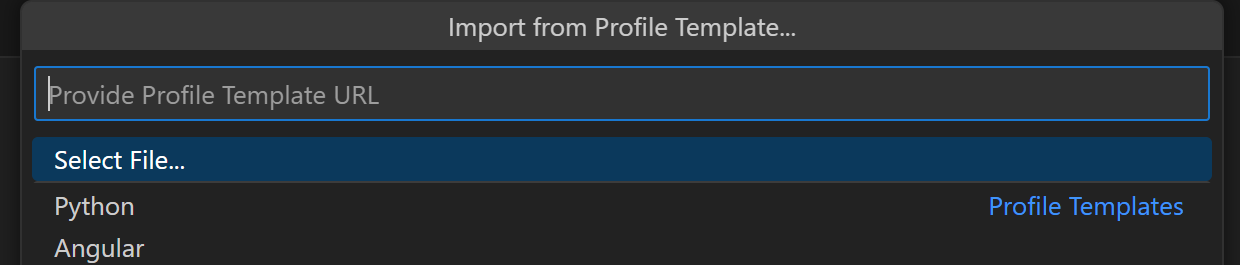
Select the file you just downloaded (cse123-Java.code-profile).
Create the profile
Hit the “Create Profile” button on the left. 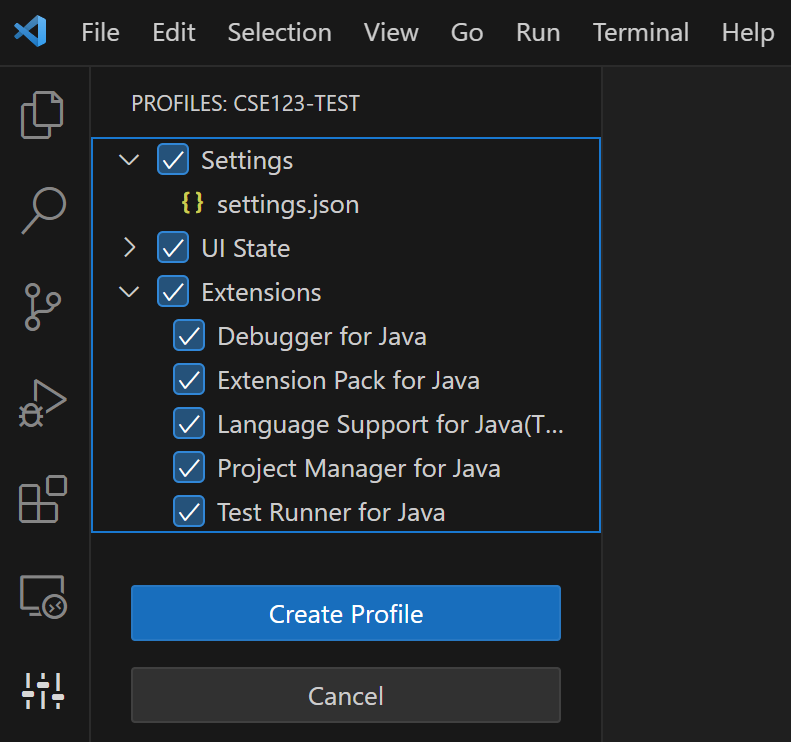
Name the profile “cse123-Java” and hit the “Create” button on the top. 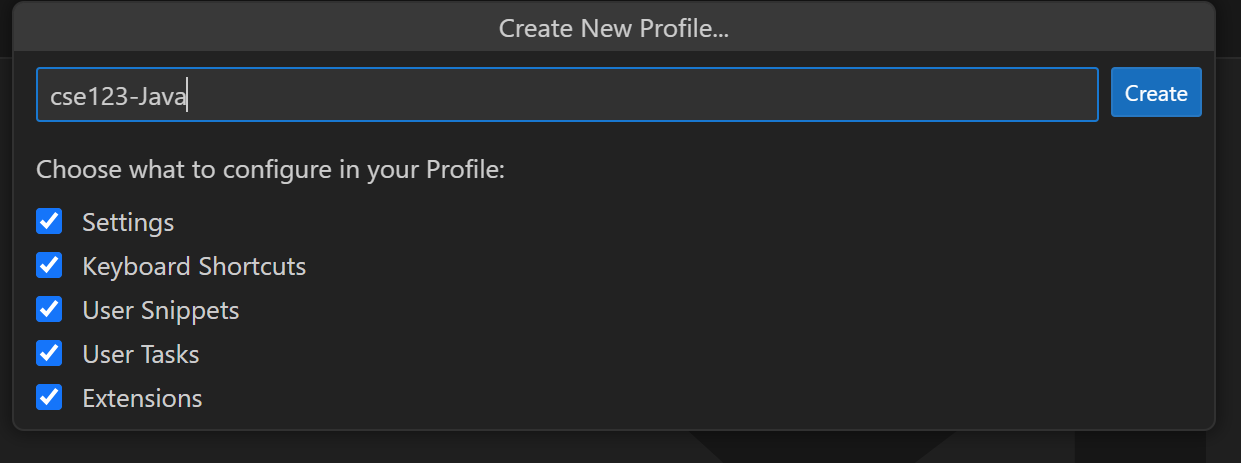
Done!
You can double check that it shows “cse123-Java” in the Profiles menu now.
Windows: 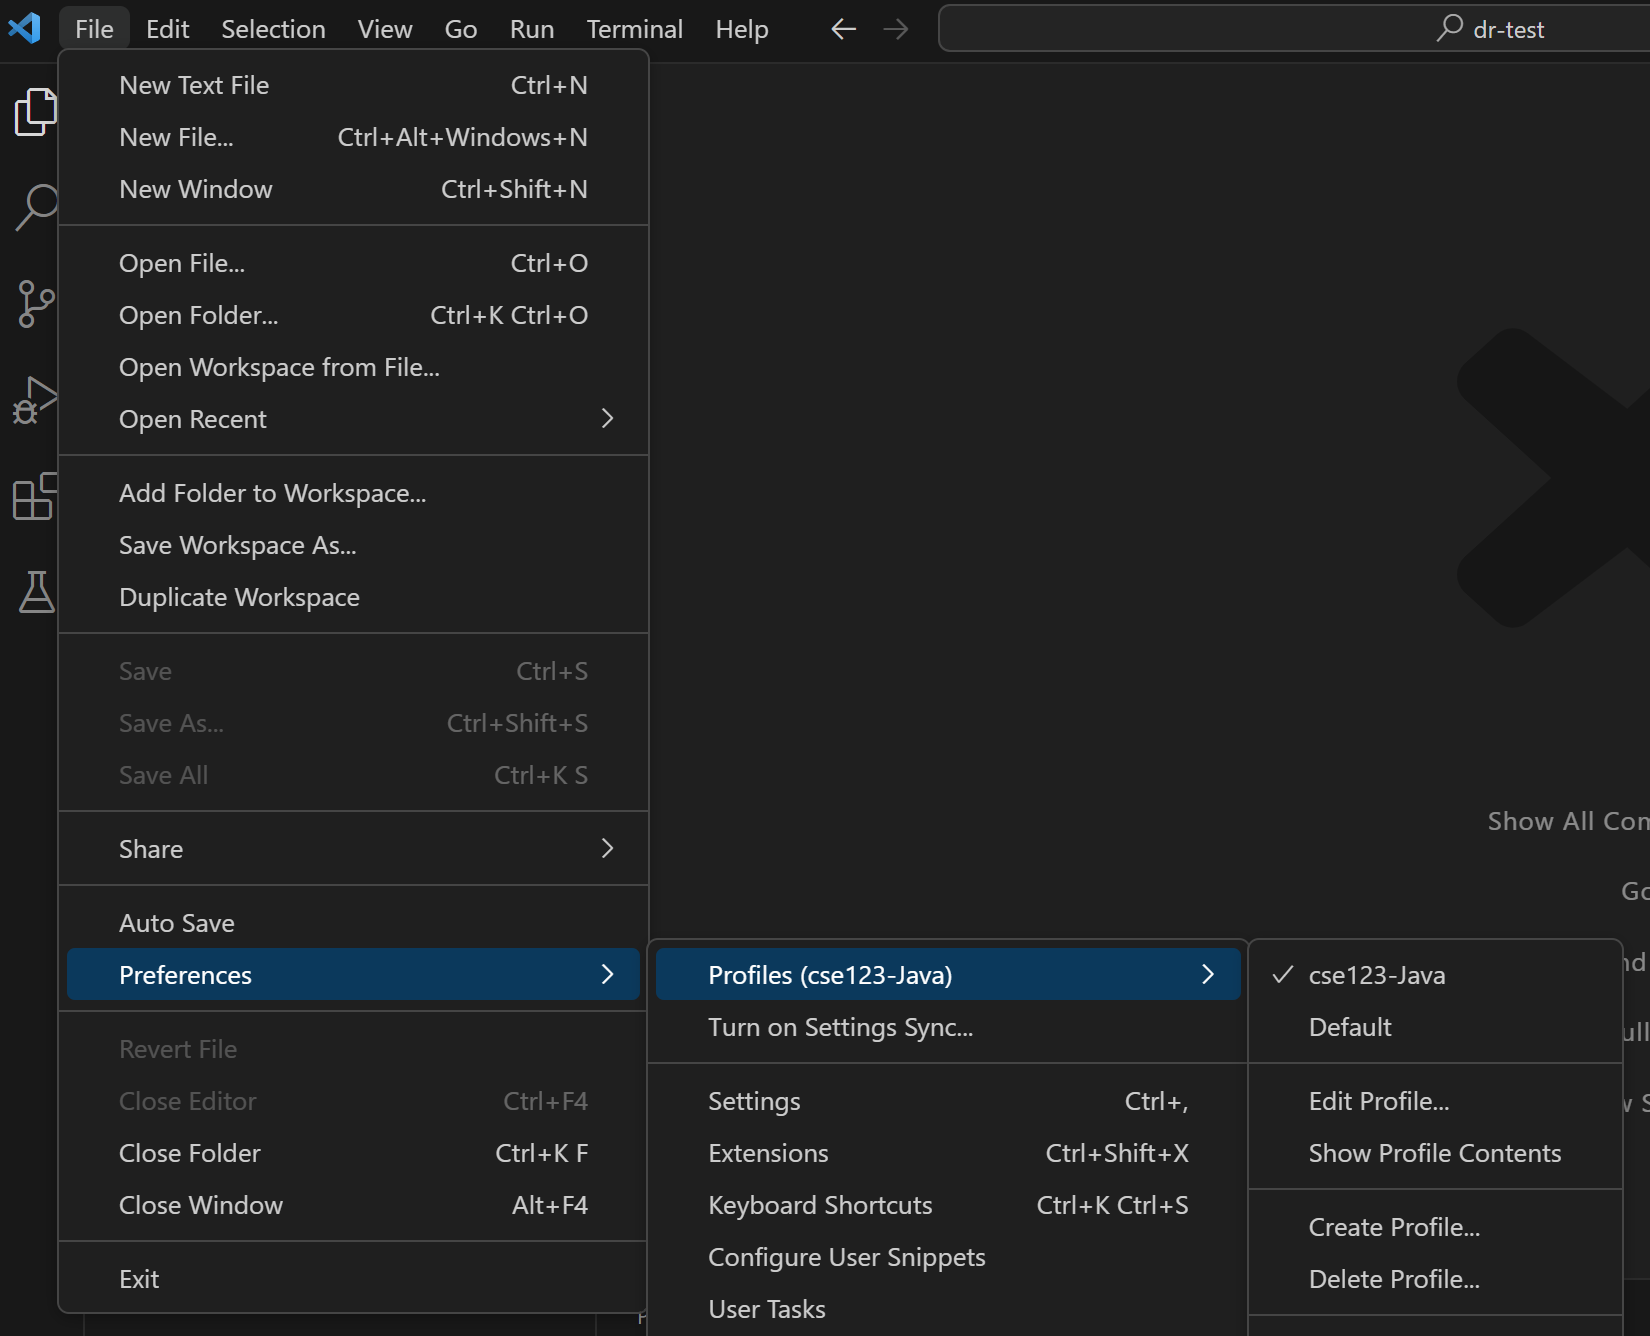
Mac: 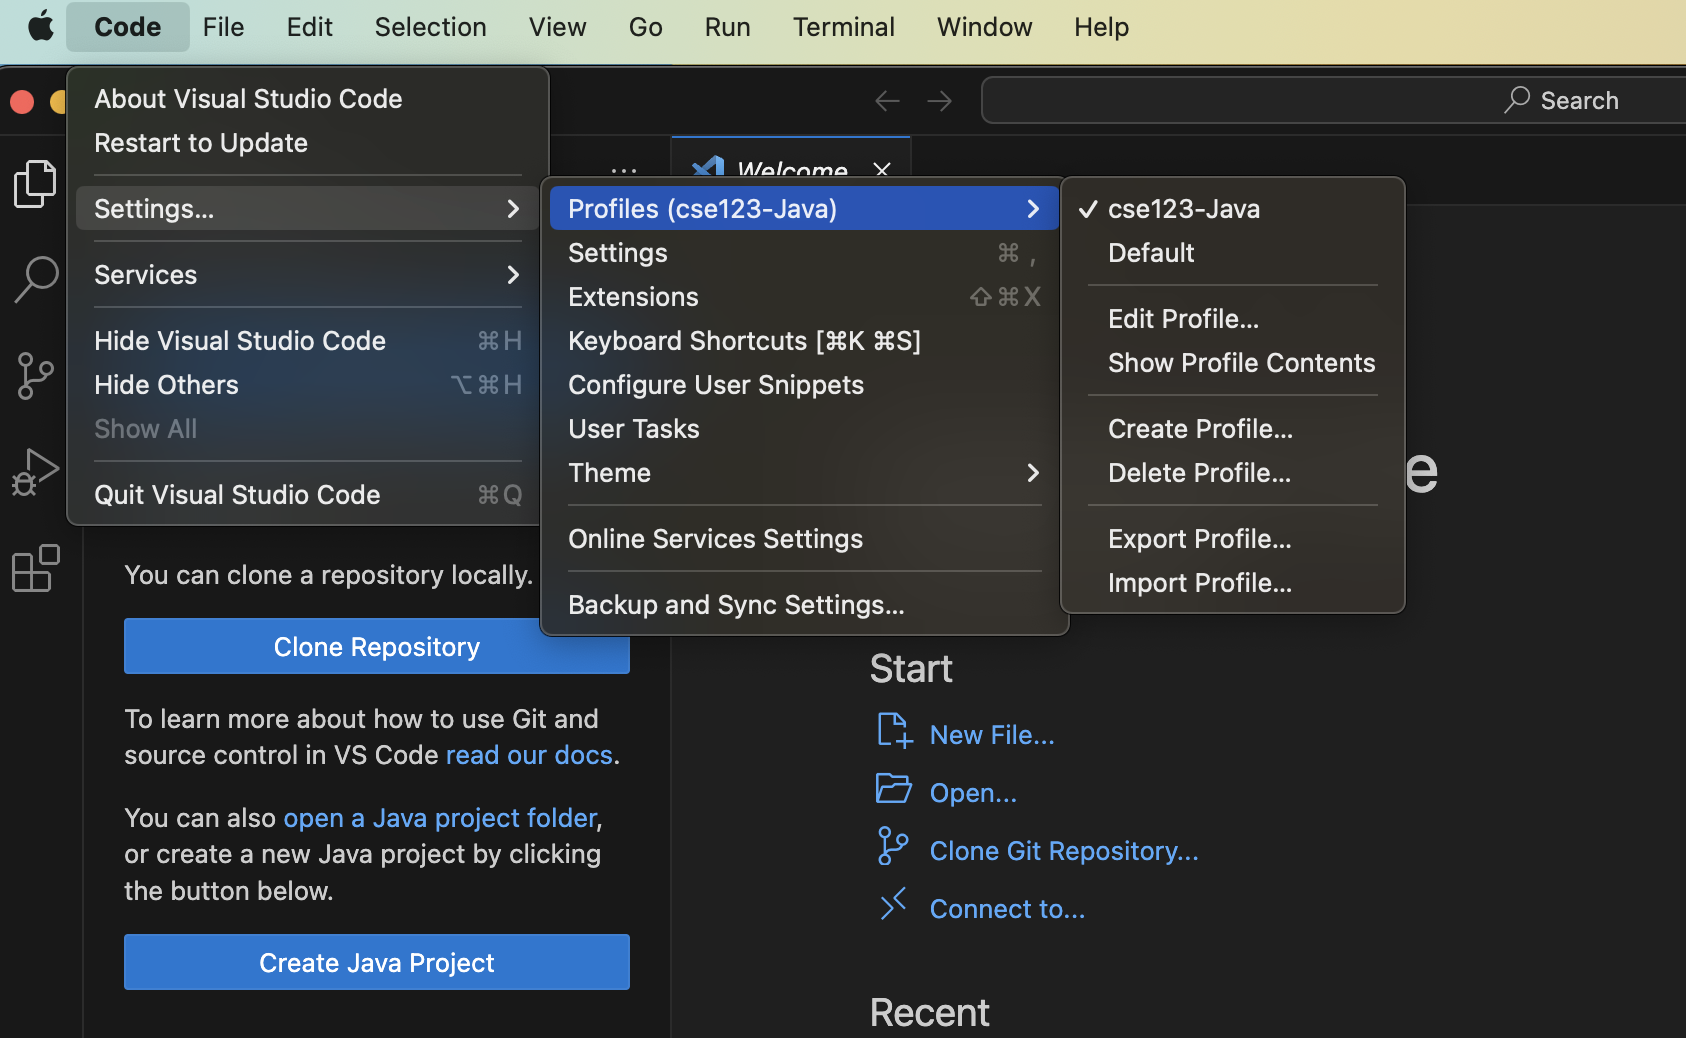
Running tests
JUnit testing functionality should be automatically installed within the 123 Java profile setup above. To actually run tests for a particular project, first locate the flask icon on your left bar (bottom-left corner of image below). 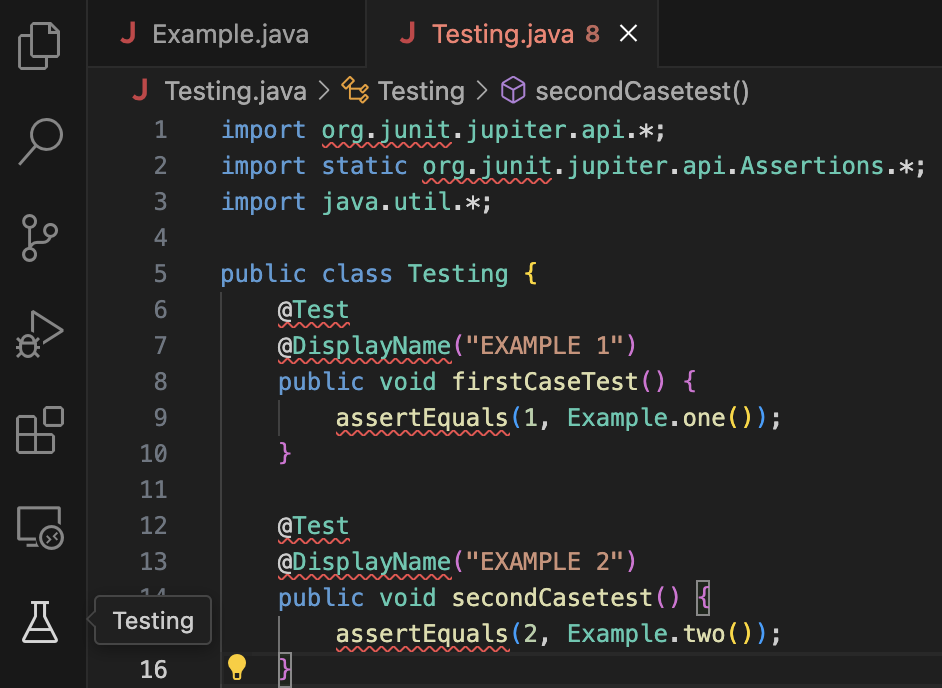 Clicking the flask should bring up the following menu. Click the “Enable Java Tests” button
 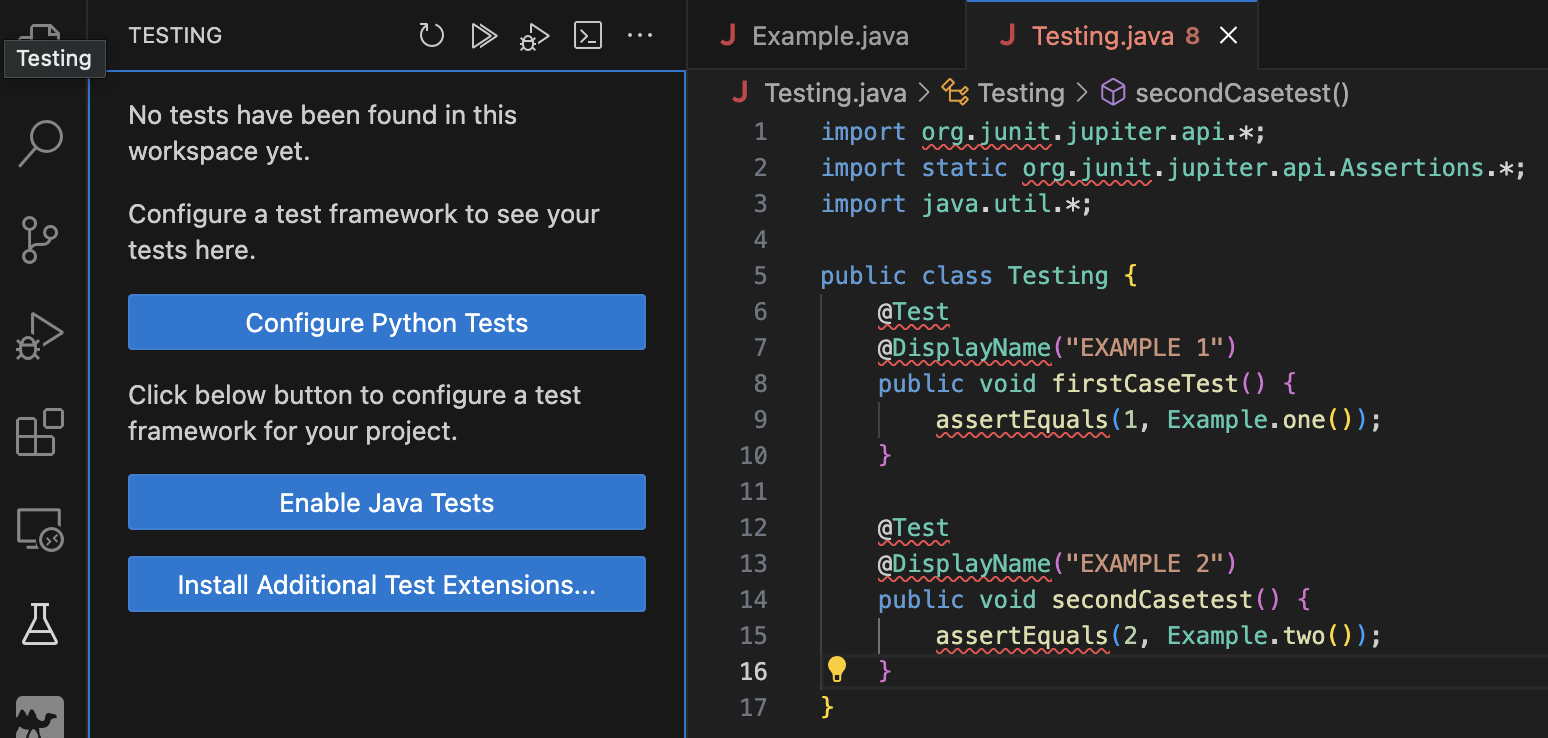 The following popup will appear at the top of your screen. Select the JUnit Jupiter default option
 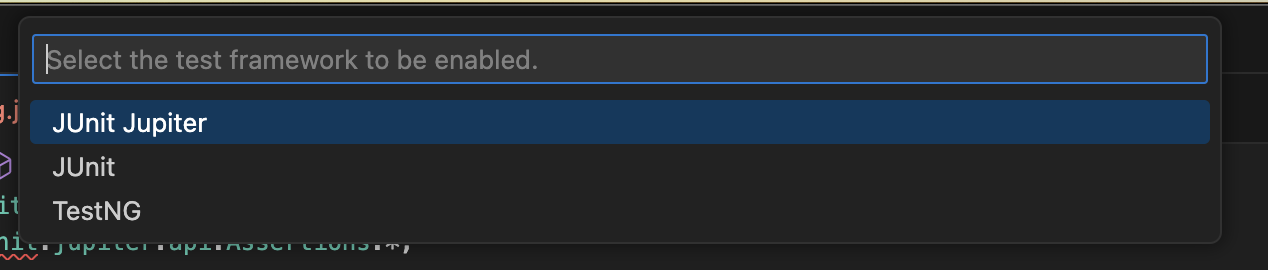 At this point, VSCode should be able to understand the imports and annotations within your testing file (no more red squigglies)! You’ll also see a testing menu on the left side of your screen.
 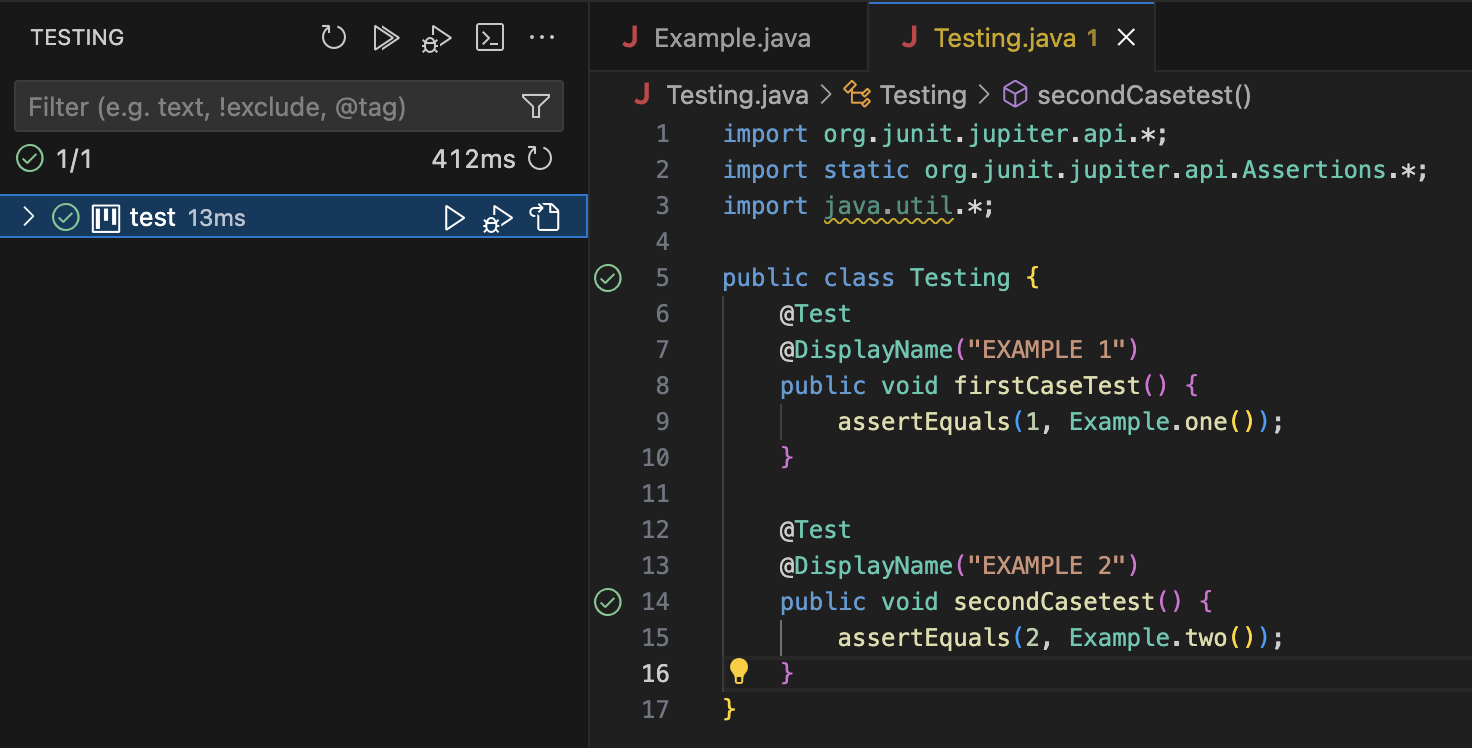 Expanding out the dropdown within the testing menu will show individual testcases marked with the @Test annotation. You can run all / specific tests from this menu via the play buttons that appear on selection.
 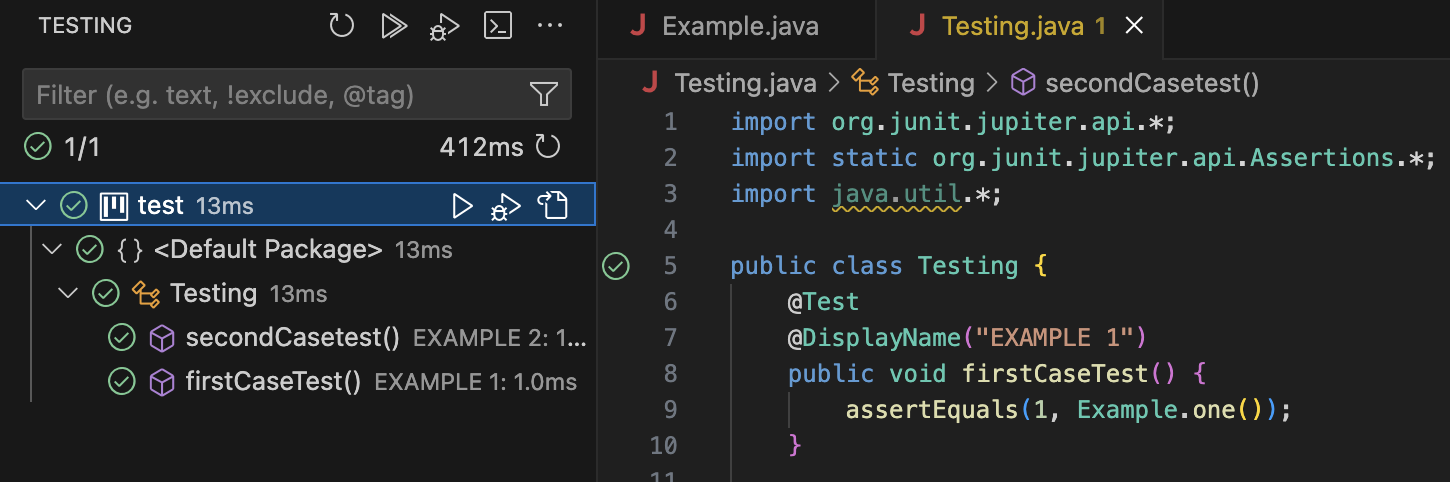 Alternatively, you can run individual tests via the green play / checkmark buttons that appear to the left of a specific testcase!
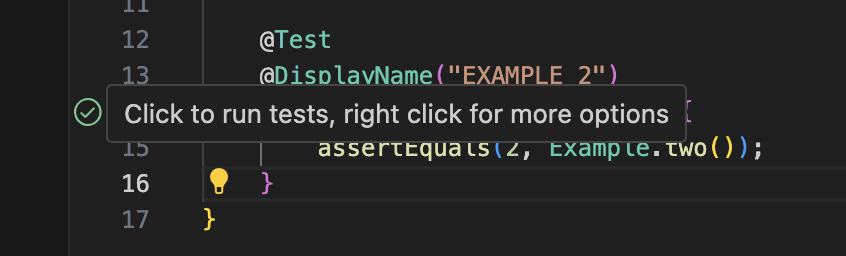
Accessing the debugger
The VSCode debugger is a powerful tool that we recommend you leverage when working on assignments. First, you’ll need to set a “breakpoint”. This is a line of code that the debugger will stop before executing. You can add a breakpoint by hovering to the left of the line numbers within your VSCode editor (you should see a translucent red circle appear). 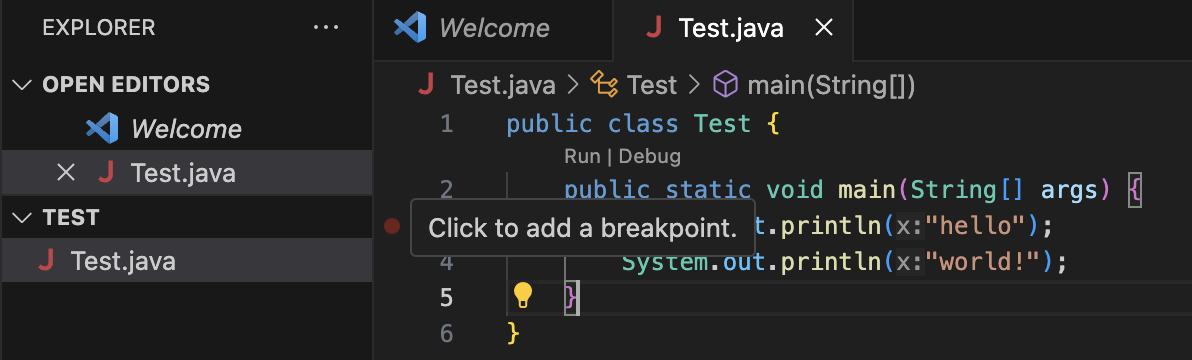 Once a breakpoint is added, a bright red circle will remain at the appropriate location. Note that you can add multiple breakpoints if you want to stop at multiple different locations.
 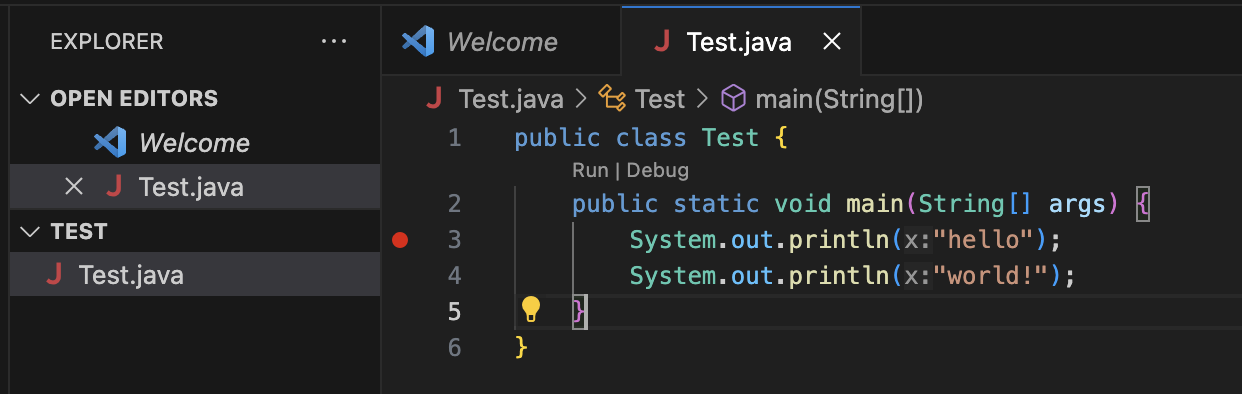 At this point, you can start debugging! This can be accomplished by hitting the “Debug” button above the program’s main method, or by navigating to the “Start Debugging” button under the “Run” menu in VSCode (mac version shown below).
 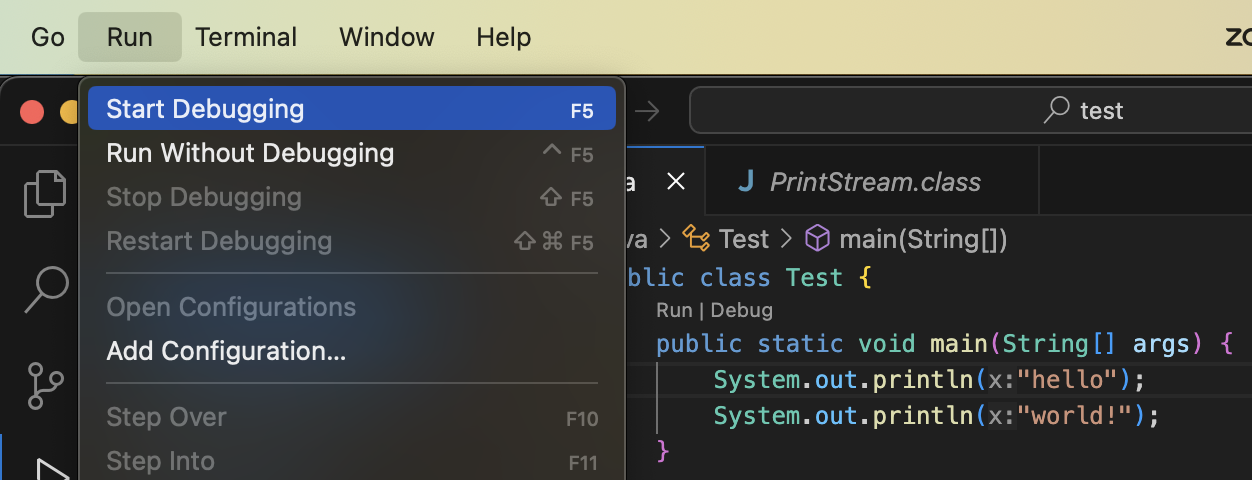 Once you’re in the debugger, the line that hasn’t yet been executed will be highlighted in yellow, and a menu with 6 button s will appear. Variables will be shown on the left, and will change as you step through lines.
 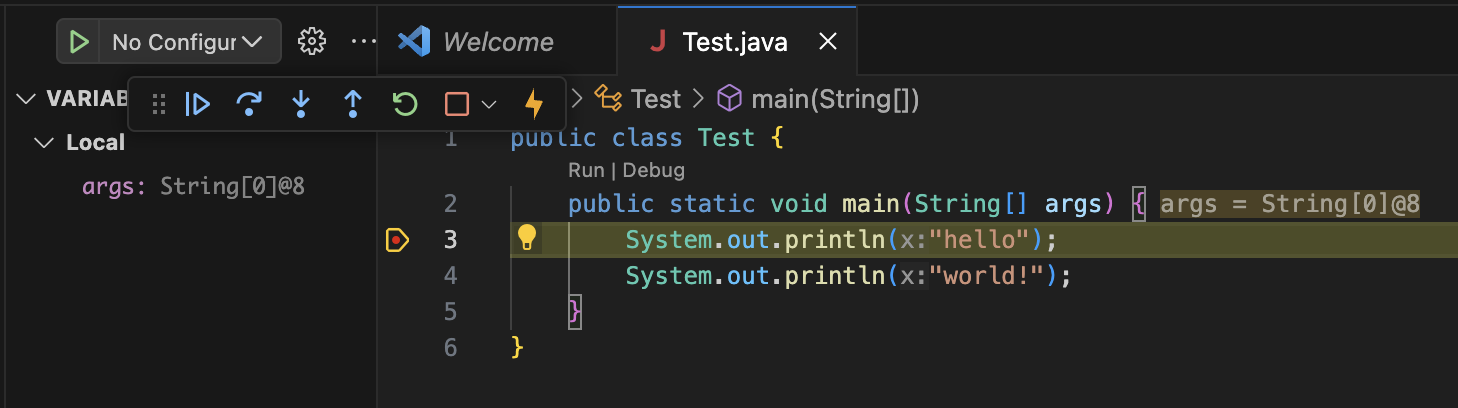 From left to right above, the menu buttons are:
- Continue: Resumes execution until the next breakpoint is reached.
- Step over: Continues to the next line of code in the current file. This will execute an entire method call at once.
- Step into: Steps into a method call if the current line has one.
- Step out: Finishes executing the current method and stop after returning to the caller.
- Restart: Restarts the debugging process, running the code from the beginning and stopping at the first breakpoint
- Stop: Stops the debugging process.
Starting working on a project
Download the assignment and unzip it. You should now have a folder with “.java” files in it, and possibly a directory called “/libs”
In VSCode: “File->Open Folder” and select the folder containing the .java files.