Goals
- Additional practice with arrays.
- Create a visual representation of data, meaning "information that has been abstracted in some schematic form." (citation)
Setup
The data for this lab can be found in the following three CSV ("comma separated values") files:
Once you have created a new .pde file for this assignment, make sure to save a copy of these files into the same folder.
Note: if you find later that you have an interest in doing a data-related final project, you can find some interesting data sets at this website. Make sure to talk to a TA about importing the data into Processing.
Birthday Visualization
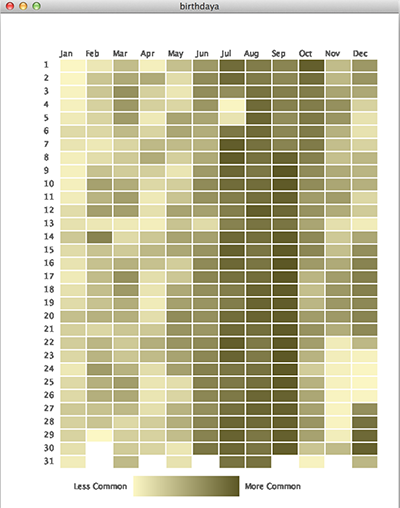 We will create a visual representation of the popularity of birthdates, that is, what is the ranking of each date of the calendar year, based on number of actual births on that day (irrespective of year).
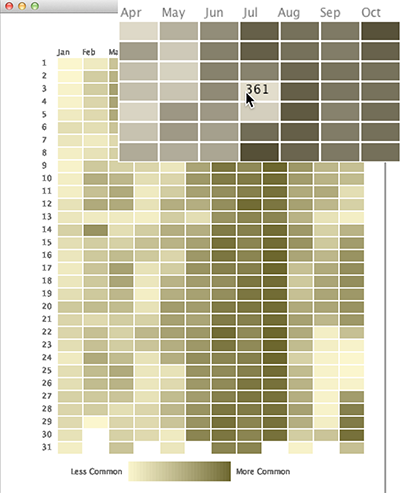
We will then augment our visualization by displaying the actual ranking number when the user hovers the mouse over an individual day.
Step 0: Data Storage
Declare three int arrays at the top of the program named month, day, and rank.
There are 366 days possible dates in the Gregorian calendar (February 29 is not always there, but is still some people's birthday!).
Each array will contain an entry for every possible date (i.e. each array has 366 elements):
month[i]returns the month (Jan = 1, Dec = 12) of that dateday[i]returns the day of the month (1-31) of that daterank[i]returns the frequency ordering (most common birthday = 1, least common birthday = 366) of birthdays on that date
Now we need to populate these arrays with our data.
Step 1: Importing From Files
Take a peak inside the CSV files using a text editor (not Excel). There's nothing special there -- just a bunch of numbers separated by commas. Imagine doing this assignment by hand! Computers can really help us organize and process the large amounts of data that we now regularly produce.
Declare a variable String[] temp at the top of your program.
This will be used to hold the raw data that you import from the files.
The code below should go in setup() and will read the month data from the CSV file into your array:
temp = loadStrings("month.csv");  // read file data into array of Strings
month = int(split(temp[0],','));  // convert 1st line of file (temp[0]) into integer array
Add code to similarly read the day and rank data from files.
Check the numbers to verify, remembering that arrays are indexed starting from 0:
month[1] = 1,day[1] = 2, andrank[1] = 362, meaning that Jan. 2 is one of the least common birthdays.- Valentine's Day (Feb. 14) is index
i = 31+14-1 = 44, somonth[44] = 2,day[44] = 14, andrank[44] = 103.
Step 2: Date Grid
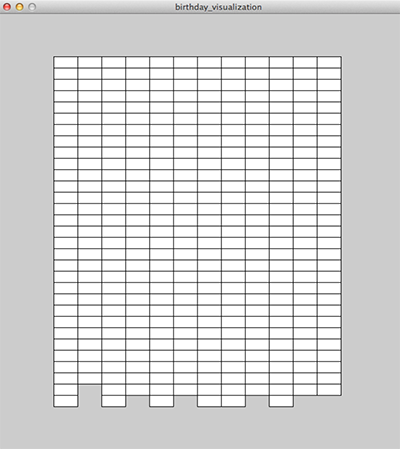 Write a function that displays the (roughly) 12x31 grid of rectangles seen on the right that corresponds to the days of the year, one column for each month.
The image shows rectangles of size 38x18, but feel free to customize this.
Write a function that displays the (roughly) 12x31 grid of rectangles seen on the right that corresponds to the days of the year, one column for each month.
The image shows rectangles of size 38x18, but feel free to customize this.
It is tempting to generate a full 12x31 grid using nested for-loops and we actually encourage you to do so initially to verify your rectangle generation calculation.
However, it's not actually a full 12x31 grid!
Think carefully about how to create this grid using a single for-loop (hint: it will involve month[] and day[]).
Step 3: Encode Frequency Information as Colors
We will use a color range to encode the frequency information so that the data is more easily understandable. We create a key at the bottom by drawing a gradient as 160 vertical lines, using something similar to the following code:
for(int i=0; i<160; i++) {
   stroke( 252-i, 247-i, 197-i );     // set color going from light (low i) to dark (high i) from left-to-right
   line( 200+i, 700, 200+i, 700+30 ); // draw vertical line
}
Feel free to customize as you please:
- The gradient is currently positioned with the upper-left corner at position (200,700).
- The gradient currently has height 30.
- The gradient goes from
color(252,247,197)(light) tocolor(252-159,247-159,197-159) = color(93,88,38)(dark).
Modify your grid-making function to fill the rectangles of the date grid with color based on the rank value by calling fill() before the call to rect().
Because the rank covers a range of 1 through 366 while the color range is only 0 through 159, we need to find where in the spectrum the rank falls.
So we multiply the rank value by 160 and then divide by 366 to "condense" the rank range.
Note: for reasons we won't get into here, make absolutely sure that you do the multiplication first before the division.
If you are not convinced that this work, try the top (1), middle (183), and bottom (366) ranks to see where they fall along the color range. Also make sure that the coloring matches your gradient (Jan. 1 is uncommon).
Step 4: Text Labeling
We need to label the rows, columns, and gradient bar so that others can understand your infographic!
The code snippets below will help you, but note that you will need to replace the ellipsis (...) to complete the statements as well as change the positioning to match your display.
Note: it may help to explicitly set the fill() for your text.
Label the column headings all at once:
text("Jan Feb Mar ...", 90, 65);
Label the rows using a loop:
text(i+1, 65, 82 ...);
Label the ends of the gradient with text similar to "Least Common" and "Most Common".
Step 5: User Hover Display
 We want to print out the ranking data when the user hovers the mouse over a rectangle, but this is probably too complex to safely program all at once.
We will build up to the full functionality, testing different parts along the way.
We want to print out the ranking data when the user hovers the mouse over a rectangle, but this is probably too complex to safely program all at once.
We will build up to the full functionality, testing different parts along the way.
display_values() function
Write a function named display_values() that is called from draw().
This function should declare two integers m_index (for month) and d_index (for day) as the first two lines inside of the function (this is different to our usual rule of putting variable declarations at the top of the program).
Based on the mouse position, these two variables should store the month (1-12) and day (1-31) indices of the box the user is hovering over. This calculation will involve: the starting point/corner of your grid of rects, the length and height of the rects, and any space between those rects.
It will likely help to test that your code is working by using the lines below after you define your variables. Make sure the numbers that it is printing matches where your mouse is on the screen.
Note: it is fine if it give bogus indices for non-existent days such as February 30th.
println("month index: " + m_index);
println("day index: " + d_index);
As you move the mouse to the edge of the drawing canvas, you will notice that some of the values are nonsensical, like -1 and 33.
Because we only want values that are in the table range, enclose the println() calls in an if-statement verifying that m_index and d_index are "in range".
Finding the Rank
To print out the rank of a birthday, we need to know where it is in our list of 366 items in rank[].
Our problem is that each month has a different number of days, so we cannot just multiply it out like we did the pixel position in the Color Checker assignment.
We solve the problem by creating a new array of 12 items that holds the index of the beginning of each month:
int[] dayTotal = {0, 31, 60, 91, 121, 152, 182, 213, 244, 274, 305, 335, 366};
Use this new array to calculate the correct index to access rank[] with.
Don't forget to account for the zero-indexing of arrays.
It is recommended that you verify your calculation using a println() statement.
Display the Rank
If your index calculation is correct, then the last thing to do is to show the rank on the drawing canvas at the tip of the mouse:
text(rank[ ... ], mouseX, mouseY);
Make sure to replace the ellipses with your index calculation.
Contrasting Text
Because the rect fill color ranges from light to dark, using the same text color while hovering will be difficult to read for some dates.
Set the fill() for the text using an if-statement whether the user is hovering over a "light-enough" rank or a "dark-enough" rank.
Step 6: Bug Fixes [OPTIONAL]
The infographic is nearly perfect. However, it still displays hover text for non-existent dates (e.g. Feb. 30, Apr. 31).
Can you figure out where these "phantom" numbers are coming from? Can you explain this behavior?
Figure out how to fix this behavior so that the hover text doesn't show in these situations.
Submission
- Make sure that your name (and your partner's name) is included in your file.
- Make sure that most of your lines of code have comments so that someone else can understand it.
- Make sure that the hover text is visible over both light and dark rectangles.
- Submit your finished
.pdefile from Step 5 (or Step 6) to the Canvas assignments page.