As would be expected in any first week of a college course, the lecture time was divided into covering administrative details, and giving a broad overview of the course. Below are notes from that overview; for administrative details, see the course web page.
Input need not necessarily come from the user directly. There are also scanners that can convert a picture or photographic slide to an image; 3D scanners that can determine the 3D geometry of an object; frame grabbers that save an image from a video stream.
model => view transform => clipping => hidden surface removal => shading => scan conversion
Chapter 14 in Foley, van Dam, Feiner, and Hughes discusses rendering.

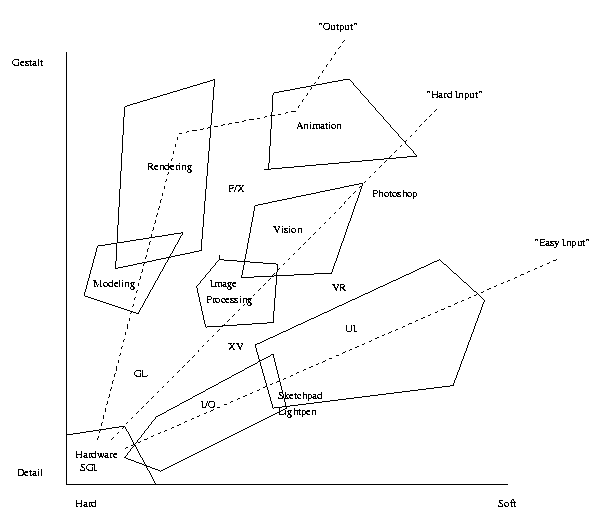
Craig, AJ, and Doug tried to show the relations between areas of computer graphics by placing each topic in a two dimensional space. On the vertical axis the group measured the detail level that the topic was concerned with (i.e. level of 1/0 vs.the big picture). The horizontal axis measured how "hard" the topic is or how concerned with accurately portraying visual reality the area is. Some applications were placed in the 2-D space as concrete examples.

This figure contains only a subset of the arrows this group found when trying to create a dependence graph of the relationships between areas in graphics. This quarter of the class realized that filling in all the arrows would create a complete (or almost complete) graph.
They then focused on categorizing graphics by what it means to different people. For example, an engineer might use computer graphics for modeling.

Ben and his friends created a table showing that computer science binds fields to graphics topics. For each topic in computer science the group showed which field of knowledge it used.

Owen and Andy chose to decompose the world of computer graphics by the applications which each entity serves. At the highest level, the applications are either for utility or for aesthetics. Examples of applications for utility would include simulators, drafting or CAD systems, and computer vision applications. Functions for aesthetics tend to be "closer" to some end-user, and more artistic. Examples of these applications include games, artwork, and movies.
Besides being decomposed by area of application, we can see how each of these applications are related to the fundamentals and tools of computer graphics. Associated with each application in the diagram below are the initials of the tools or fundamentals which each application calls upon.

Corey, Jeremy, and Josh proposed to decompose everything in computer graphics either as an element of a Basic Group, or as a trio of elements of the three Basic Groups. The Basic Groups are Purpose, Function, and Data/Info. Examples of individual elements of these groups are given in the diagram below.
Individual objects in computer graphics can usually be classified as members of a single Basic Group. A 3D mathematical model of a horse, an image of a Mandrill, or a sequence of mouse clicks all belong to the Data/Info group. Algorithms, such as morphing, rendering, edge detection, and Gaussian blur are all members of the group Function. Purposes would include, Art, Scientific, Education, etc.
Higher-level entities in computer graphics can be described by the objects from each Basic Group, and their intergroup links. For example, a short video of one face morphing into another would be characterized by the Function morph, the Data/Info Images, and the Purpose Art, or Education. To determine the 3D model of a medical patients brain, a doctor would call upon the Purpose scientific, the Function CATto3D, and the Data/Info Images (from the CAT scanner).
