
|

CSE 427, Wi '21: Assignment #1, Due: Friday, 1/22/21 |
|
 CSE Home CSE Home |
About Us |
Search |
Contact Info |
Reading: See Schedule page. I recommend you do the bulk of the reading before class on 1/14.
Homework:
In this assignment, you will implement Smith-Waterman local alignment, scoring, traceback, and empirical p-value calculation. (I haven't covered all of the relevant material yet, but will this week, and there's stuff you can do already.
Background - FASTA Format: This is a simple, commonly used file format for nucleotide or protein sequences. The gist is that a sequence is represented by single description line, marked by a '>' character at its beginning, followed by one or more one or more lines of sequence data. The description line is effectively all a comment, but for the data we will look at, each contains a concise unique identifier that will be convenient for purposes of labeling and printing results, namely the 6 character string following the '>sp|' (see examples below). The nucleotide or protein sequence follows the description, coded using one character per position in the sequence. Typically, long sequences are broken across multiple lines with 60 - 80 characters per line. For this assignment, assume you are given 2 or more such sequences in one file; the i-th sequence ends at the i plus first '>' or end-of file. Treat lower and upper case letters as equivalent; ignore (delete) characters, including whitespace, that are not valid amino acid codes. See this for the codes and more information about FASTA format. Here's a simple example, containing 3 sequences:
  >sp|myseq1| a short made-up protein
  DEADLY
  >sp|P68871| (part of human hemoglobin beta)
  QAHCAGVITALNNVIDFLHDPGLMEASLIGLVERHKKRGQTKEEFQNLKEVMLEVLRQAF
  GKEFTPPVQAAYQKVV
  >sp|myseq2| another made up one
  DDGEARLYK
Preparation:
Download the BLOSUM62 scoring matrix from NCBI or the online supplement to:
(In a PubMed abstract, you usually click the journal's icon to get to the article. In this one, the link to the supplement is near the end of the "full text" version, and the BLOSUM62 table is near the end of the supplement.)
Ignore/delete the B, Z, X and * rows/columns; they are various wild-cards.
Download the amino acid sequence (in FASTA format) for each of the following
proteins and save each as a file named <accession>.fasta as follows. Go to ExPASy. Go to the primary page for each protein by pasting the name or
accession into the search box near the top of the ExPASy home page, select UniProtKB in the pulldown to its left
(labeled "Query All Databases" by default), click Search. Click the link labeled by the accession number to
get to the details page. Download the sequence using the "FASTA" link under "Sequences" part way down the
page.
Some of the proteins may have multiple sequences listed on their UniProt page; if so, just download the first one listed. (FYI, these so-called "isoforms" are variants of the gene that arise, typically from alternative splicing.)
| Species | Name | Description | Accession | |
|---|---|---|---|---|
| 1 | Homo sapiens (Human) | MYOD1_HUMAN | Myoblast determination protein 1 | P15172 |
| 2 | Homo sapiens (Human) | TAL1_HUMAN | T-cell acute lymphocytic leukemia protein 1 (TAL-1) | P17542 |
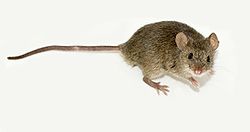
| 3 | Mus musculus (Mouse) | MYOD1_MOUSE | Myoblast determination protein 1 | P10085 |
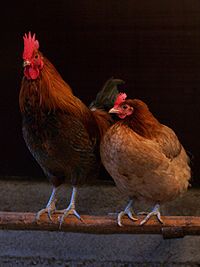
| 4 | Gallus gallus (Chicken) | MYOD1_CHICK | Myoblast determination protein 1 homolog (MYOD1 homolog) | P16075 |
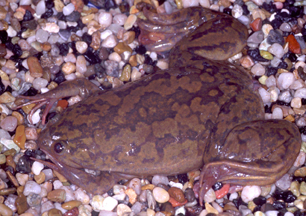
| 5 | Xenopus laevis (African clawed frog) | MYODA_XENLA | Myoblast determination protein 1 homolog A (Myogenic factor 1) | P13904 |
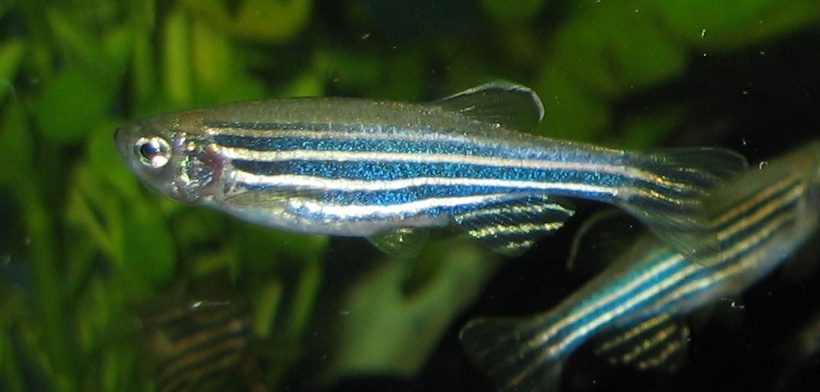
| 6 | Danio rerio (Zebrafish) | MYOD1_DANRE | Myoblast determination protein 1 homolog (Myogenic factor 1) | Q90477 |
| 7 | Branchiostoma belcheri (Amphioxus) | Q8IU24_BRABE | MyoD-related | Q8IU24 |
| 8 | Drosophila melanogaster (Fruit fly) | MYOD_DROME | Myogenic-determination protein (Protein nautilus) (dMyd) | P22816 |
| 9 | Caenorhabditis elegans | LIN32_CAEEL | Protein lin-32 (Abnormal cell lineage protein 32) | Q10574 |
| 10 | Homo sapiens (Human) | SYFM_HUMAN | Phenylalanyl-tRNA synthetase, mitochondrial | O95363 |
For example, the FASTA link for the first human sequence should take you to http://www.uniprot.org/uniprot/P15172.fasta and
should look like this:
>sp|P15172|MYOD1_HUMAN Myoblast determination protein 1 OS=Homo sapiens GN=MYOD1 PE=1 SV=3
MELLSPPLRDVDLTAPDGSLCSFATTDDFYDDPCFDSPDLRFFEDLDPRLMHVGALLKPE
EHSHFPAAVHPAPGAREDEHVRAPSGHHQAGRCLLWACKACKRKTTNADRRKAATMRERR
RLSKVNEAFETLKRCTSSNPNQRLPKVEILRNAIRYIEGLQALLRDQDAAPPGAAAAFYA
PGPLPPGRGGEHYSGDSDASSPRSNCSDGMMDYSGPPSGARRRNCYEGAYYNEAPSEPRP
GKSAAVSSLDCLSSIVERISTESPAAPALLLADVPSESPPRRQEAAAPSEGESSGDPTQS
PDAAPQCPAGANPNPIYQVL
As noted, the line beginning with '>' is an identifier/comment, not part of the sequence.
Do stop to browse the primary page a bit before you click through. (And Wikipedia also has a nice picture of MyoD.) What does each protein do?
Write: a one sentence summary of the protein's (known) function.
Based on that, write whether you expect each protein to be similar to the others or not.
Implementation:
Implement the Smith-Waterman local sequence alignment algorithm (text, section 2.3; also approximately slides 35--45 of the "alignment" slide set on the course web), and its associated traceback.
Also implement the permutation-based "empirical p-value" calculation from lecture (last three slides from the "alignment" slide set, with more detail to come in the "BLAST/Scoring" slide set). I.e., if k of n random trials have scores ≥ the score of the real data, the empirical p-value is (k+1)/(n+1). (NOT k/n!)
Implement your S-W algorithm to match the following I/O specification:
Inputs: a pair of amino acid sequences s1 and s2, as character strings, together with the identifiers of those sequences, and an integer N, specifying the number of permutations to evaluate. (N=0 means no permutations; input characters other than the codes for the 20 standard amino acids, if present, should be ignored/deleted.)
Scoring: Use the BLOSUM62 matrix you acquired in step II(a) together with a simple linear gap cost of -4 (linear, not affine; i.e., every letter aligned with a dash costs -4, whether or not its neighbors are also dashes; this is an arbitrary value, not a recommended default). (Build the scoring matrix into your program, e.g., as a constant, not data read from a file.) )
Output (where, to be super-picky, "print" means "capture in a simple text file" so that you can electronically submit to us, and please print them in this order) :
The proteins given above are somewhat lengthy. To make the alignments legible, break them into blocks of 60 columns (except, perhaps, the last). To the left of each row of the alignment, give the (1-based) index of the first letter in that row with respect to the sequence from which it was extracted (not counting gaps). Do not print the prefix/suffix parts of the sequences that are not on the optimal path found by Smith-Waterman. Leave a blank line between successive pairs of lines. Extra credit: If you want to be extra-fancy, replace the blank middle line of each pair so as to highlight the similarities, as BLAST output does; e.g.
P68871:  62  KAHGKKVLGAFSDGLAHLDN---LKGTFATLSELHCDKLHVDPENFRLLGNVLVCVLAHH
             +AH   V+ A ++ +  L +   ++ +   L E H  K     E F+ L  V++ VL
Q14SN0:  83  QAHCAGVITALNNVIDFLHDPGLMEASLIGLVERH-KKRGQTKEEFQNLKEVMLEVLRQA

P68871: 119  FGKEFTPPVQAAYQKVV
              GK++TP V  A+ K +
Q14SN0: 142  LGKQYTPEVAEAWNKTL
where letters flag identities, and plus signs mark differences with positive BLOSUM 62 substitution scores.
Some examples, in a slightly different format, may be found here.
Implement a main program ``wrapper'' to call the above routine to generate the specific test cases detailed below.
Run your code to align and score the pair of strings s1="deadly" and s2="ddgearlyk". As detailed above, print the optimal score, the alignment produced by your trace-back, and the full alignment matrix. Also calculate the empirical p-value. For consistency, please do exactly 999 permutations of s2 for this test.
Similarly, align and score each protein sequence from II(b) against the others (10 choose 2 non-identical pairs). (As above, print identifiers, scores, and one alignment for each, as illustrated in point III(C), but don't print the score matrix for these larger examples.)
For the k=10 sequences from II(b), do the comparisons in the order
  for 1 <= i < k do
    for i < j <= k do
      compare seq[i] to seq[j]
and when calling your Smith-Waterman subroutine, pass seq[i] as s1, seq[j] as s2, (i<j).
You may build these 10 sequences into you code as constants or read them from a file or files. The later option may be more convenient for some of the extra credit options.
Only calculate empirical p-values for the significance of the alignments of P15172 versus Q10574 and for P15172 versus O95363. (These should be among the lowest-scoring alignments; I think you'd find the others generally have much better, i.e., much smaller, p-values, but you need not try to estimate them.) Do as many random permutations as you have time/patience for, but at least 999 for each.
Deliverables:
Give us your (commented) source code plus any necessary auxiliary files. (We do not want compiler-generated binaries and such; they are bulky and we can regenerate them.)
Place the test case outputs in one file named "outputs.txt".
Finally, give us a brief summary named report.x (x = .pdf, .doc[x], .rtf, or .txt). Paste in
the full output from test case III(1), and include a 10 by 10 upper triangular matrix showing the score you
found for the alignment of protein i to protein j, i,j = 1, ..., 10 (numbered
as in the table in II(b)), as well as the two p-values from III(3). Say how many random trials you did for each.
Include your notes from step II(b) and a brief reflection on whether your assessments of the similarities of
these proteins changed as a result of seeing these alignments and their scores.
Also include a short file named build.txt with instructions for building and running your
code unless it is completely straightforward.
Extra Credit Options. (If you do any of these, include a separate, brief write-up named
extra-credit-report.x (x = .pdf, .doc[x], .rtf, or .txt) describing what you did and what you
learned.) Do one or more of:
Implement the extra-fancy alignment option mentioned in III(c).
There is a very seductive but INCORRECT algorithm for shuffling that, historically, many students have used, despite our warnings. Read the blog post about it, linked from slide 48. Does it correctly shuffle a 2 card deck? Explain why or why not.
Implement the global (Needleman-Wunsch) alignment algorithm, run it on the same examples, and compare/contrast results.
Implement the affine gap version of S-W and/or N-W, and compare the alignments it generates to those you got above. Try gap initiation cost -11 and gap extension cost -1. These may or may not be good choices; feel free to experiment with others, tell me what you picked and why. The proteins above may not be the best choices; feel free to pick others, e.g., perhaps more remote bHLH transcription factors, or a different family altoghther.
Intuitively, higher-scoring pairs of proteins are more closely related evolutionarily than are lower-scoring pairs. Use the score data you've generated to suggest an evolutionary tree relating these proteins, and outline how you might do this in general. How does this tree compare to generally accepted evolutionary relationships among these species? You might also find it helpful to calculate some other simple summary statistics, e.g., the percent of identical residues in the alignment, length of the alignment, etc. You might want to add related proteins from other species; try using "BLAST" at NCBI or SwissProt to find interesting ones.
For most real proteins, there are an astronomical number of permutations, so chosing a random sample is perhaps the best we can do. For the short deadly/ddgearlyk test case, however, there are only 9!/2! = 181440 distinct permutations. So, you could afford to find exactly how many of permutations outscore (or tie) the given pair. Try it. Compare it to several (say 20) separate trials of 10000 permutations each, and to the composite result of 200,000 random permutations (i.e., with no explicit attempt to control for duplicates in either).
I suggested that permuting the data base sequences is better than generating random sequences based on uniform or average "background" residue frequencies. Try the the later as well, and compare the two methods. You may need to find other example data than the ones above to highlight the differences.
In addition to counting how many permutations give scores as good as the unpermuted sequence, look at the distribution of these random scores. Does it look Gaussian (Normal)? Does it look more like the EVD? Some other distribution? What are the mean and standard deviation of the random scores? Is the real score within 1 or 2 standard deviations of the mean, or is it more extreme? Assuming the distribution is approximately normal, what is the probability of drawing a sample as extreme as the real score?
Find code on the web for calculating (gapless) EVD K and lambda parameters from your score matrix. Estimate significance this way and compare to the permutation p-values above.
Automate the "get FASTA files" and/or other steps of the assignment using public frameworks such as BioPython (or R/Bioconductor, BioPerl, BioJava, .Net Bio ...). Such resources are great, but a word of caution: Last time I looked, BioPython's Smith-Waterman code was wrong. So always maintain a healthy skepticism...
Use of EVD for gapless alignment is theoretically justified, but this is not known to be true for gapped
alignments (at least not yet; it's a hard problem to analyze). However, empirically, it seems to work
reasonably well. A complication, however, is that there isn't a handy theory available to calculate the lambda
and K parameters needed in the EVD formulae. Instead, one estimates them by scoring some random sequences, and
(roughly) doing a curve-fitting procedure. The advantages of this over permutation p-values are that (1) you
only have to do the randomization once for a given score table, rather than repeat it for each sequence for
which you want a p-value, and (2) you can extrapolate the EVD well beyond the random data you started with,
e.g., estimate p-values of 10-9 without doing 109 random trials. Eddy lays this out very
nicely in this TR. Try
it, and compare results to the above approaches. Eddy's "histogram.c" in his HMMer package (or perhaps
esl_gumbel_* is his EASL package within HMMer or INFERNAL) does most of the work for you. There's
also a Perl wrapper for it in BioPerl, if you find Perl more convenient (and possibly also in BioJava,
etc., I haven't looked.)
Permutation p-values might be more reliable if your permutations conserved the observed frequencies of adjacent amino acids ("di-residue" statistics) as well as conserving the overall frequency of each in isolation, as the simple permutation approach does. This is an interesting theoretical and algorithmic problem, but you can find code to do this, e.g., perhaps use (M Jiang, J Anderson, J Gillespie, M Mayne, "uShuffle: a useful tool for shuffling biological sequences while preserving the k-let counts." BMC Bioinformatics, 9, (2008) 192. ) or generalize this to handle the larger amino acid alphabet. Try one of them on the MyoD data. Are p-values generally better or worse with di-residue shuffling?
Do a similar exploration of related sequences in some other protein family over large evolutionary distances. Proteins involved in very fundamental processes (replication, ribosome, chromatin structure, ...) are likely to be highly conserved; those more specific to "modern" developments, neuronal proteins for example, may be more rapidly evolving. What do you find? Is Blosum 62 a good choice for this?
Do some timing studies of your algorithm. Does it match the theoretical O(n2) prediction? How long do you estimate it would take to compare, say, all 5000 E. coli proteins to each other? Note that the p-value calculations will dominate the running time. Outline some possible strategies for reducing this burden.
If you have other ideas you'd like to explore, talk to me.
Turn in: Gather the files listed in Deliverables in a single folder. Bundle everything into a single .zip or .tgz file and UPLOAD IT TO CANVAS. Make sure your name, email, and student number are included in the writeup and in comments in your code, and clearly label any extra credit components. Include build/run instructions unless they are completely trivial. Please do not include easily rebuilt object or binary files, core dumps, etc.; they are bulky...
|
Computer Science & Engineering University of Washington Box 352350 Seattle, WA 98195-2350 (206) 543-1695 voice, (206) 543-2969 FAX | |