Outline
Outline |
|
Turn in all your source and write-up files at https://catalyst.uw.edu/collectit/dropbox/tompa/16472. Turn in all your new files, including any additional Java files you created for testing and any provided files you modified. Do not turn in the JSR166 library.
You are encouraged (although not required) to work with a partner of your own choosing for this project. Feel free to use the class mailing list to help find a partner. No more than two students can be on a team. You may divide the work however you wish, under three conditions:
Test all your code together to make sure that your portions interact properly! Do not attempt to merge your code on the project due date: you will very likely have problems. Also be aware that, except in extreme cases when you notify us in advance of the deadline, team members will receive the same project grade.
If you work with a partner, only one of you should turn in the files. The other should turn in a one-sentence text file providing the name of the partner.
The files you need are provided here:
You will also find the Introduction to the ForkJoin Framework (JSR 166) useful. Read and understand those notes, as they contain guidelines and advice that will save you debugging headaches later.
The availability of electronic data is revolutionizing how governments, businesses, and organizations make decisions. But the idea of collecting demographic data is not new. For example, the United States Constitution has required since 1789 that a census be performed every 10 years. In this project, you will process some data from the 2000 census in order to answer efficiently certain queries about population density. These queries will ask for the population in some rectangular area of the country. The input consists of "only" around 210,000 data points, so any desktop computer has plenty of memory. On the other hand, this size makes using parallelism less compelling (but nonetheless required and educational).
You will implement the desired functionality in several ways that vary in their simplicity and efficiency. Some of the ways will require fork-join parallelism and, in particular, Java's ForkJoin Framework. Others are entirely sequential.
A final portion of this project involves comparing execution times for different approaches and parameter settings. You will want to write scripts or code to collect timing data for you, and you will want to use a machine that has at least 4 processors. The department labs have 24 such machines clearly labeled "QUAD", 13 running Windows and 11 running Linux, pretty evenly spread across the three labs (002, 006, 022).
This project is an experiment where much of the coding details and experimentation are left to you, though we will describe the algorithms you must use. Will parallelism help or hurt? Does it matter given that most of your code runs only in a preprocessing step? The answers may or may not surprise you, but you should learn about parallelism along the way.
For this project, you will:
The file blkgrp_pop_centroid_withname.txt (distributed with the project files) was published
by the U.S. Census Bureau at
http://www.census.gov/geo/www/cenpop/blkgrp/bg_cenpop.html.
(It is in the .zip file under the "All 50 States" link at
the bottom.) The data divides the U.S. into 211,267 geographic areas
called "census-block-groups" and reports for each such group the
population in 2000 and the latitude and longitude of the group. It
actually reports the average latitude and longitude of the people in
the group, but that will not concern us: just assume everyone in the
group lived at this single point.
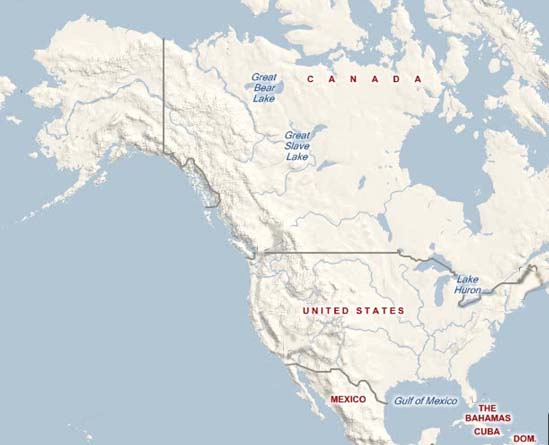
Given this data, we can imagine the entire U.S. as a giant rectangle bounded by the minimum and maximum latitude and longitude of all the census-block-groups. Most of this rectangle will not have any population:
Note that the code we provide you reads in the input data and changes the coordinates for each census group. That is because the Earth is spherical but our grid is a rectangle. Our code uses the Mercator Projection to map a portion of a sphere onto a rectangle. It stretches latitudes more as you move north. You do not have to understand this except to know that the latitudes you will compute with are not the latitudes in the input file. You can manually disable this projection while testing by changing the code if you find it helpful to do so.
We can next imagine answering queries related to areas inside the U.S.:
Such questions can reveal that population density varies dramatically in different regions, which explains, for example, how a presidential candidate can win despite losing the states that account for most of the geographic area of the country. By supporting only rectangles as queries, we can answer queries more quickly. Other shapes could be approximated using multiple small rectangles.
Your program will first process the data to find the four corners of the rectangle containing the United States. Some versions of the program will then further preprocess the data to build a data structure that can efficiently answer the queries described above. The program will then prompt the user for such queries and answer them until the user chooses to quit. For testing and timing purposes, you may also wish to provide an alternative where queries are read from a second file.
The first three command-line arguments to your program will be:
x and y describing the size of a grid
(a two-dimensional array, which in Java means an array of arrays) that is used to express population queries
Suppose the values for x and y are 100 and
50. That would mean we want to think of the rectangle containing the
entire U.S. as being a grid with 100 columns (the x-axis) numbered 1
through 100 from west to east and 50 rows (the y-axis) numbered 1
through 50 from south to north. (Note we choose to be "user
friendly" by not using zero-based indexing.) Thus, the grid would
have 5000 little rectangles in it. Larger x and
y will let us answer
queries more precisely but will require more time and/or space.
A query describes a rectangle within the U.S. using the grid. It is simply four numbers:
x.y.x.y.You program should print a single one-line prompt asking for these four numbers and then read them in. Any illegal input (i.e., not 4 integers on one line) indicates the user is done and the program should end. Otherwise, you should output two numbers:
You should then repeat the prompt for another query.
To implement your program, you will need to determine in which grid position each census-block-group lies. That will require first knowing the four corners of the U.S. rectangle, which can be computed by finding the minimum and maximum latitude and longitude over all the census-block-groups. Note that smaller latitudes are farther south and smaller longitudes are farther west. Also note all longitudes are negative, but this should not cause any problems.
You will implement 4 versions of your program. There are signficant opportunites to share code among the different versions and you should seize these opportunities. So dividing the work with your partner by splitting up the versions may not work well.
Before processing any queries, process the data to find the four corners of the U.S. rectangle using a sequential O(n) algorithm, where n is the number of census-block-groups. Then for each query do another sequential O(n) traversal to answer the query (determining for each census-block-group whether or not it is in the query rectangle). The most reusable approach for each census-block-group is probably to first compute what grid position it is in and then test if this grid position is in the query rectangle.
This version is the same as version 1 except both the initial corner-finding and the traversal for each query should use the ForkJoin Framework effectively. The work will remain O(n), but the span should be O(log n). Finding the corners should require only one data traversal, and each query should require only one additional data traversal.
This version will, like version 1, not use any parallelism, but it will perform additional preprocessing so that each query can be answered in O(1) time. This involves two additional steps:
x*y (use an array of arrays) where each element is
an int that will hold the total population for that grid position. Recall x and
y are the command-line arguments for the grid size.
Compute the grid using a single O(n) traversal, where
n is the number of census-block-groups.
For example, suppose after step 1 we have this grid (with x=y=4):
0   11   1  9
1   7    4  3
2   2    0  0
9   1    1  1
Then step 2 would update the grid to be:
0   11  12  21
1   19  24  36
3   23  28  40
12  33  39  52
There is an arithmetic trick to completing the second step in a single pass over the grid. Suppose our grid positions are labeled starting from (1,1) in the bottom-left corner. (You can implement it differently, but this is how queries are given.) So our grid is:
(1,4)  (2,4)  (3,4)  (4,4)
(1,3)  (2,3)  (3,3)  (4,3)
(1,2)  (2,2)  (3,2)  (4,2)
(1,1)  (2,1)  (3,1)  (4,1)
Now, using standard Java array notation, notice that after step 2, for
any element not on the left or top edge:
grid[i][j]=orig+grid[i-1][j]+grid[i][j+1]-grid[i-1][j+1],
where orig is grid[i][j] after step 1. So
you can do all of step 2 in O(xy) time by simply proceeding one row at
a time top to bottom -- or one column at a time from left to right, or
any number of other ways. The key is that you update (i-1,j), (i,j+1)
and (i-1,j+1) before (i,j).
Given this unusual grid, we can use a similar trick to answer queries in O(1) time. Remember a query gives us the corners of the query rectangle. In our example above, suppose the query rectangle has corners (3,3), (4,3), (3,2), and (4,2). The initial grid would give us the answer 7, but we would have to do work proportional to the size of the query rectangle (small in this case, potentially large in general). After the second step, we can instead get 7 as 40 - 21 - 23 + 11. In general, the trick is to:
Notice this is O(1) work. Draw a picture or two to convince yourself this works.
Note: A simpler approach to answering queries in O(1) time would be to precompute the answer to every possible query ahead of time. But that would take O(x2y2) space and preprocessing time.
As in version 2, the initial corner finding should be done in parallel. As in version 3, you should create the grid that allows O(1) queries. The first step of building the grid should be done in parallel using the ForkJoin Framework. The second step should remain sequential; just use the code you wrote in version 3. Parallelizing it is part of the Extra Credit.
To parallelize the first grid-building step, you will need each parallel subproblem to return a grid. To combine the results from two subproblems, you will need to add the contents of one grid to the other. If the grids were always small, doing this sequentially would be okay, but for larger grids you will want to parallelize this as well using another ForkJoin computation. So, in order to merge two results during the parallel grid-building, you will need to add the grids in parallel. (To test that this works correctly, you may need to set a sequential cutoff lower than your final setting.)
Warning: do not attempt to use a single shared grid into which all threads add their results. The result of having two threads writing the same grid cell at the same time is unpredictable!
Note that your ForkJoin tasks will need several values that are the same for all tasks: the input array, the grid size, and the overall corners. Rather than passing many unchanging arguments in every constructor call, it is cleaner and probably faster to pass an object that has fields for all these unchanging values.
The code provided to you will take care of parsing the input file
(sequentially), performing the Mercator
Projection, and putting the data you need in a large array.
The provided code uses float instead of
double since the former is precise enough for the
purpose of representing latitude and longitude and takes only half the
space.
You should avoid timing the parsing since it is slow but not interesting. The rest is up to you. Make good design decisions.
Your main method should be in a class called PopulationQuery and it should
take at least 4 command-line arguments in this order:
x, the number of columns in the grid for queriesy, the number of rows in the grid for queries-v1, -v2, -v3,
or -v4 corresponding to which version of your
implementation to use
You are welcome to add additional command-line arguments after these
four for your own experimentation, testing, and timing purposes, but
your command line parameters should be consistent with those specified
above for our testing, and a cleaner approach would be to use a
different main method in another class.
The write-up requires you to measure the performance (running time) of various implementations with different parameter settings. To report interesting results properly, you should use a machine with at least four processors and report relevant machine characteristics.
You will also need to report interesting numbers more relevant to long-running programs. In particular you need to:
for (i = 0; i<15; i++) Vand average the time of the last 10 iterations. The first few iterations may run slower, until Java decides to invest the effort to optimize V. That is why you ignore the first iterations. Even once this optimization is done, each iteration of V may take a somewhat different amount of time, which is why it is more accurate to take an average of several runs of V. While this is wasted work for your program, (a) you should do this only for timing experiements and (b) this may give a better sense of how your program would behave if run many times, run for a long time, or run on more data.
For guidelines on what experiments to run, see the Write-Up Questions. Note you may not have the time or resources to experiment with every combination of every parameter; you will need to choose wisely to reach appropriate conclusions in an effective way.
We are providing a graphical user interface (GUI) for the program. Using the GUI is optional and we will not use it for grading. We think the GUI will be fun, easy to use, and useful for checking your program against some geographical intuition (e.g., nobody lives in the ocean and many people live in Southern California).
Note: The current version of the GUI runs into problems when executed on a Mac.
The GUI presents a map of the U.S. as a background image with a grid overlaid on it. You can select consecutive grid squares to highlight arbitrary rectangles over the map. When you select run, the GUI will invoke your solution code with the selected rectangle, and display the result.
To use the GUI, first add the following files to the same package
and directory as the rest of your code: USMaps.java,
MapPane.java, InteractionPane.java,
Pair.java, and USMap.jpg. To run the GUI,
run the main method of the class USMaps with the VM argument
-Xbootclasspath/p:jsr166.jar.
Naturally, the GUI needs to call your code and it can only do so if
you implement an API that the GUI expects. To use the GUI, you must write
two methods in the class PopulationQuery with the following
signatures:
public static void preprocess(String filename, int x, int
y, int versionNum);
public static Pair<Integer, Float>
singleInteraction(int w, int s, int e, int n);
The arguments to the preprocess method are the same
arguments that should be passed via the command line to the main
method in PopulationQuery, only parsed into their
datatypes and not as Strings. This method should read the file and
prepare any data structures necessary for the given version of the
program. The arguments to the singleInteraction method are the
arguments that are passed to the program when it prompts for
query input. This method should determine the population size and the
population percentage of the U.S. given the parameters, just as your
program should when given integers at the prompt.
Turn in a report answering the following questions. Note there is a fair amount of data collection for comparing timing, so do not wait until the last minute. Prepare an actual report, preferably a PDF file, but we will also take other common formats such as Microsoft Word.
Do not attempt any of these until your basic program is working correctly and you have completed the write-up described above.
This project was created in Spring 2010 by Dan Grossman. Brent Sandona created the GUI.