Lab 8 - Creating formulas in Excel
Introduction
This lab is an introduction to writing formulas and using functions
in Microsoft Excel. In
this lab you will be using Excel to manipulate ana analyze data from
the 2000 Census. All of the data used in this lab was obtained from the
US Census Bureau's web site at www.census.gov.
The numbers used in the labs are the official counts for the state of
Washington, grouped by age.
For an introduction to Excel and to spreadsheets in general, see
Chapter 13.
1. Open the Lab 8 worksheet
Click on the lab08 link below to download the Excel worksheet we
will be using in this lab. Save the file to the Desktop, or somewhere
else that will be easy to find later. If you have trouble opening the
worksheet file, ask your TA for help.
lab08.xls
A spreadsheet is a tabular document used to store information and
calculations. Each "box" in the spreadsheet is called a cell.
The cells are referenced by row and column. The rows are numbered,
starting with one and increasing down the page. The columns are
lettered, and increase as you go to the right. We can refer to a cell
using its column letter and row number. For example, the cell in the
upper-left corner of the sheet is labeled A1.
2. Formatting the spreadsheet
Right now the spreadsheet just looks like a jumble of numbers. We can
change the appearance of the cells to make the spreadsheet easier to
read.
The spreadsheet contains US Census data for the state of
Washington. The data is broken down by age group and gender. Currently
it is difficult to tell what the categories are and where the data
starts.
Let's make the column titles bold so they will be easier to
spot.
Click in cell A1 and drag the mouse to the right so that the top
three boxes (A1, B1, and C1) are selected. Press CTRL+B to make
the text in these cells bold. (Alternately, you could have selected the
B button from the toolbar or selected the font menu by opening
the menu at Format > Cells... and selecting the Font
tab.)
The numerical values in this sheet are still somewhat difficult to
read. We can make the numbers somewhat easier to read by telling Excel
to include commas to denote place values.
By default, Excel does not apply any formatting to your numbers, such
as adding commas or dollar signs. You might want numerical values to be
displayed differently if they were time values or money.
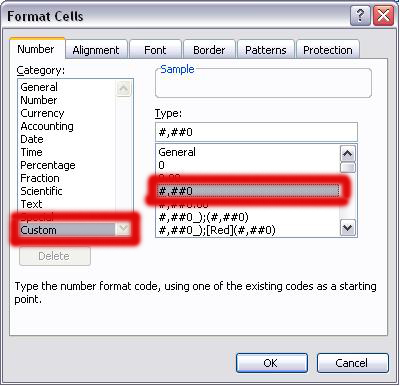
Now we'll add the commas. Click and drag so that all of the values
in columns B and C are highlighted. Then go to Format > Cells...
When the formatting window appears, select the Number
tab to change how numbers are displayed. Select Custom from the
menu and then the #,##0 option as shown below. This option
means that commas will be displayed between the thousands and hundreds
place.
3. Using functions
Now we will use a function to calculate the total number of males and
females recorded by the census. We'll use one of Excel's built-in
functions to calculate the total of each column. Select cell B21.
We're going to put the total sum of the values in column B into this
cell. The SUM function is used to compute the sum of a range of
cells. Once you've entered the formula correctly, Excel will display
the result of the SUM function.
To indicate that you are typing in a function, you must start with
=. Otherwise Excel will not evaluate your input as a formula.
The sum function takes the form =SUM(cell1:cell2),
where cell1 is the first cell in the range and cell2 is the
last cell in the range. This range is simply shorthand for all of the
cells between cell1 and cell2. To indicate a range
in Excel, simply highlight the cells you want to add while you are
editing the formula: Excel will calculate the range and insert it into
the formula.
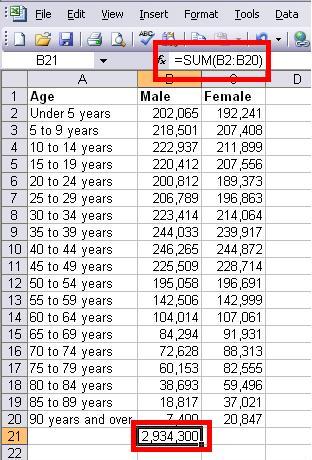
In cell B21, type in the following text: =SUM( . Then
highlight all of the numbered cells in column B. Notice that Excel
calculates the range based on the cells you have highlighted. Now add a
closed parenthesis, ), to your formula. B21 should
now contain the text =SUM(B2:B20)
Press Enter to insert the formula into the cell. The formula will
be replaced by the calculated sum of column B. However, if you click on
the cell, the function will be shown in the function box above the
spreadsheet even though the data is shown in the cell. You can also
edit the formula by double-clicking the cell.
Repeat the steps above to find the total size of the female
population and place it in cell C21.
Since the A column contains labels for each row of data, add a
label TOTAL for row 21. Make this cell bold also.
4. Mathematical functions and Filling
Excel can also handle regular ("infix") arithmetic statements. You can
use + to add numbers, - to subract,
* to multiply, and /
to divide just as you did in JavaScript. Excel uses the standard order
of operations for arithmetic, so make sure to
use parentheses to indicate mathematical precedence.
Now let's add up the female and male populations to get the total for
each age group. We will place this total in column D.
Click on cell D2. This is where we will put the total number of
people under age 5.
Since we are only adding two numbers let's use the + operator in
our function instead of the SUM function (although we could do this).
Once again, enter = to indicate we are using a function.
Then click cell B2 to add this cell to our formula. Type a +
sign and then click on cell C2. The formula should appear as =B2+C2
(you can also enter this directly)
Press Enter to make the total population appear in this cell.
We've now created a formula to calculate the number of people within a
single age group. It would be nice to hasve similar totals for all age
groups, but we don't want to have to enter the formula each time.
Fortunately, Excel provides a short cut for creating copies of similar
formulas. It can fill in formulas for you when you are performing
the same operations on the same cells in each row or column.
Click on cell D2 and drag down to D20 to highlight the cells you
wish to copy your formula into.
Go to Edit>Fill>Down to fill the selected cells with
their correct formula.
Add the label Totals for cell D1.
5. Copying and pasting formulas
You can also copy and paste formulas in Excel. Copying and pasting acts
similarly to the fill operation we performed above: references to cells
in the original formula are replaced with references relative to the
pastw location.
Notice that we have not yet calculated the GRAND total population of
Washington State in 2000.
Let's do so now and put the value into D21.
Click on cell D2 again. Copy the formula with Edit > Copy
or CTRL-C.
Now click on cell D21 and paste the formula with Edit > Paste
or CTRL-V The total population should now be in D21.
The rules that Excel uses to copy and paste formulas can initially seem
confusing. The best way to get a sense for these rules is to experiment
with copying and pasting formulas. Go ahead and try it out until you
have a good sense of how it works.
6. Automatic updating of formula results
When you change data in cells that are used in the formula, the formula
is automatically recomputed and the displayed result is adjusted
accordingly.
Let's say we found out the census data for the 20 to 24 age group was
incorrect and that there were actually only 189,370 females in that age
group. We would want to change the spreadsheet and have all of the
totals reflect those changes.
Click on cell C6, the count for females aged 20 to 24, and type in
the number 189370.
Watch cell D6 as you change C6. The value in D6 will change as you
update C6, and so will the grand total at the bottom of the sheet. This
is a huge advantage to using formulas in Excel. You don't have to go
back through your data and update everything that depends on the value
of C6. Excel does it for you!
7. Boolean operators and the IF function
Excel doesn't just operate on numbers. It can also perform logical
operations using what we call Boolean values, true and false.
Suppose you need to know if an age group has more males than females
and want to display which gender has the greater population. You could
do this arithmetically by and subtracting the number of females from
the number of males, and use numbers
to represent the difference. But this would be unclear to whomever was
reading your data.
It would be much simpler if it just read "males" if there were more
males or "females" if there were more females.
The IF function allows you perform a logical
evaluation of some expression and to perform an action based on the
result of the expression. You can tell Excel what to display if the
expression is true and what to display
if the answer is false. This is similar to the if statements we
encountered in Javascript.
The if function uses the following syntax: =IF(logical
expression, result if true, result if false)
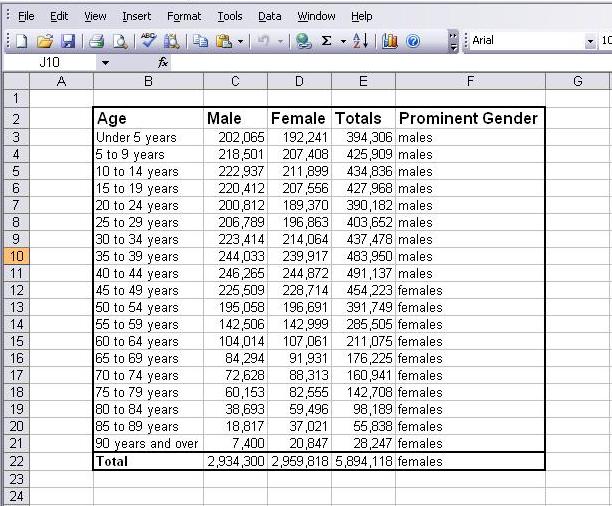
- Look at the under 5 age group again. Let's ask Excel to
determine the gender that has a greater population, and to print the
result in the next available cell, E2.
- Start by typing in the first part of the function =IF(
- Now we need to determine our logical expression. Since we want
to know which gender has a greater population, let's test to see if the
value in the males column is greater than the value in the females
column. We can represent this test in Excel as B2>C2.
Enter this expression and add a comma. The function should now read
=IF(B2>C2,
- We need to specify what should be displayed if the test
condition turns out to be true. If our test is true it means that there
are more males than females, so we would want it to display the string "males"
in the cell. To indicate to Excel that you want it to print exactly
what you have entered, you need to put it in quotes. Add another comma.
Your function should now read =IF(B2>C2,"males",
- The last thing we need to do is specify what to display if the
test condition is false. If it is false there are more females than
males so it should be the string "females". For now,
let's ignore the possibility that there are an equal number of males
and females.
- Complete the function, and press the Enter key to place it in
the cell. The cell should now display: males
- Fill down the rest of the columns so that all age groups have
the same function.
- Give the column the label Prominent Gender
8. Other functions
Excel has a large number of built-in functions that perform many
different operations. Feel free to go in and explore them.
You can find a list of all the available functions by selecting Insert
> Function from the menu. This brings up the following window:
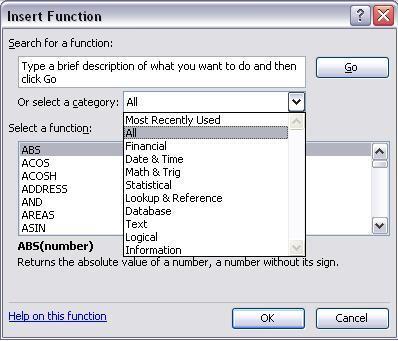
The drop down menu lists the categories of functions. The functions
themselves are displayed
in a list. Click on a function to see a description of what it does and
how to use it.
9. Formatting
Let's clean up the spreadsheet and make it a little more presentable.
- Let's make the font a little bigger on the headlines. Select
the entire row 1 by clicking on the label 1 in the
far left margin. Select the font size drop down menu from the
toolbar and change
the font size to 12. Notice that the cells automatically get taller to
accommodate the larger text.
- Notice how the text Prominent Gender in cell E1
overlaps the end of the cell. We can change the width of the cell by
clicking and dragging the line between the E and F
columns in the header. You can also double click on the line and it
will automatically resizethe cells in the column so that the longest
cell entry fits entirely
in the cell. Sometimes finding the exact spot to click and drag can be
difficult. You can tell that the cursor is in the proper position to
resize the cell when the following icon appears:

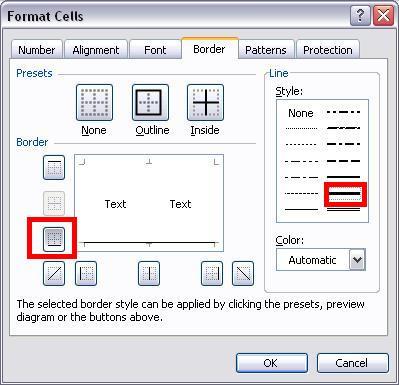
- It's hard to differentiate between the original data and the
computed totals, so let's add visual lines to our sheet to make
that distinction clearer. Click and drag to select all cells from A2 to
E20.
Then go to Format > Cells and click on the Border
tab. We're going to specify a thick border along the bottom of the
cells. Click on the
options shown in red below:
- Now let's put a thick border around the part of the worksheet
containing data. Select all of the cells with data in them. Choose
Format > Cells and return to the Border tab.
This time click on the "Outline"
box at the top of the window. Also, make sure you specify what
thickness of border you want
on the right hand side of the window. In Eccel, you must choose the
line width before you choose the border type.
- Finally, let's add a margin to the top and left of our
spreadsheet by inserting blank rows into these areas. To insert a row
above the top of the data, click on the label 1 in
the far left margin. Then choose Insert > Row
from the menu. This will insert a new row above the current data, and
shift the other rows down. Do the same to add a column by clicking on
the label A on the header above and then selecting
Insert > Column from the menu.
Your final spreadsheet should look like this: